

Crypto Today: Bitcoin renews bid for $120,000 as Ethereum, XRP reinforce uptrend
- Bitcoin rebounds toward $120,000 as the US Dollar starts the week on the back foot.
- Ethereum extends its rally for a ninth consecutive day, supported by steady institutional demand and retail interest.
- Bullish momentum drives XRP toward the recent record highs, increasing the chances of a breakout to $4.00.
The cryptocurrency market's bullish outlook remains steady on Monday, with some tokens, such as Ethereum (ETH), sustaining gains for up to nine consecutive days. Interest in altcoins is gaining traction, suggesting a shift in capital from Bitcoin (BTC).
According to CoinGlass data, the Altcoin Season Index currently stands at 53, representing a significant increase from levels around 20 as of July 1. Notably, a signal for the altcoin season will be triggered once the index reaches 75. Moreover, Bitcoin dominance has declined to 58.7%, according to CoinGecko data, suggesting that more money is flowing into the altcoin market.
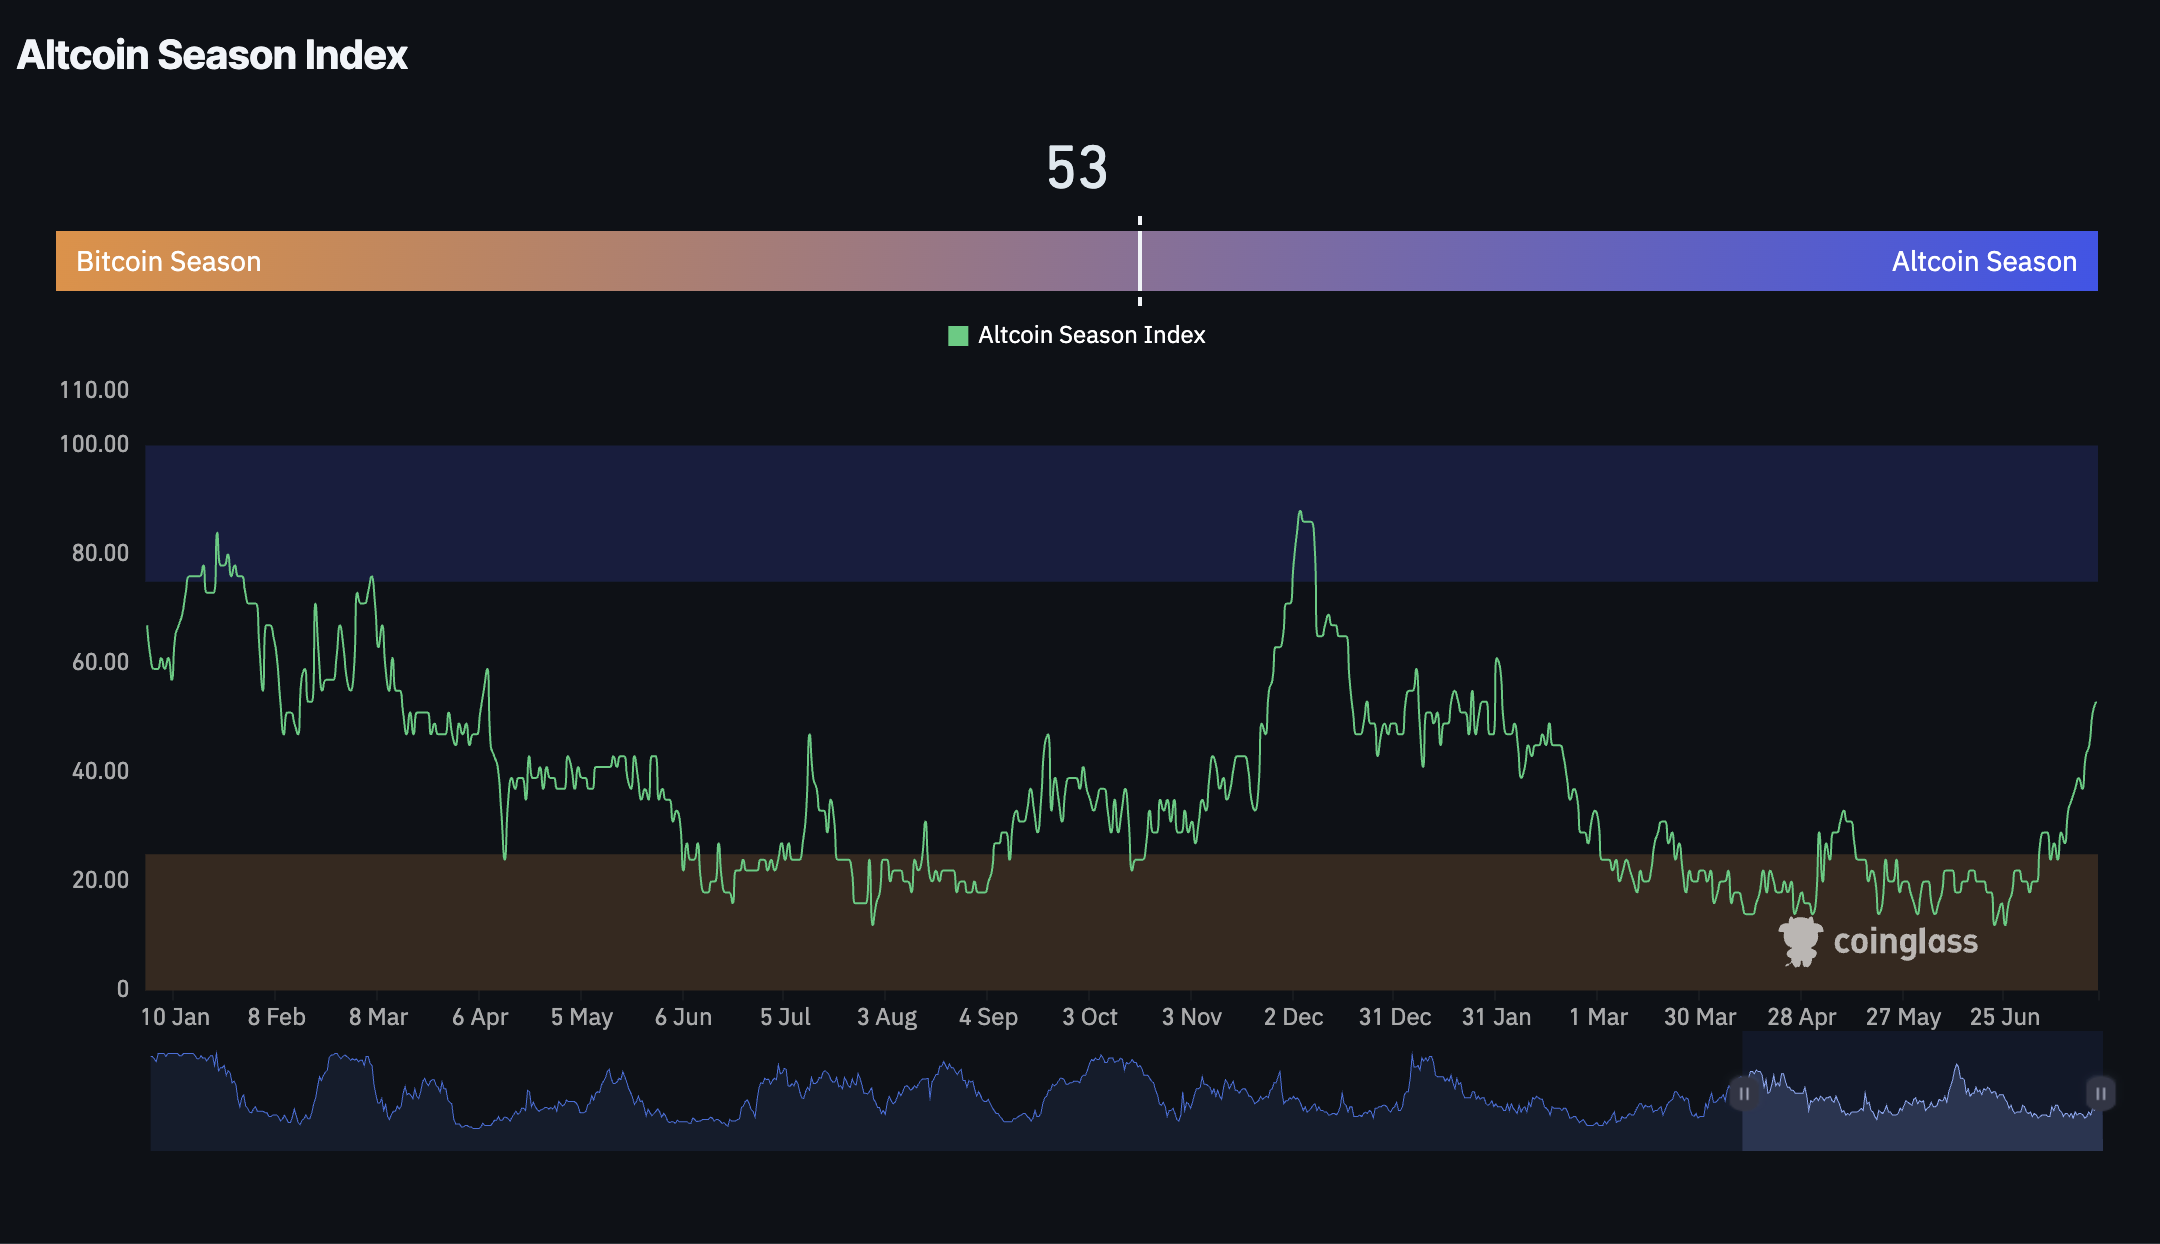
Altcoin Season Index | Source: Coin Glass
The largest cryptocurrency by market capitalisation holds above $119,000 support as bulls look forward to a breakout above $120,000.
Market overview: Altcoins lead crypto gains as US Dollar struggles
The US Dollar (USD) continues to struggle against the other leading currencies, starting Monday on the back foot. Based on the daily chart below, the US Dollar Index (DXY), which tracks USD value against six other global currencies, has slipped to 98.17 after a brief recovery slightly close to 99.00 last week.
Uncertainty about the implementation of Trump's higher tariffs on August 1 and rising inflation in the United States (US) are among the factors likely keeping the USD suppressed.
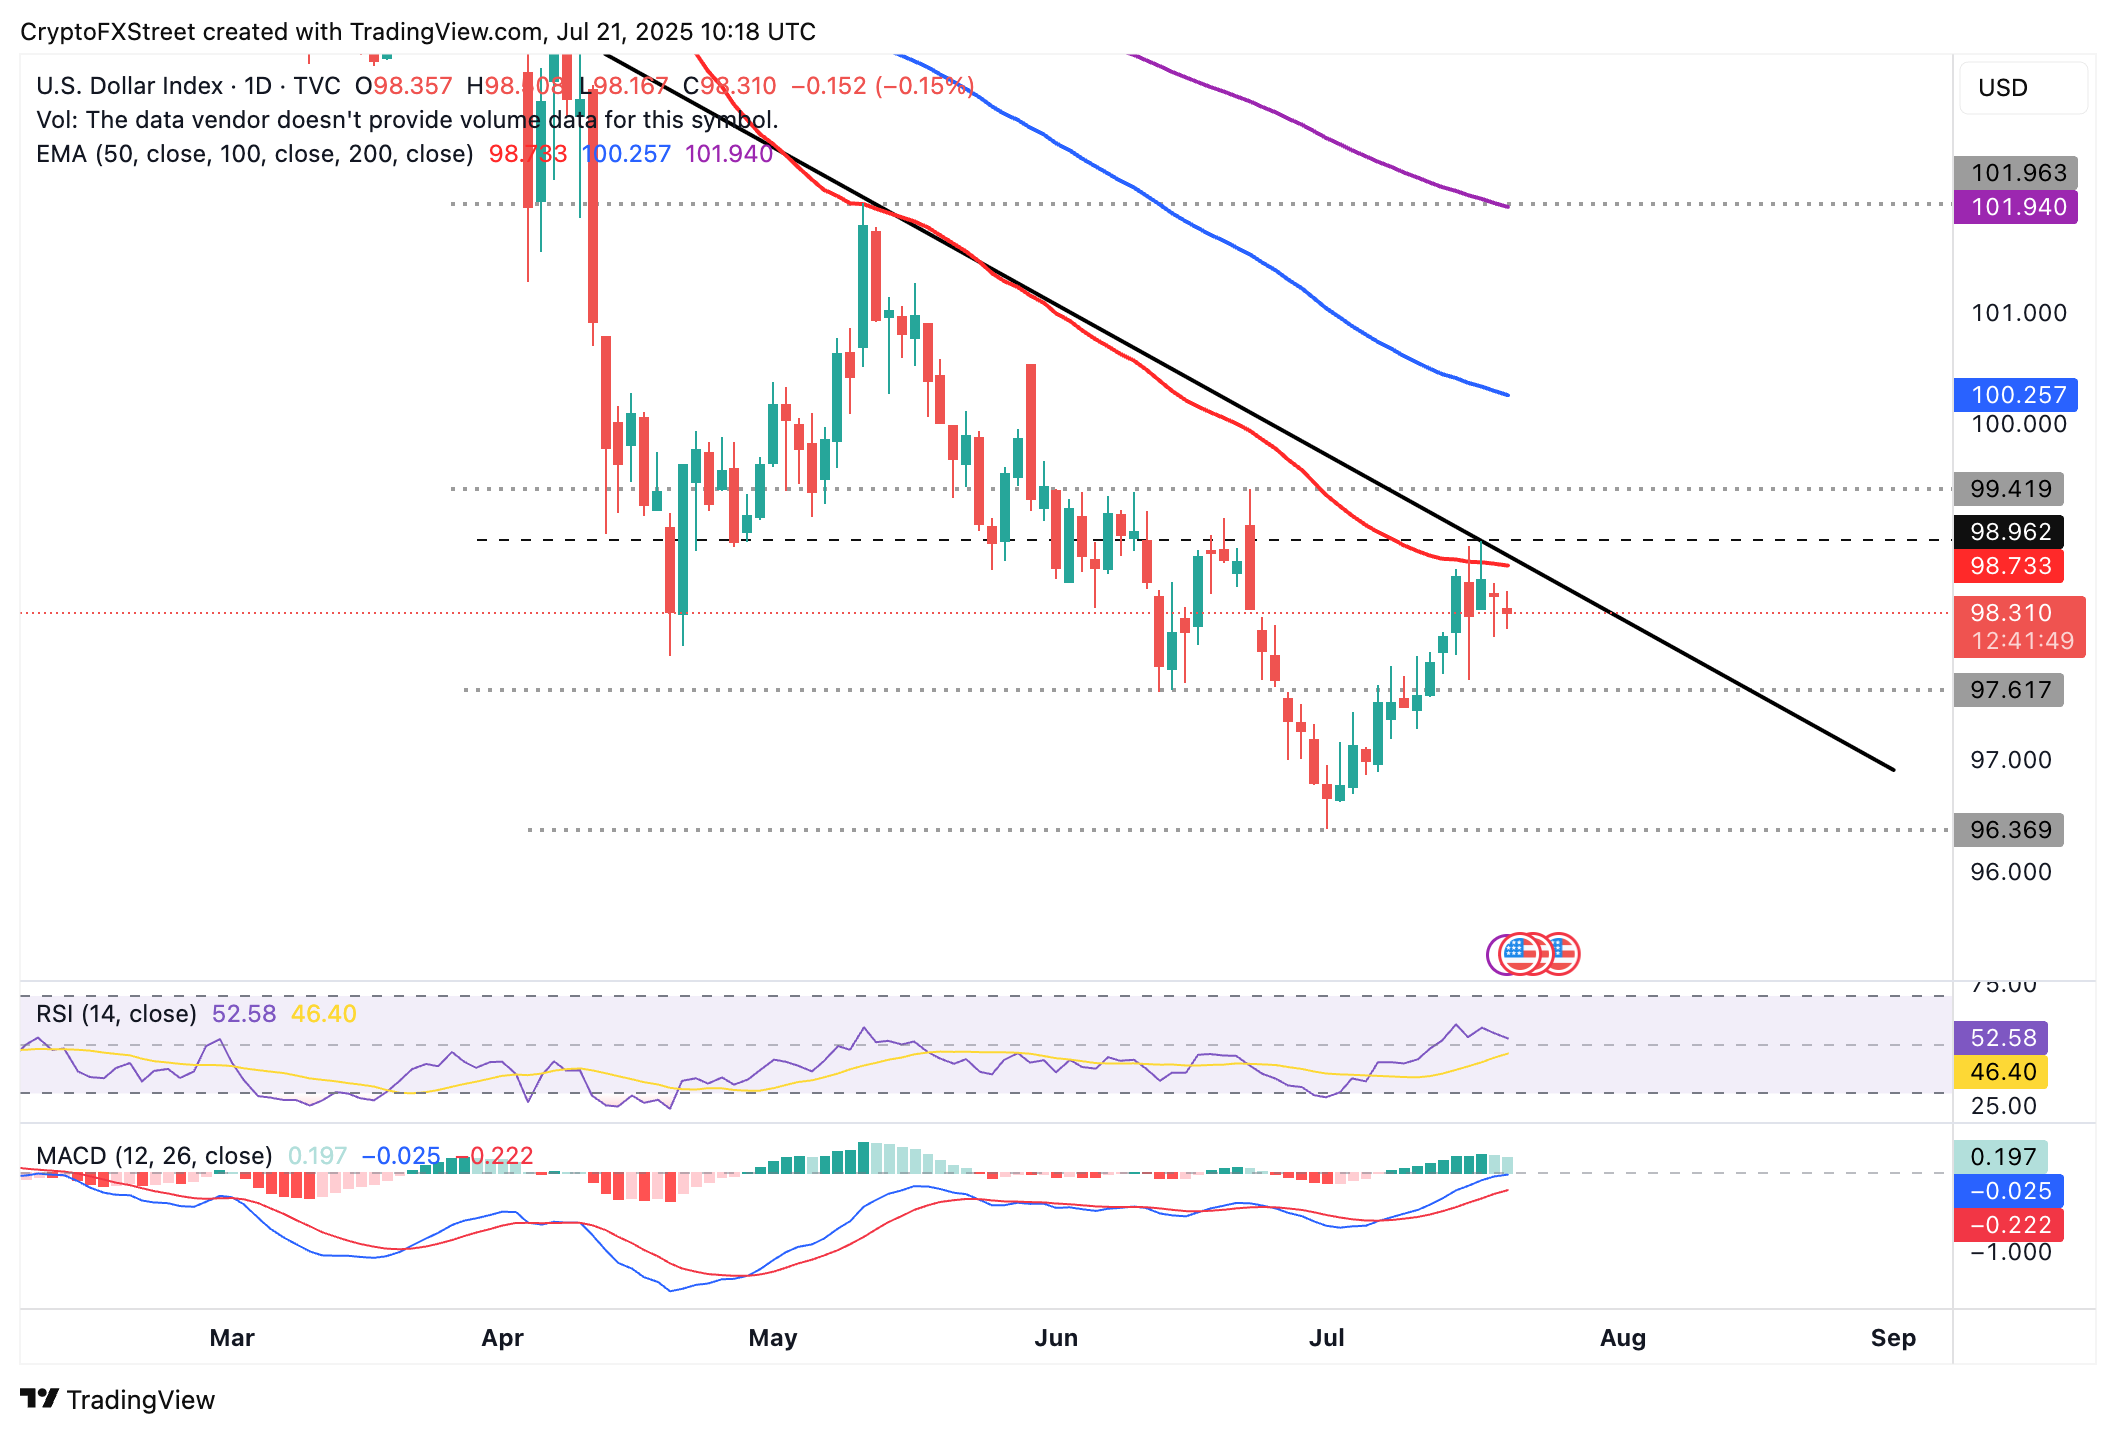
DXY/USD daily chart
Data spotlight: Digital asset fund inflows surge, reaching $4.39 billion
Digital asset products recorded all-time high weekly inflows of $4.39 billion last week, according to the CoinShares report, released every Monday. Inflows into Ethereum financial products were nearly equal to those into Bitcoin, at $2.12 billion. This pushed the year-to-date (YTD) inflows to $6.2 billion, with Assets Under Management (AUM) averaging $26 billion.
Bitcoin saw inflows of $2.2 billion last week, backed by steady demand for spot Exchange-Traded Funds (ETFs). The YTD inflows average $20.6 billion, with AUM standing at $181 billion.
Following net outflows the previous week, interest in XRP made a comeback, resulting in a total net inflow of $36.1 million, as shown in the chart below. Other assets with significant inflows include Solana (SOL), with $39.1 million, and Sui (SUI), with $9.3 million.
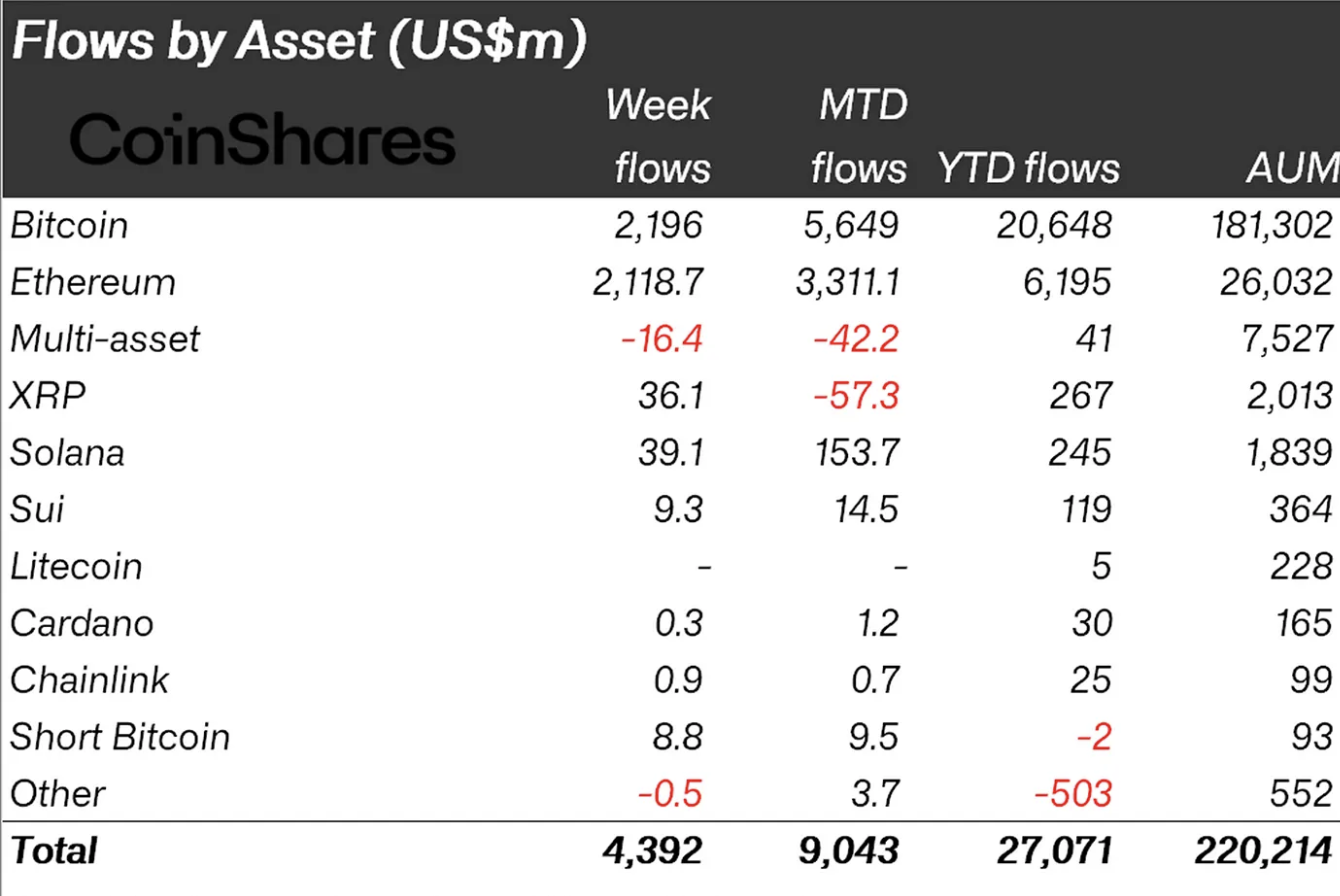
Digital asset fund inflow data | Source: CoinShares
Chart of the day: Bitcoin renews bid eyeing gains above $120,000
Bitcoin price is attempting to recover above $119,000, supported by immense interest from institutional investors and low selling pressure, despite holding near record highs, which reached $123,218 on July 14.
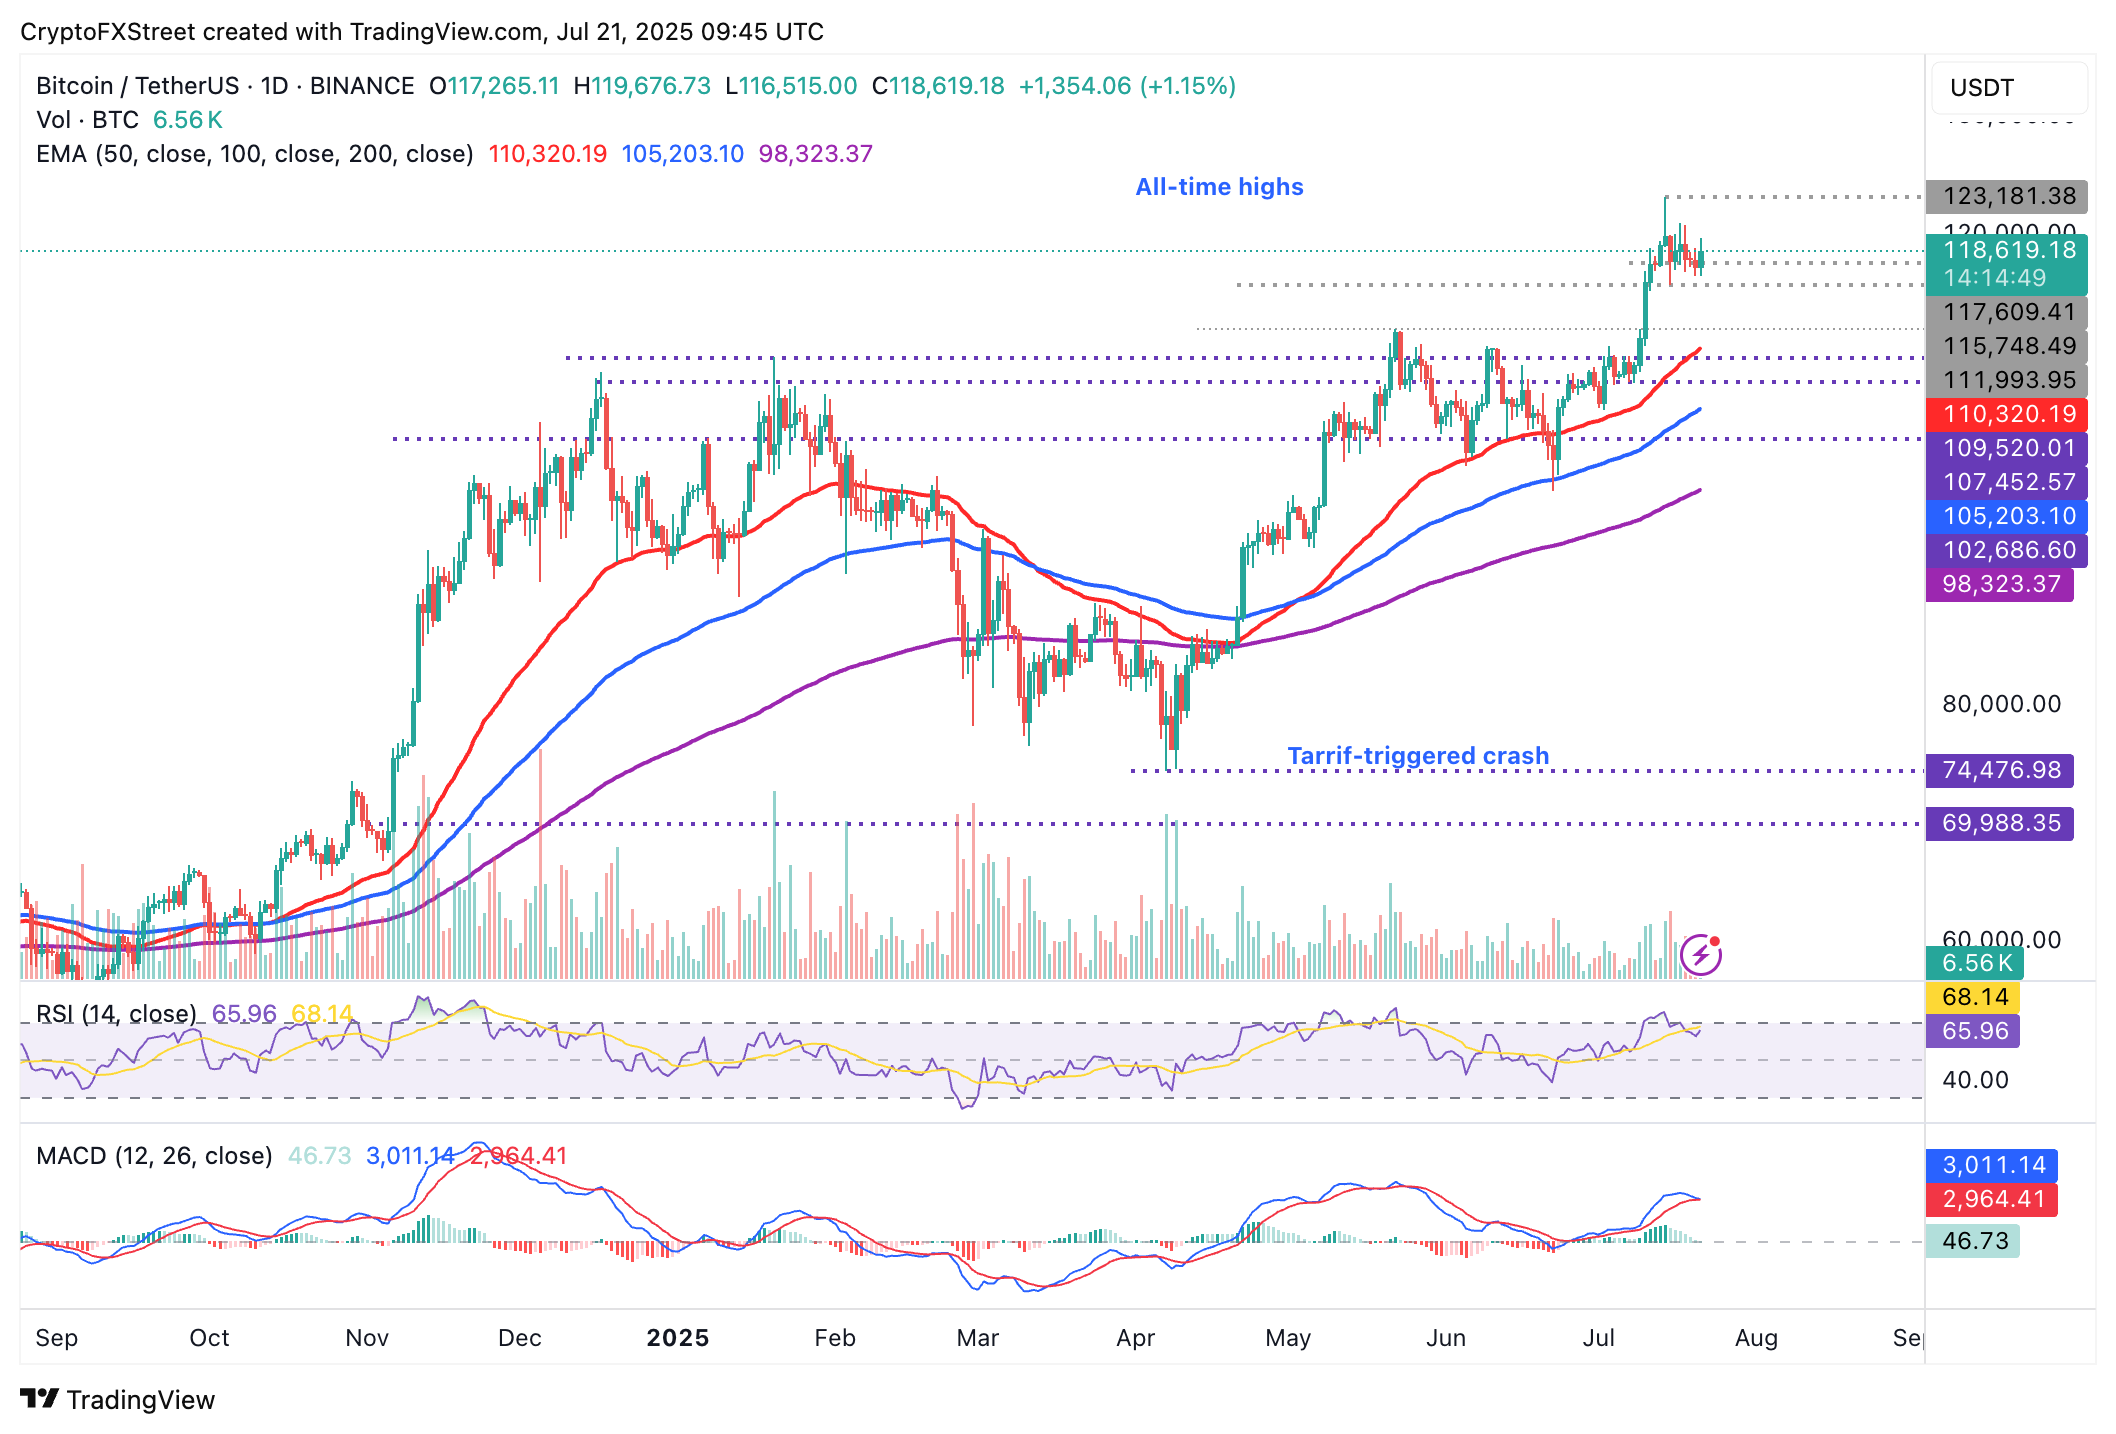
BTC/USDT daily chart
The upward-facing moving averages, starting with the 50-day Exponential Moving Average (EMA) at $110,320, the 100-day EMA at $105,203 and the 200-day EMA at $98,323, reinforce the robust technical structure.
A break above $120,000 could affirm the breakout to record highs and potentially to $125,000 based on Polymarket betters. Participants in the prediction market believe that Bitcoin has a 45% chance of hitting $125,000 by the end of July.
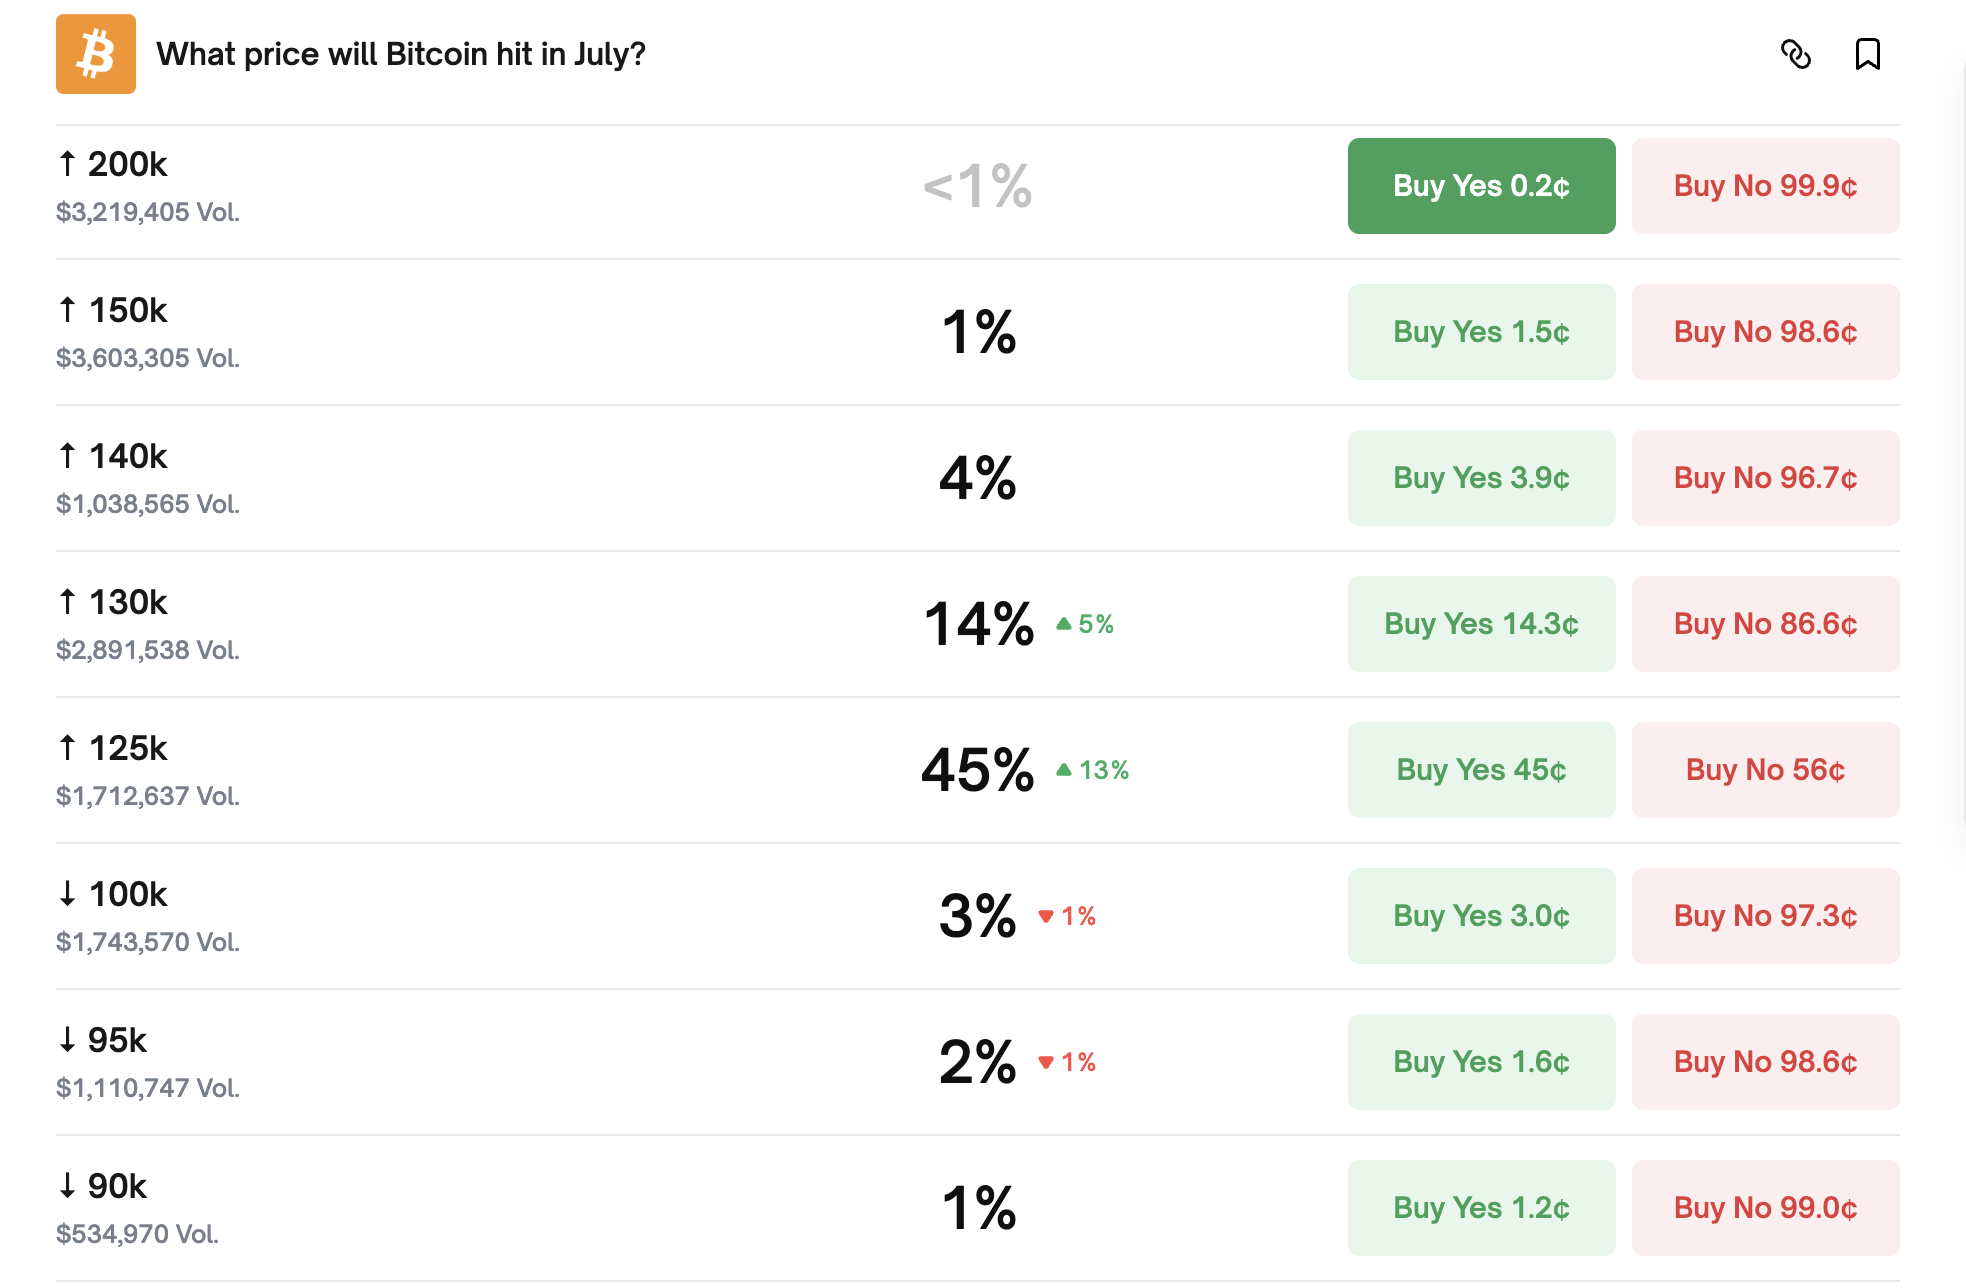
Bitcoin could hit $125,000 by July-end | Source| Polymarket
Altcoins update: Ethereum, XRP bulls tighten grip
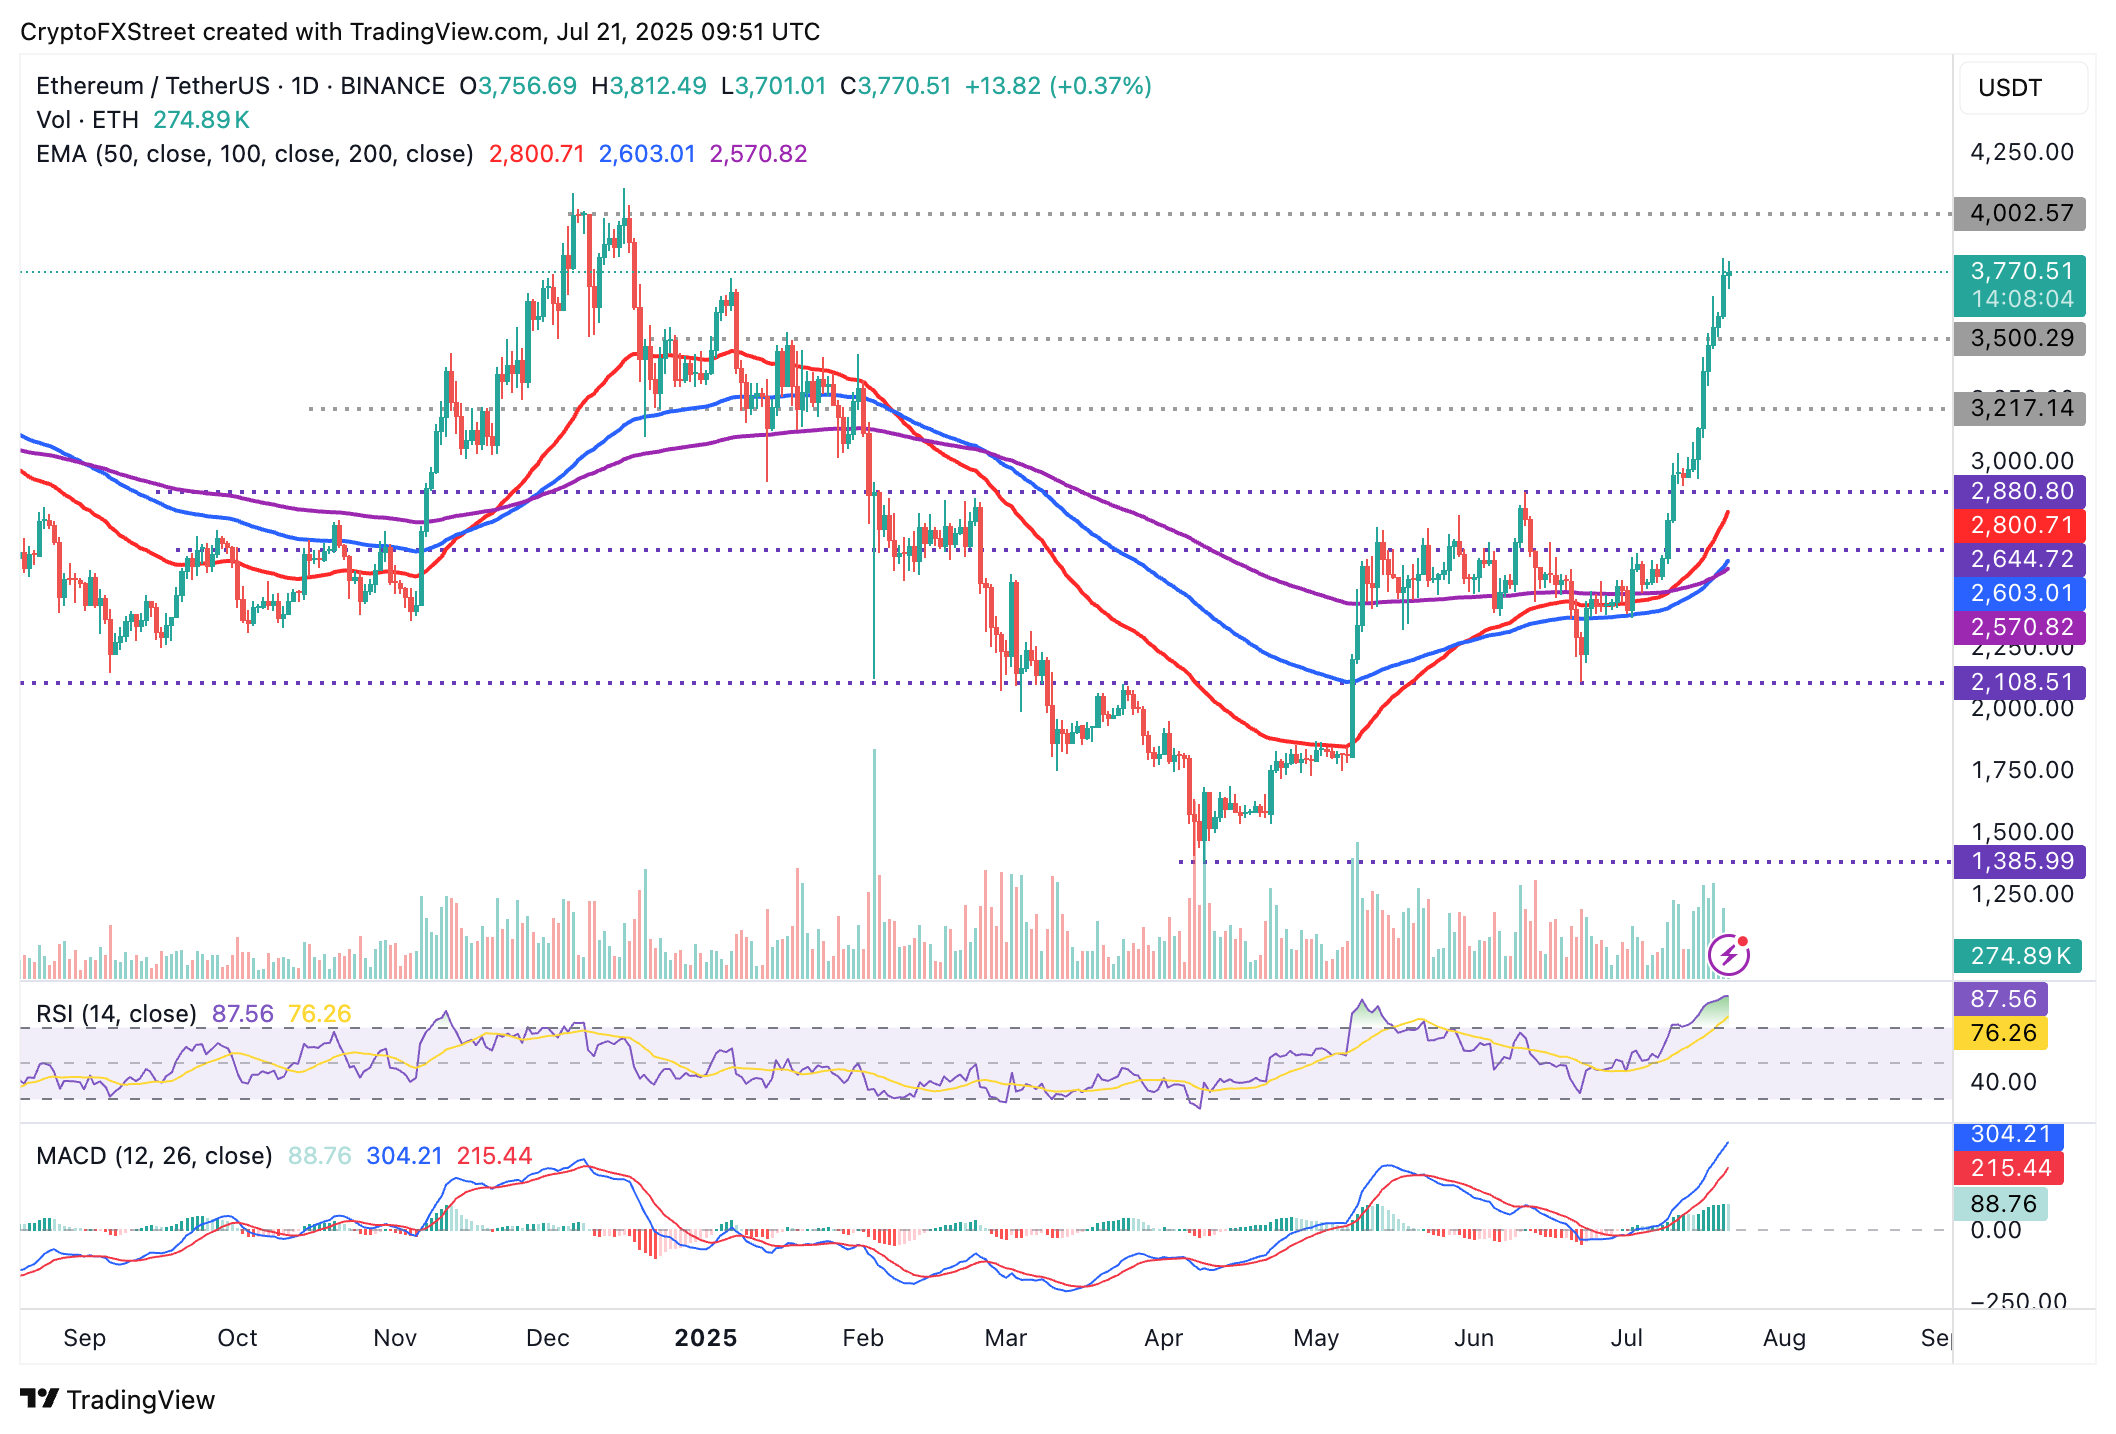
Ethereum price holds firmly to the gains accrued over the last nine days, trading at $3,770 at the time of writing on Monday. The largest smart contracts token flaunts a solid bullish structure, backed by two recently confirmed Golden Cross patterns.
Ethereum's first Golden Cross pattern was validated when the 50-day EMA crossed above the 200-day EMA on July 10, and the second when the 100-day EMA flipped above the 200-day EMA on Sunday.
ETH/USDT daily chart
A breakout above $4,000 seems likely in upcoming sessions. Still, traders must practice restraint considering the extremely overbought conditions on the Relative Strength Index (RSI) at 87. Higher RSI readings tend to be a precursor to sudden pullbacks; therefore, it is essential to look out for potential support levels, such as $3,500, which was tested in January as resistance, and $3,217, which was tested in December as support.
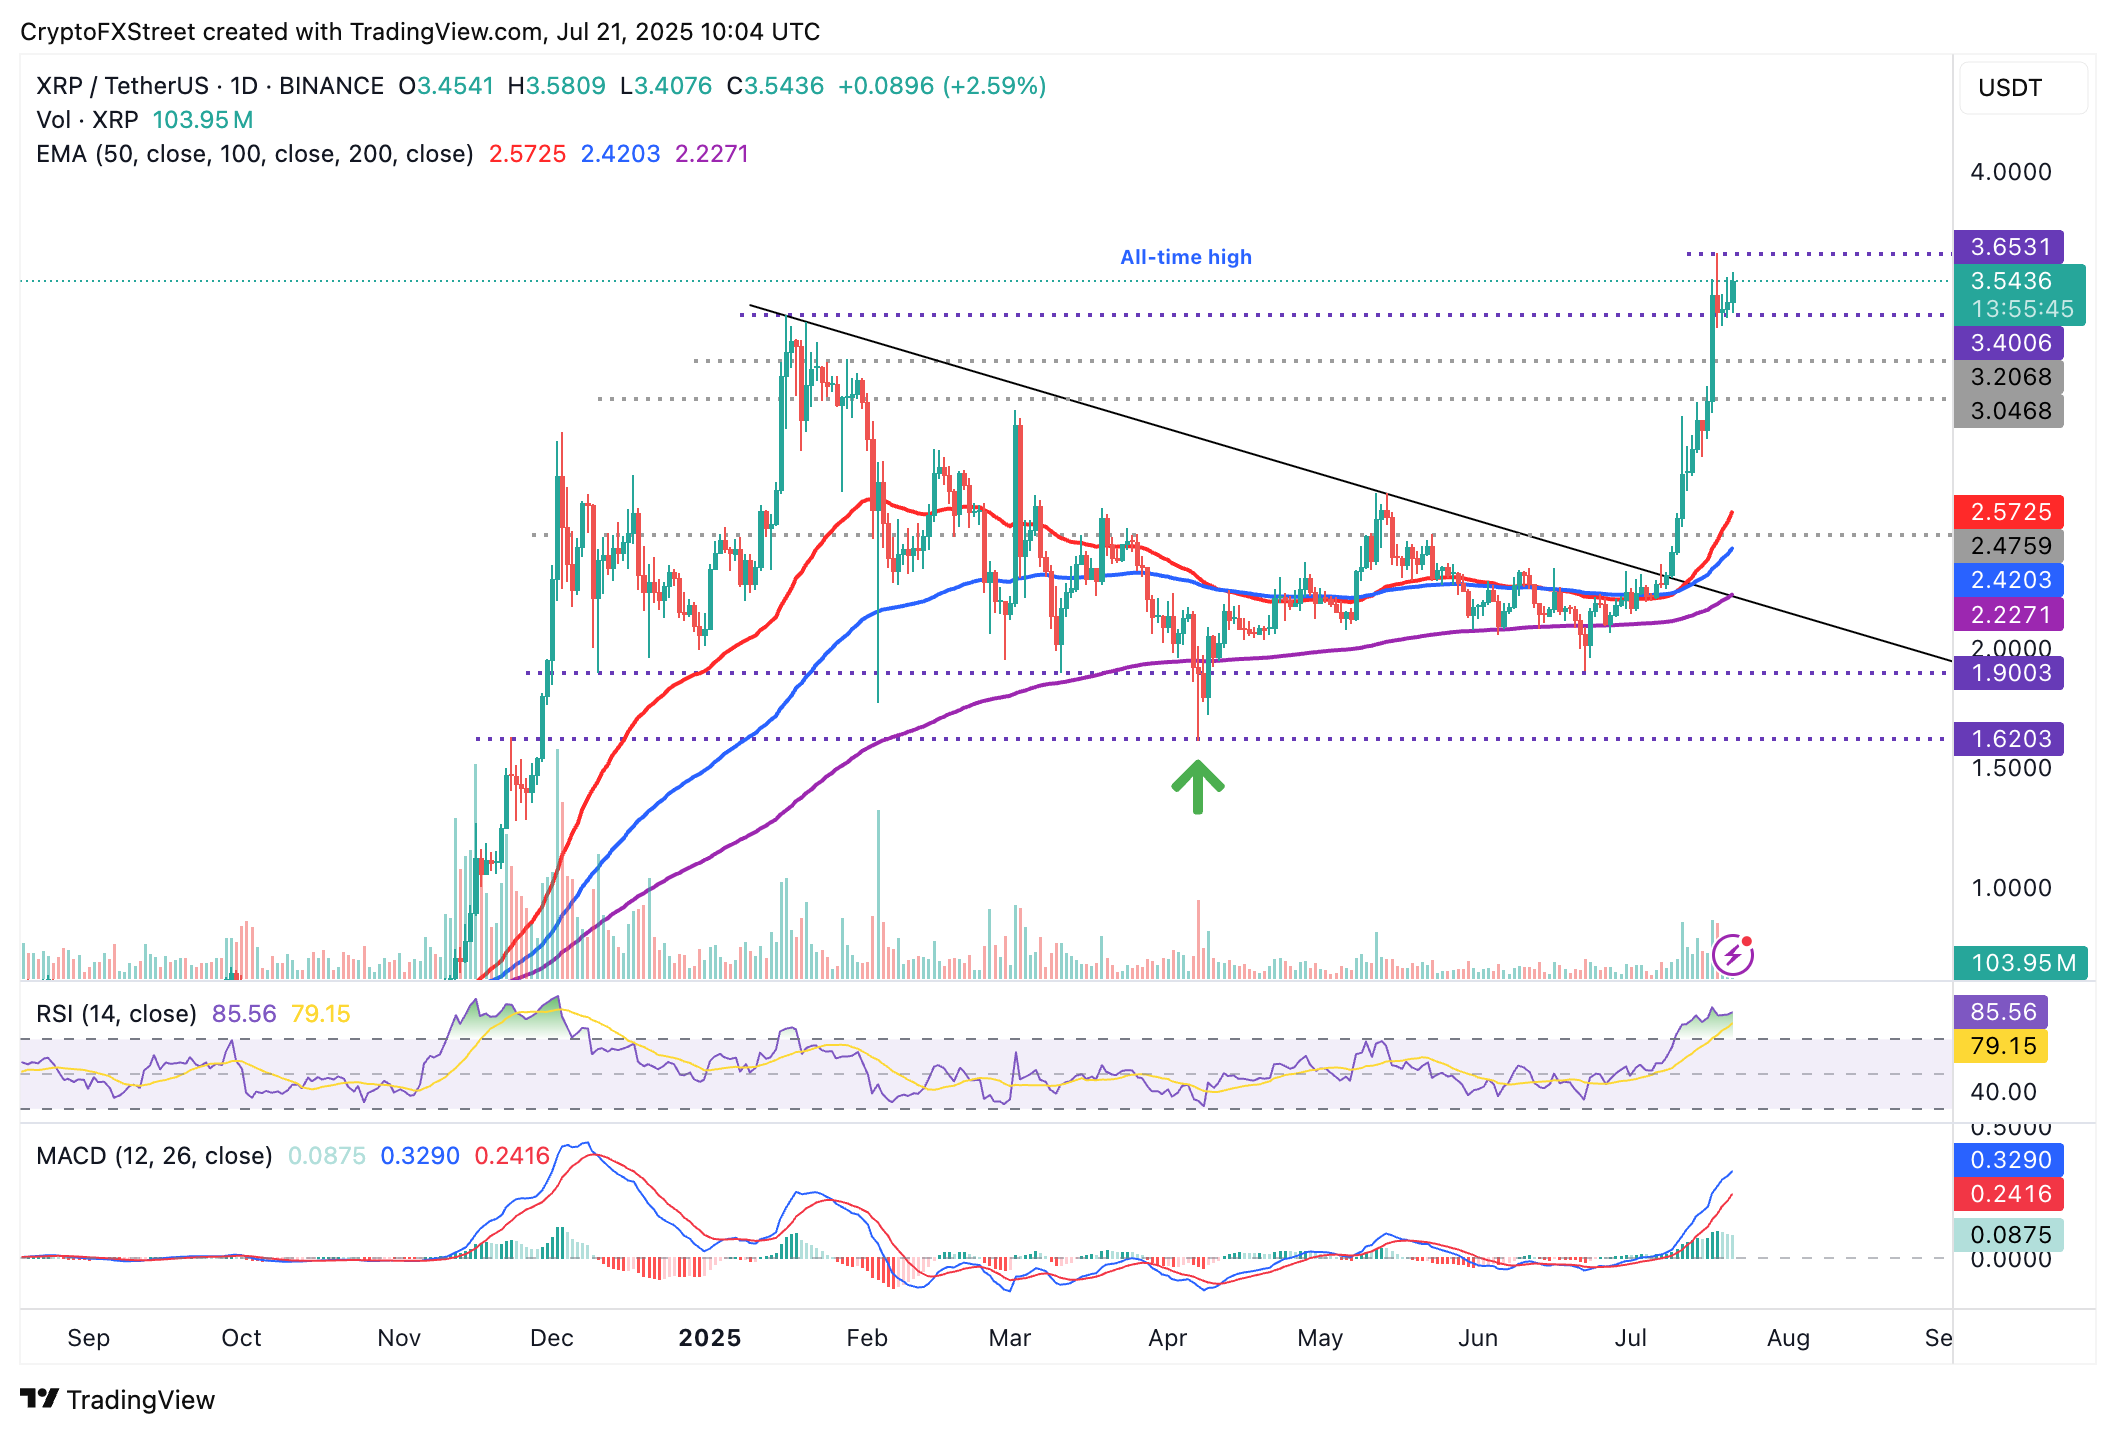
As for XRP, price at $3.54 holds very close to the record high of $3.66, underpinned by high trading volumes and a buy signal from the Moving Average Convergence Divergence (MACD) indicator.
The MACD has maintained a buy signal since June 28 when the blue line crossed above the red signal line. Note that the green histogram bars above the zero line signal bullish momentum.
XRP/USDT daily chart
A breakout into a new price discovery phase is anticipated to follow the uptrend above the record high. However, the extremely overbought RSI at 85 suggests that the market may be overheating, and a cautionary note is warranted before the next breakout attempt.
Cryptocurrency prices FAQs
Token launches influence demand and adoption among market participants. Listings on crypto exchanges deepen the liquidity for an asset and add new participants to an asset’s network. This is typically bullish for a digital asset.
A hack is an event in which an attacker captures a large volume of the asset from a DeFi bridge or hot wallet of an exchange or any other crypto platform via exploits, bugs or other methods. The exploiter then transfers these tokens out of the exchange platforms to ultimately sell or swap the assets for other cryptocurrencies or stablecoins. Such events often involve an en masse panic triggering a sell-off in the affected assets.
Macroeconomic events like the US Federal Reserve’s decision on interest rates influence crypto assets mainly through the direct impact they have on the US Dollar. An increase in interest rate typically negatively influences Bitcoin and altcoin prices, and vice versa. If the US Dollar index declines, risk assets and associated leverage for trading gets cheaper, in turn driving crypto prices higher.
Halvings are typically considered bullish events as they slash the block reward in half for miners, constricting the supply of the asset. At consistent demand if the supply reduces, the asset’s price climbs.
Recommended Articles


