
Pudgy Penguins surpasses $2 billion market capitalization, overtakes Official Trump and SPX6900
- Pudgy Penguins stabilizes on Wednesday after rallying over 121% in the last seven days.
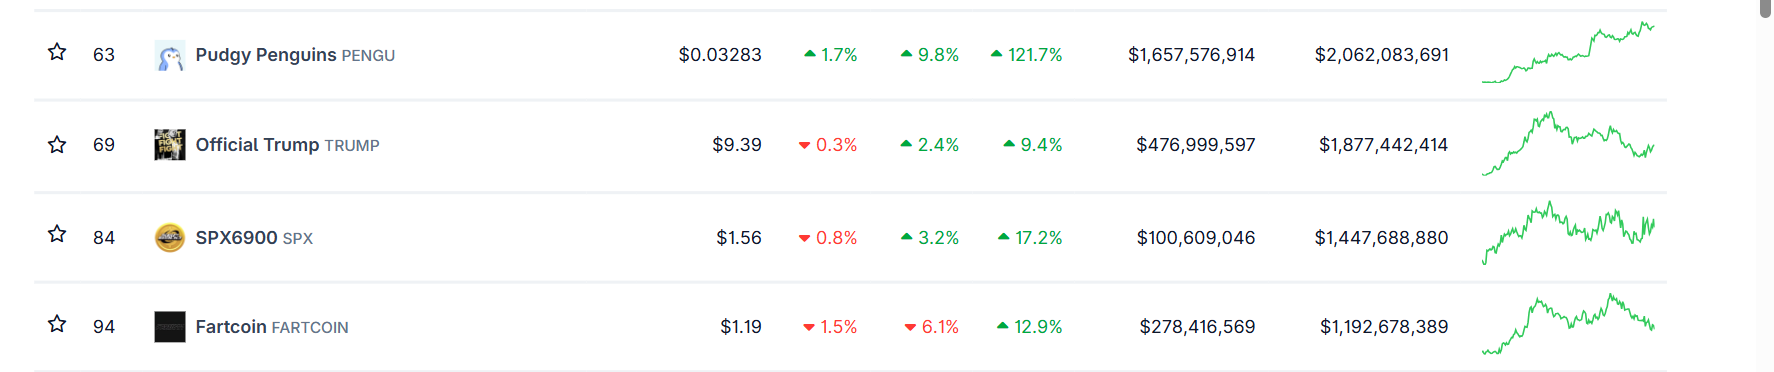
- PENGU's market capitalization surpasses $2 billion, overtaking popular meme coins such as TRUMP and SPX6900.
- Derivatives data show that PENGU's Open Interest reached a record level, suggesting growing investor interest.
Pudgy Penguins (PENGU) meme coin is stabilizing around $0.032 at the time of writing on Wednesday, after gaining over 121% in the last 7-day timeframe. This price rally pushed the penguin-themed meme coin's market capitalization above $2 billion, surpassing other popular meme coins, such as Official Trump (TRUMP) and SPX6900 (SPX). Additionally, the derivatives data show that Open Interest (OI) in PENGU has reached an all-time high, suggesting growing investor interest, which could push the meme coin higher.
PENGU market capitalization surpasses $2 billion, open interest hits record levels
Pudgy Penguins, which started as a Non-Fungible Token (NFT) project on Ethereum and later launched its Solana-based token PENGU, soared more than 121% in the last seven days. According to CoinGecko data, the penguin-based memecoin has rallied over 9% in the last 24 hours. This price rally pushed the penguin-themed meme coin's market capitalization above $2 billion, surpassing other popular meme coins, such as Official Trump (TRUMP) and SPX6900 (SPX).
Still, when examining its on-chain data, the outlook for PENGU appears bullish. Coinglass' data shows that the futures' OI in PENGU at exchanges rose from $280.94 million on Sunday to $463.63 million on Wednesday, a new all-time high since its launch. An increasing OI represents new or additional money entering the market and new buying, which could add fuel to the current rally in the Pudgy Penguins price.
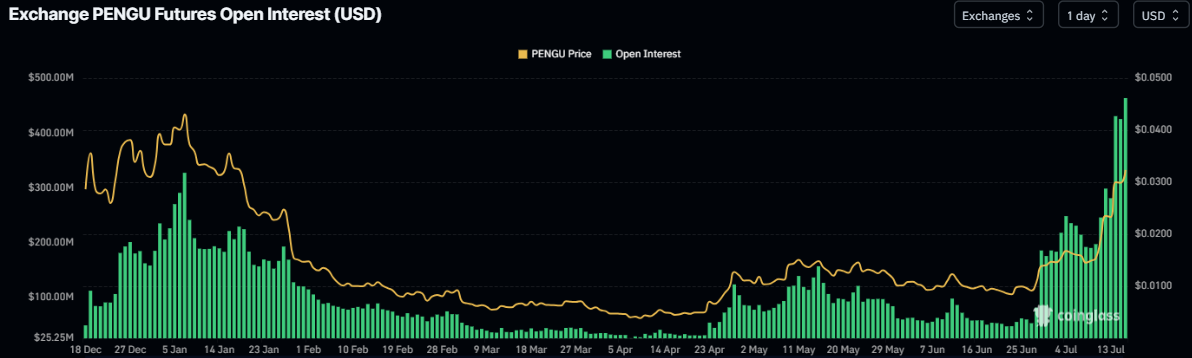
PENGU Open Interest chart. Source: CoinGlass
Pudgy Penguins bulls target $0.046 mark
Pudgy Penguins broke above the 50% Fibonacci level at $0.025 (drawn from the January high of $0.046 to the April low of $0.003) on Sunday. It continued its rally, closing above the next resistance level of $0.030, the 61.8% Fibonacci retracement, on Tuesday. At the time of writing on Wednesday, it stabilizes at around $0.032.
If the 61.8% Fibonacci level at $0.030 holds as support, the PENGU price could extend the rally to retest its January 6 high at $0.469.
The Relative Strength Index (RSI) indicator reads 87 on the daily chart, above its overbought level of 70, indicating strong bullish momentum. However, traders should be cautious as the chances of a pullback are high due to the meme coin's overbought condition.
The Moving Average Convergence Divergence (MACD) indicator on the daily chart displayed a bullish crossover at the end of June, signalling a buy opportunity. It also shows rising green histogram bars above its neutral zero line, suggesting bullish momentum is gaining traction and continuing an upward trend.
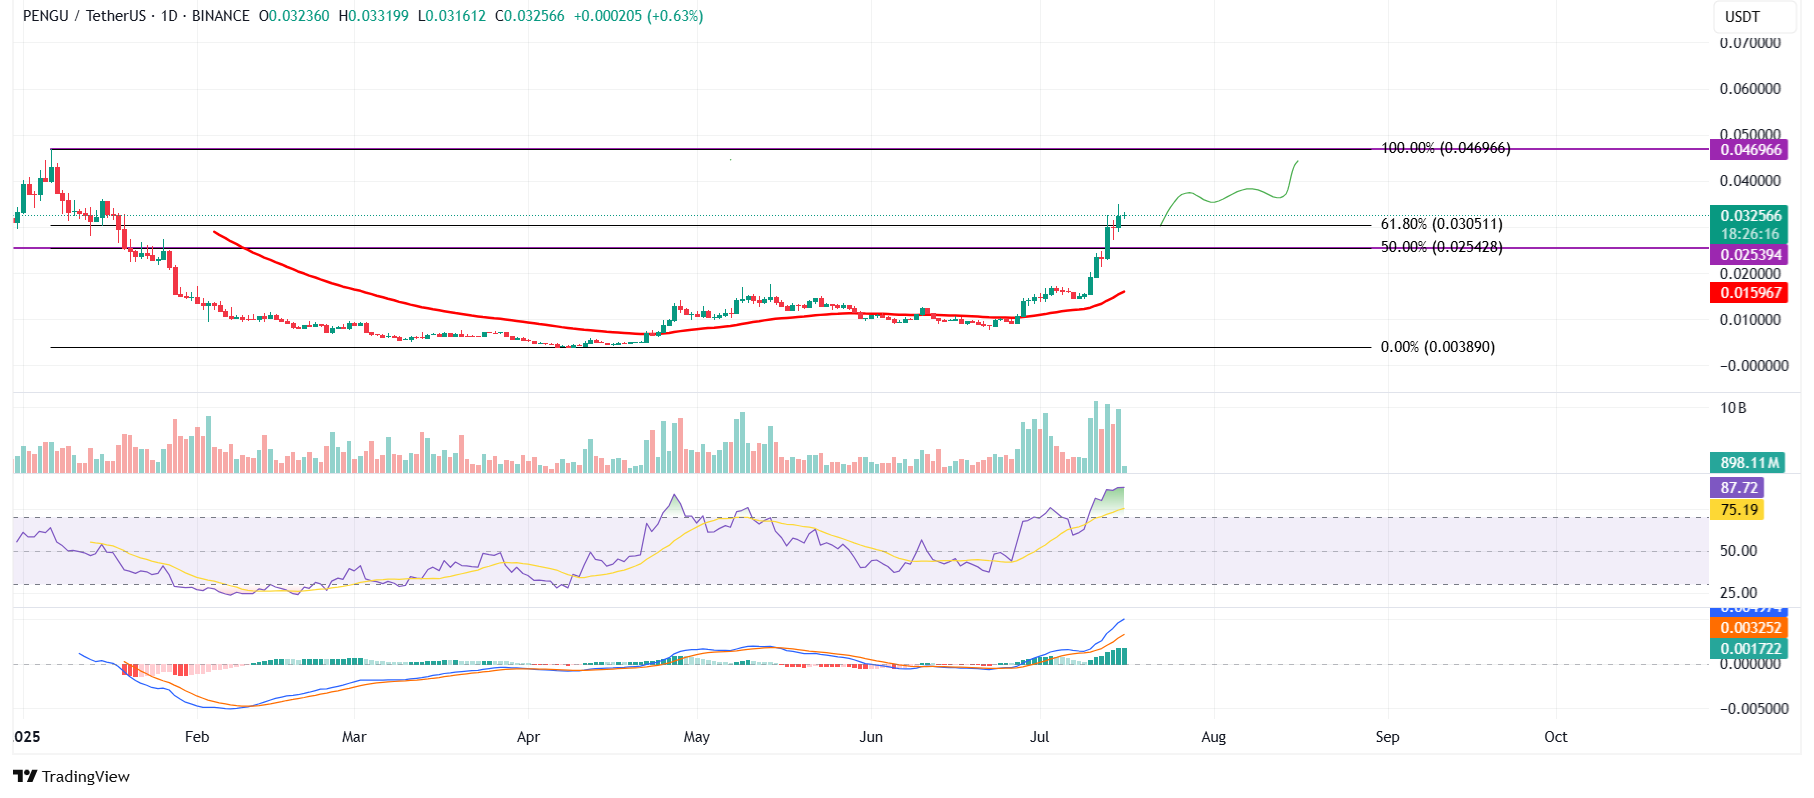
PENGU/USDT daily chart
However, if PENGU faces a correction and closes below the 61.8% Fibonacci level at $0.030 on a daily basis, it could extend the decline to find support around the 50% Fibonacci retracement at $0.025.
Recommended Articles


