

Arbitrum price readies to explode 12% if Ethereum nicks $4,000
- Arbitrum price is standing nearly 50% from its yearly lows, poised to extend north on Ethereum price’s cue.
- ARB could soar 12% to clear the January 11 peak of $2.4250, with eyes peeled on $2.6000.
- A break and close below $1.7307 would produce a lower low, invalidating the bullish thesis in the process.
Arbitrum (ARB) price s trading with a bullish bias, but continues to consolidate within a range. The upside potential for the Ethereum Layer 2 (L2) token could be reinvigorated once ETH price nicks the $4,000 psychological level, with ARB likely to benefit from the ensuing liquidity overflows into ETH betas.
Also Read: Is it time for ETH beta rotation as Ethereum Dencun Upgrade and Ether ETF narratives catch steam?
Arbitrum price eyes 12% explosion
Arbitrum (ARB) price is confronting immediate resistance due to the $2.2017 blockade, which markets to top of a market range from $1.7307. With strong support downward due to the 50-day Simple Moving Average (SMA) at $1.8989, ARB price could shatter the $2.2017 roadblock, clearing the path for an extension north.
A flip of the $2.2017 resistance level into support would set the tone for Arbitrum price to extend to the $2.4250 peak, levels last tested on January 11. Such a move would constitute a 12% climb above current levels.
In a highly bullish case, Arbitrum price could clear this range high to set another local top at the $2.6000 psychological level.
Notice the ascending Relative Strength Index (RSI), which is evidence of rising momentum. The volume indicators are also bullish, to show a strengthening trend. These add credence to the bullish thesis.
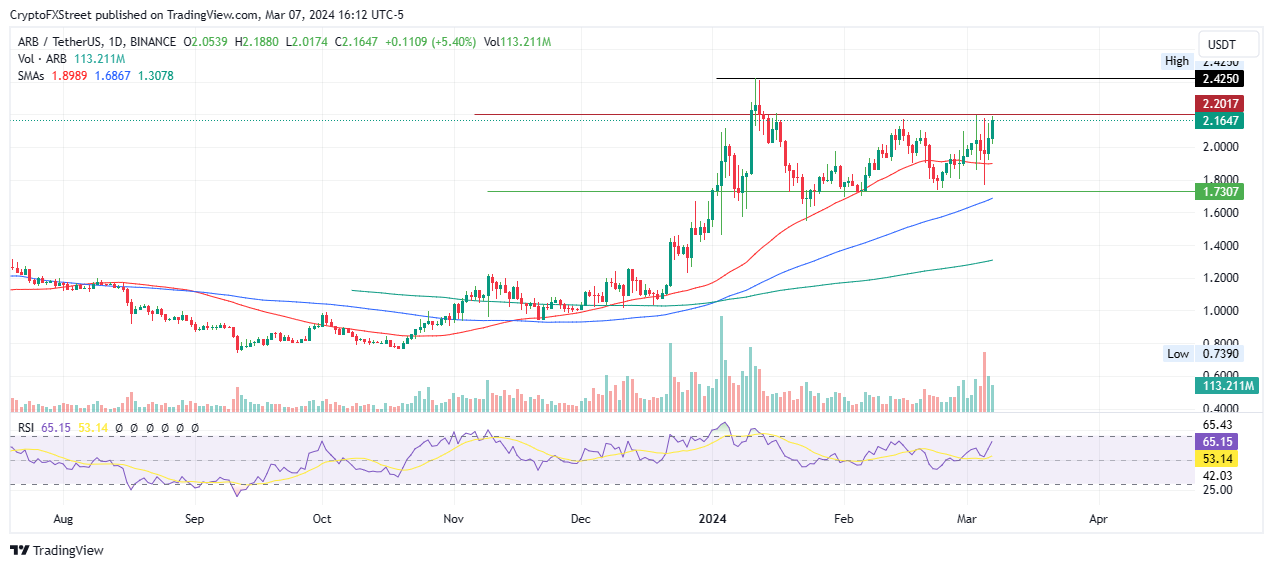
ARB/USDT 1-day chart
On-chain metrics supporting Arbitrum price bullish thesis
To start with, the social dominance and social volume metrics are dropping, which is bullish because it means the ARB project is not overhyped. When there is too much hype around a project, the price tends to go the other way.
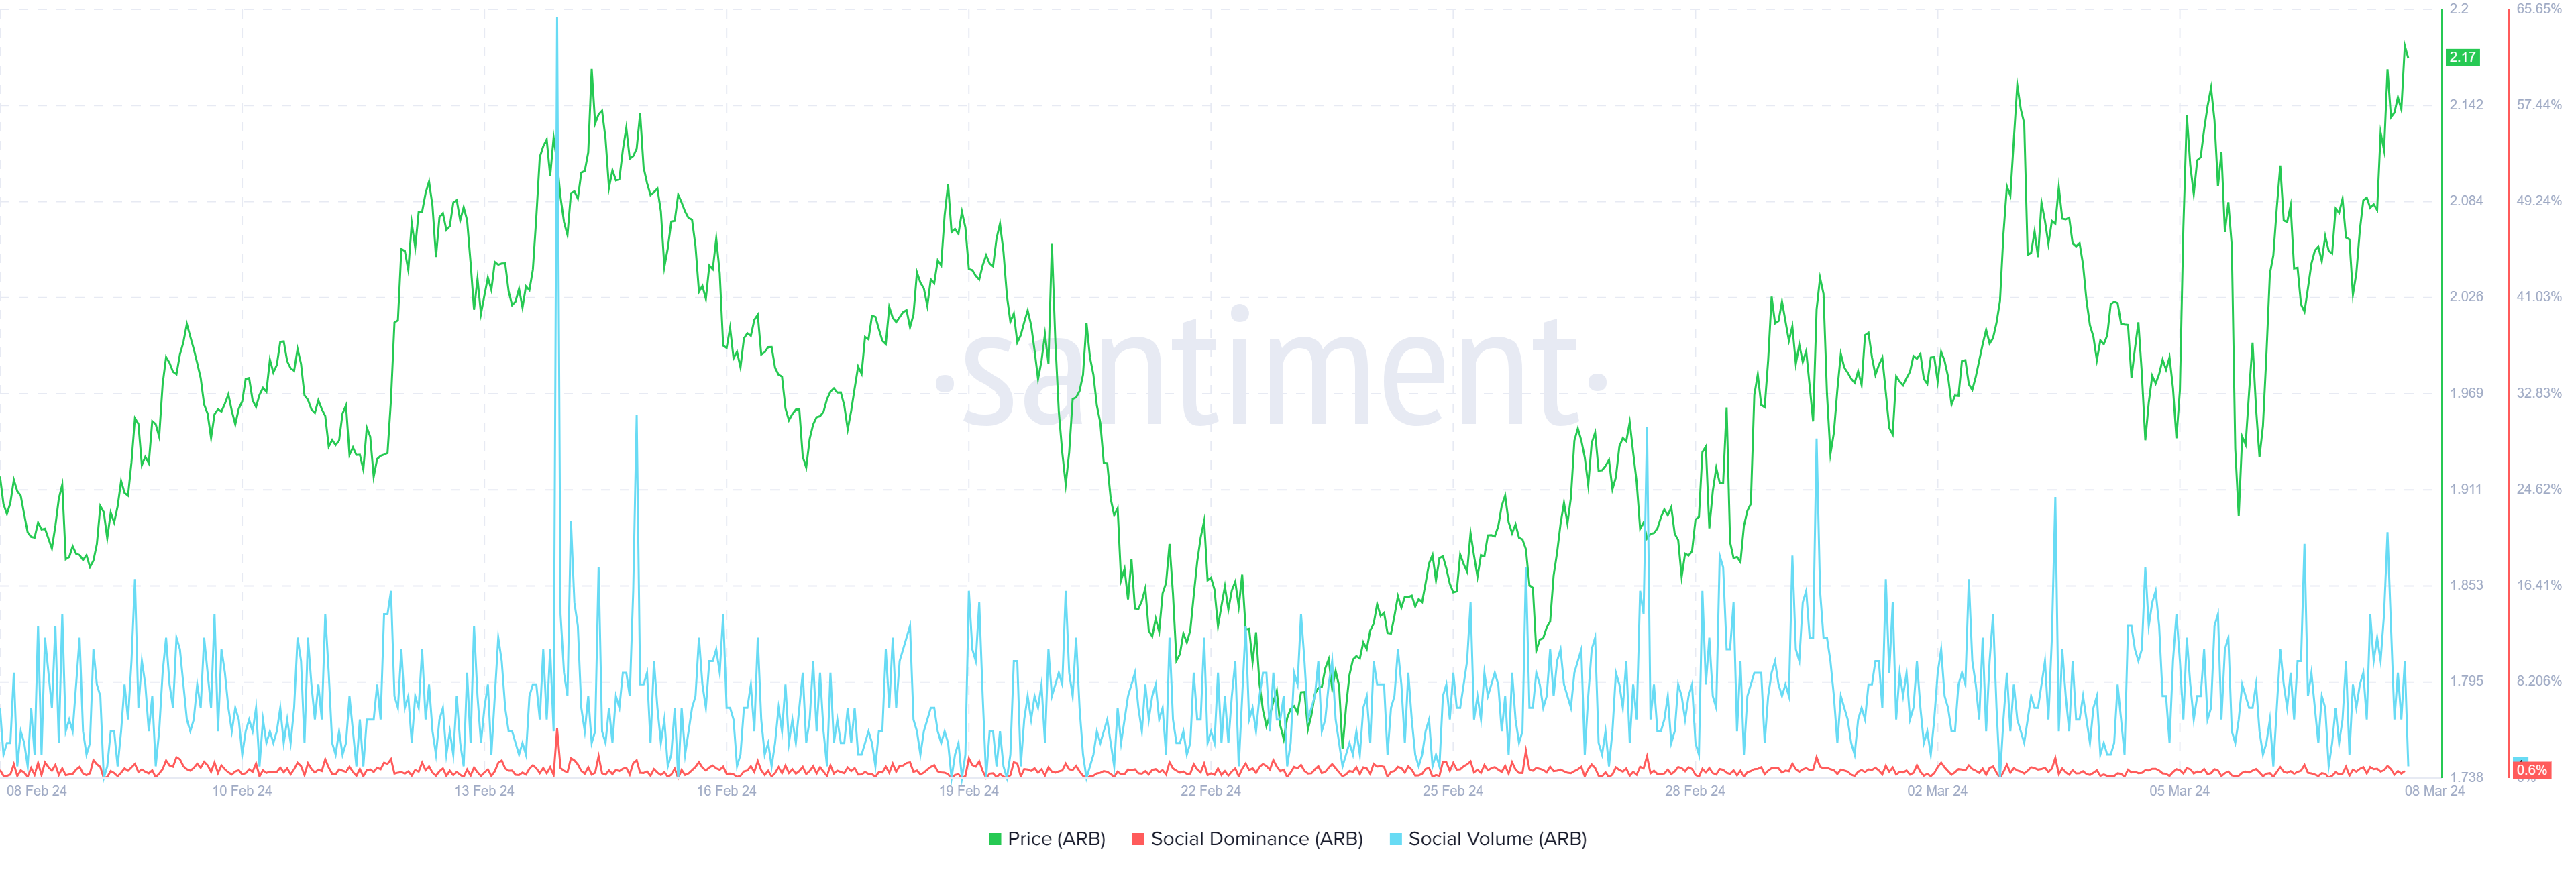
ARB Santiment: social dominance, social volume
Also, the number of daily active addresses created for ARB, effectively pointing to crowd interaction, has increased, as has the development activity on the network. With more addresses being involved in ARB, coupled with network related progresses, this metric is a bullish catalyst for the L2 token.
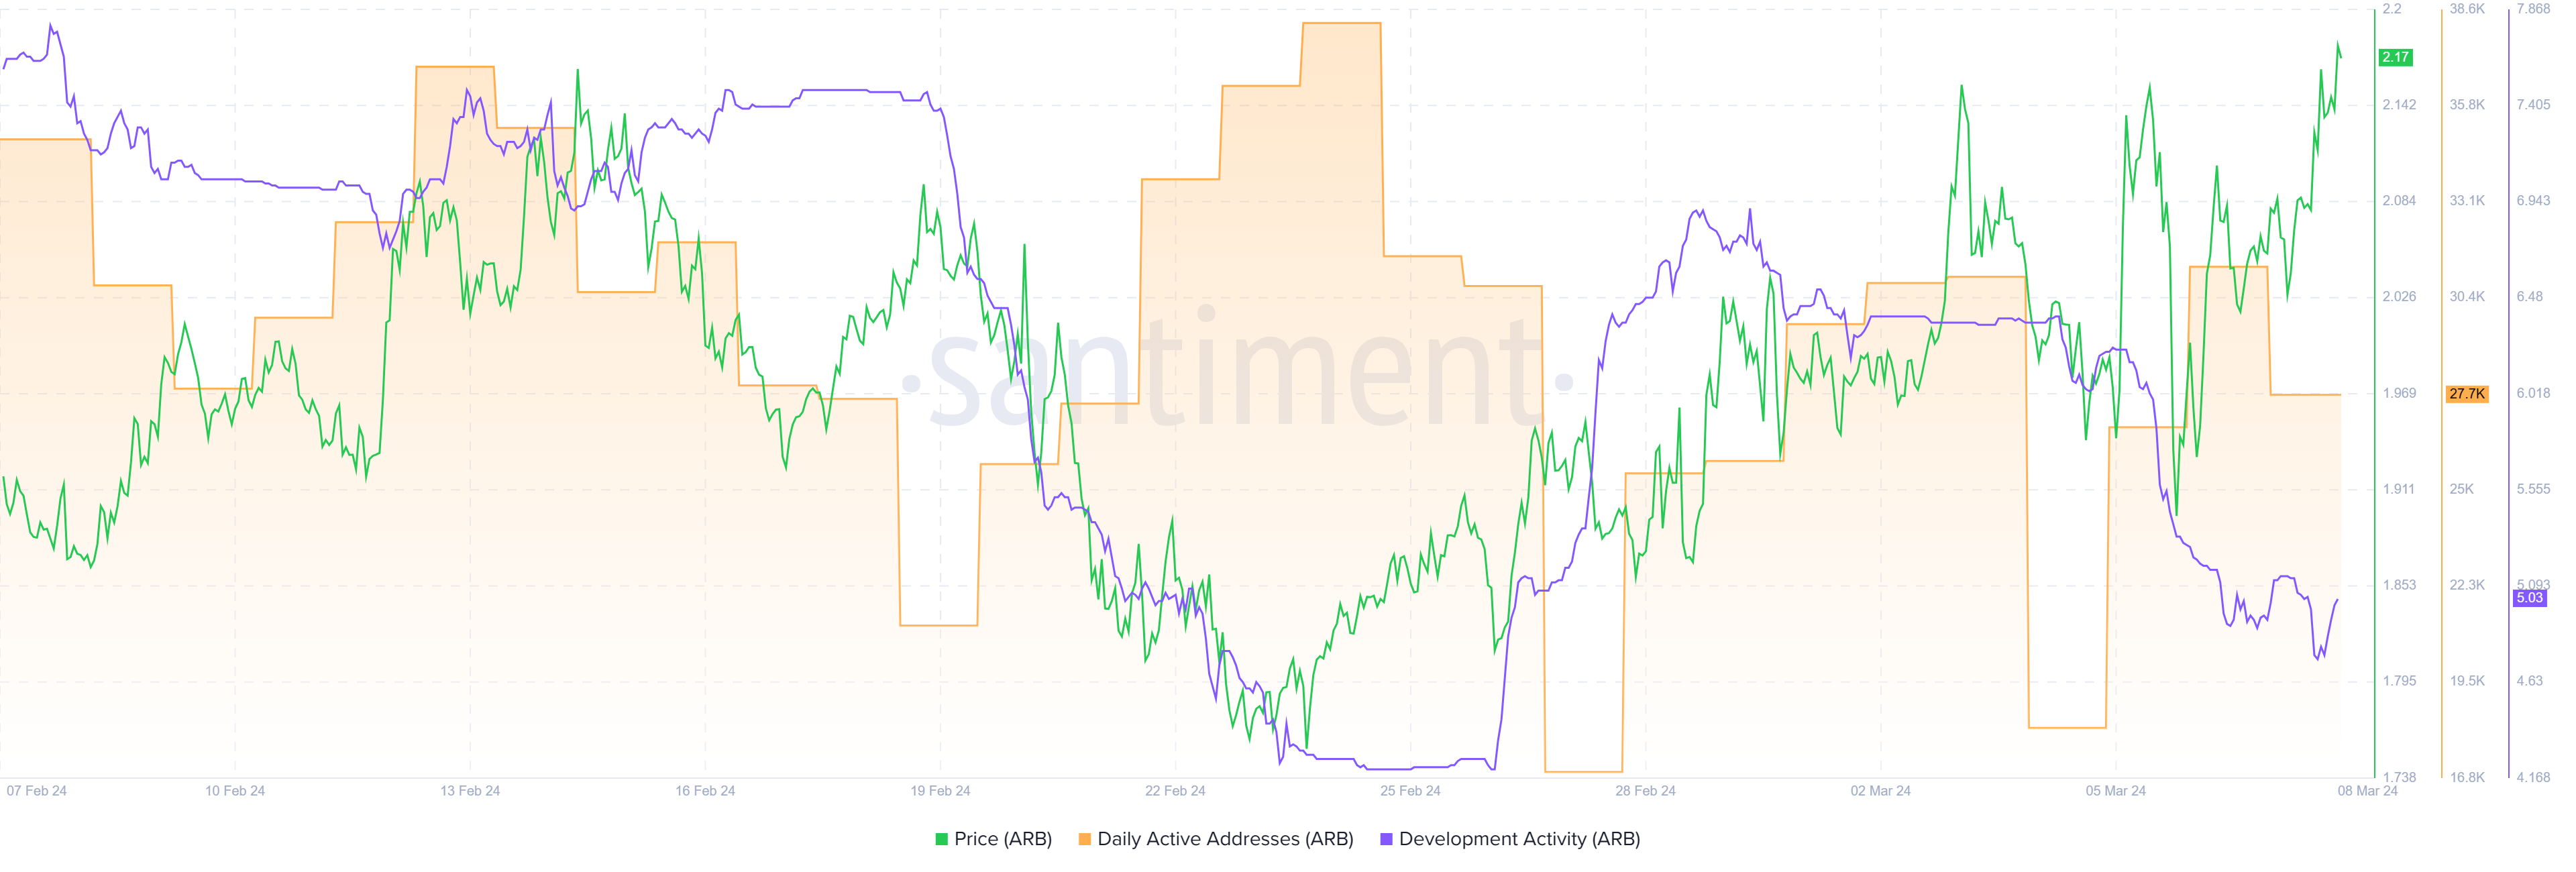
ARB Santiment: Daily active addresses, development activity
The whale transaction count metric for transactions exceeding $100,000 has also shown significant spikes over the last few months. This coupled with the growth in volume is a bullish fundamental.
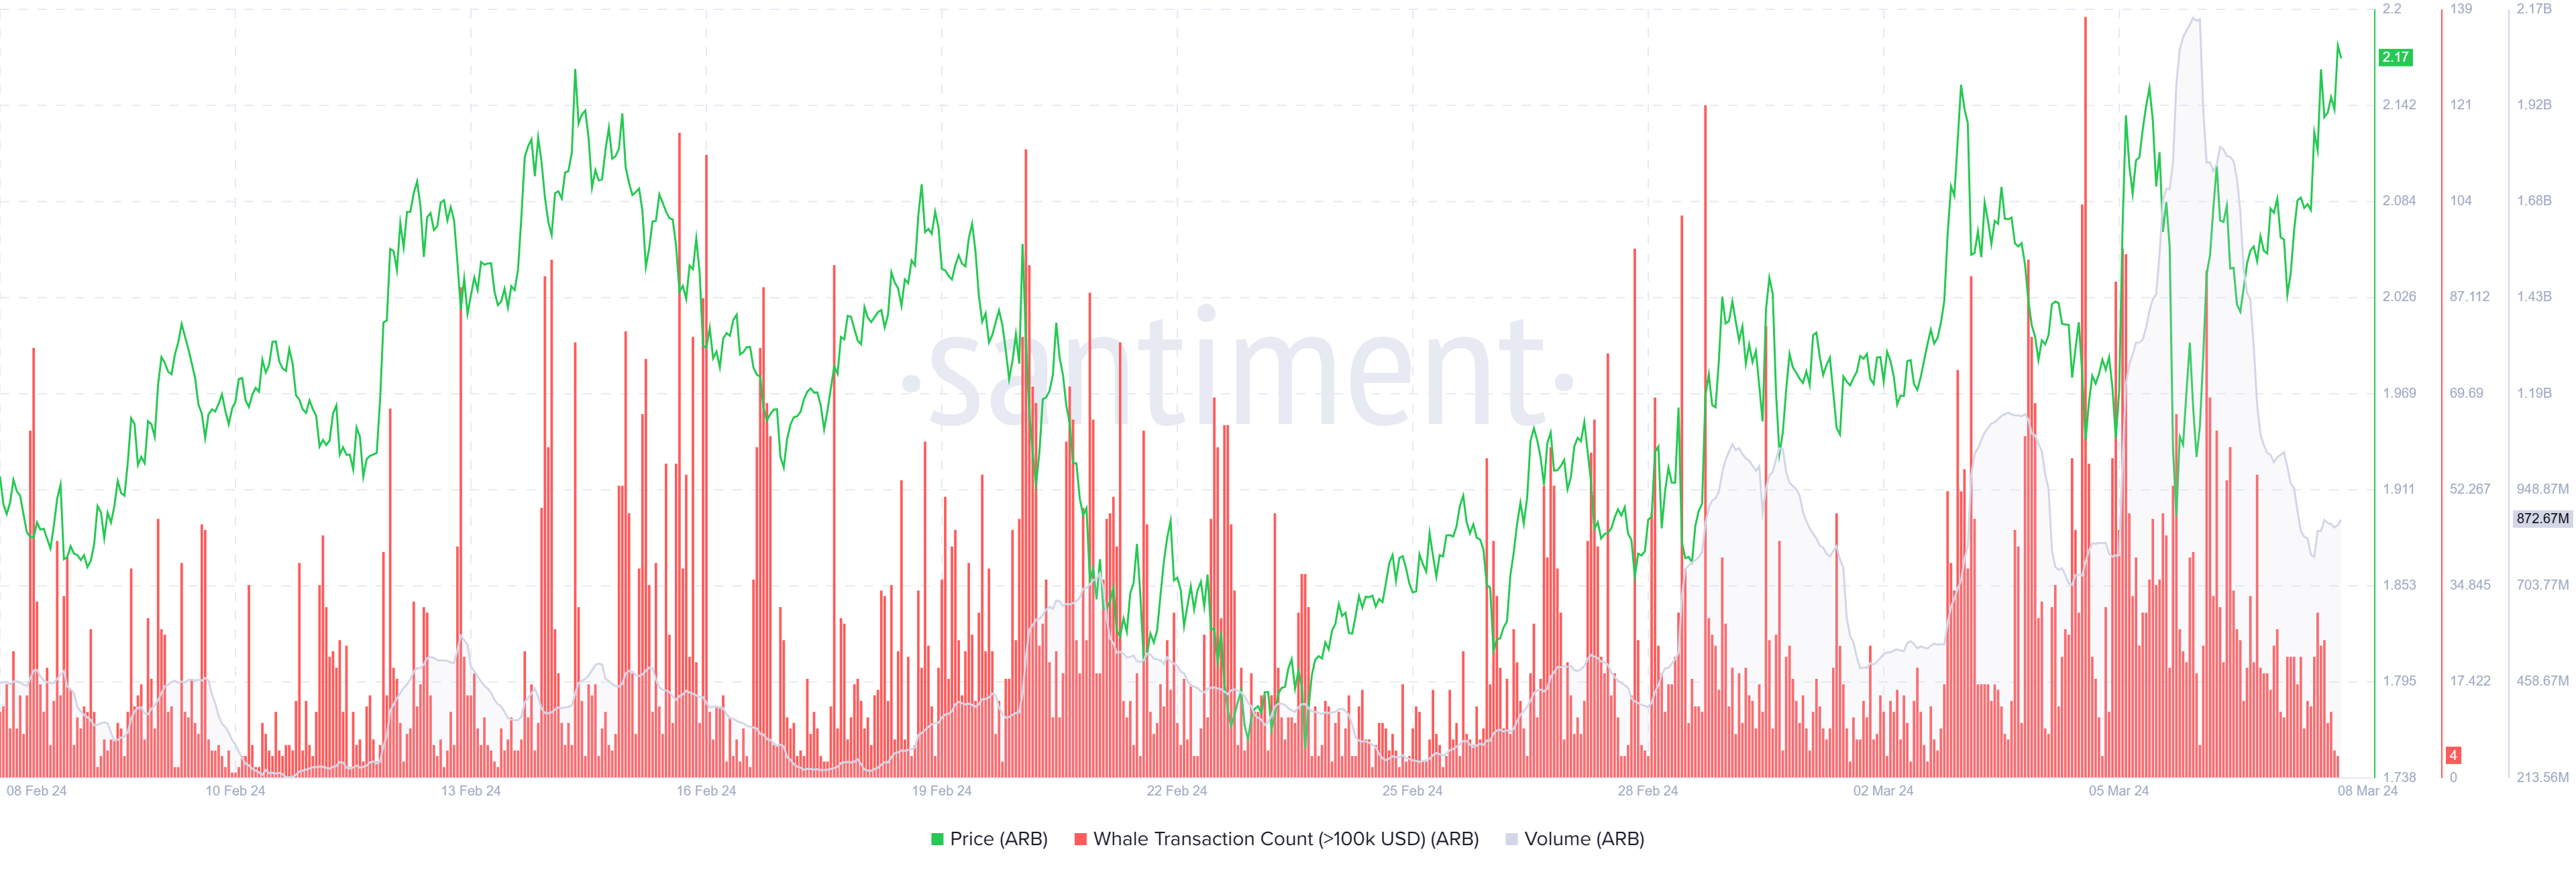
ARB Santiment: Whale transaction count, volume
On the flip side, if traders begin to cash out on the gains made so far, the Arbitrum price could descend, first losing the support due to the 50-day SMA at $1.8989. An extended fall could send ARB price to the $1.7307 support, below which the ARB price would create a lower low under the 200-day SMA at $1.6867. This would invalidate the bullish thesis.
Recommended Articles


