
Crypto Today: BTC, ETH spot ETFs continue to post inflows ahead of FOMC minutes
- Bitcoin and Ethereum spot ETFs record $385 million and $38 million, respectively, as institutions extend the accumulation phase.
- Sentiment in crypto markets remains in "greed" levels, with 90% of Bitcoin holders in profit.
- Bitcoin price uptrend falters under $110,000 as markets await the Fed minutes to shed light on the direction of US monetary policy.
- Ethereum eyes a breakout from a rectangle pattern that could lead to a 14% price increase.
The cryptocurrency market is moving broadly sideways, with Bitcoin's (BTC) recovery weakening under $110,000 ahead of the release of the Federal Reserve (Fed) meeting minutes on Wednesday. Despite moving within a rectangle pattern, Ethereum's (ETH) price exhibits immense potential for extended gains above the $3,000 mark, supported by a strong risk-on sentiment from institutional investors.
Market overview: Fed minutes could trigger volatility
The Federal Open Market Committee (FOMC) May meeting minutes are expected to be in the spotlight for global markets, including crypto, later on Wednesday. Investors and analysts would seek insights into the committee's position on monetary policy and attempt to discern potential signals regarding future interest rate decisions.
Following the decision earlier this month to leave interest rates unchanged, Fed Chairman Jerome Powell highlighted that United States President Donald Trump's trade war could have a lasting impact on the country's inflation.
The FOMC minutes will likely echo the same message; however, markets may temper a hawkish stance in favor of sentiment surrounding the delay in tariff implementation.
Data spotlight: Institutional investors extend accumulation phase
Spot Bitcoin Exchange Traded Funds (ETFs) marked the ninth consecutive day of net inflows, with approximately $385 million streaming into the products on Tuesday. BlackRock's IBIT ETF posted the largest daily net inflow of $409 million, followed by Grayscale Bitcoin Mini Trust's BTC with $36 million, while VanECK's HODL came third with $7.77 million. Bitwise's BITB was the only other product in the green with $1.79 million in net inflows. The rest of the ETFs, including Fidelity's FBTC, Grayscale's GBTC, and Ark & 21Shares' ARKB, recorded net outflows of $4.8 million, $27 million, and $38 million, respectively.
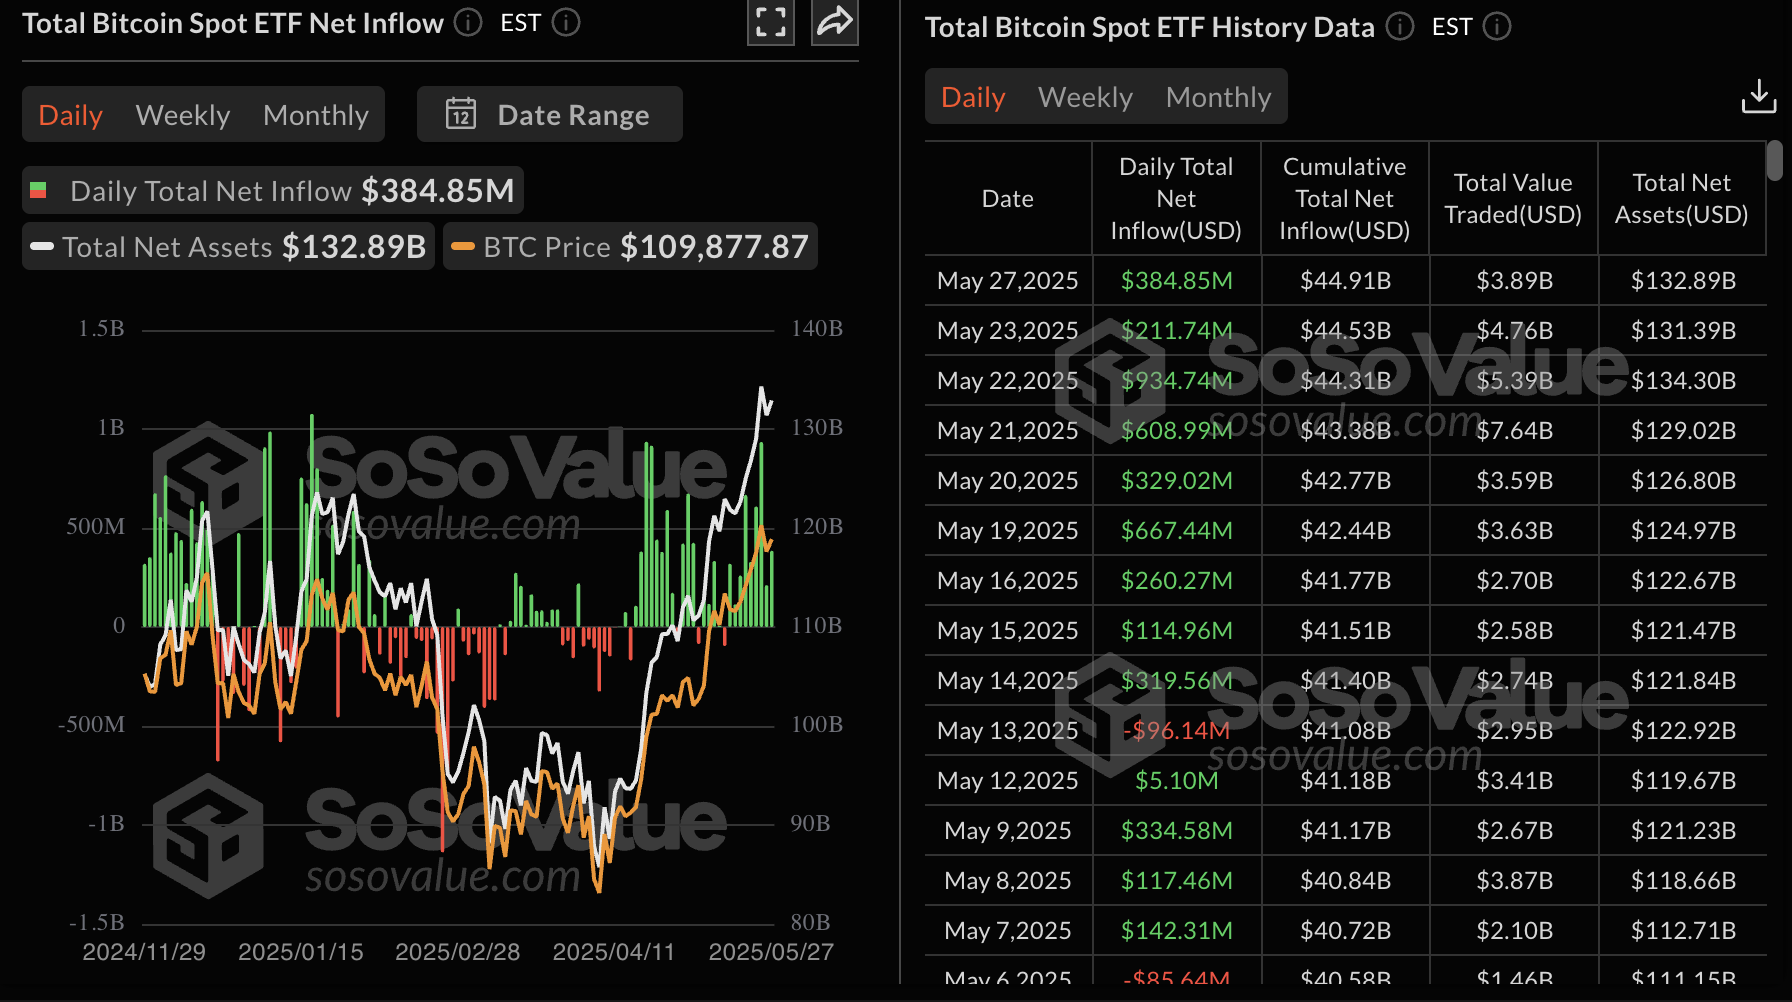
Bitcoin spot ETF inflows | Source SoSoValue
Spot Ethereum ETF inflows totaled $38.77 million on Tuesday, marking seven consecutive days of inflows. BlackRock's ETHA accounted for the largest share, at $32.5 million, followed by Fidelity's FETH and VanEck's ETHV, with $3.35 million and $2.95 million, respectively.
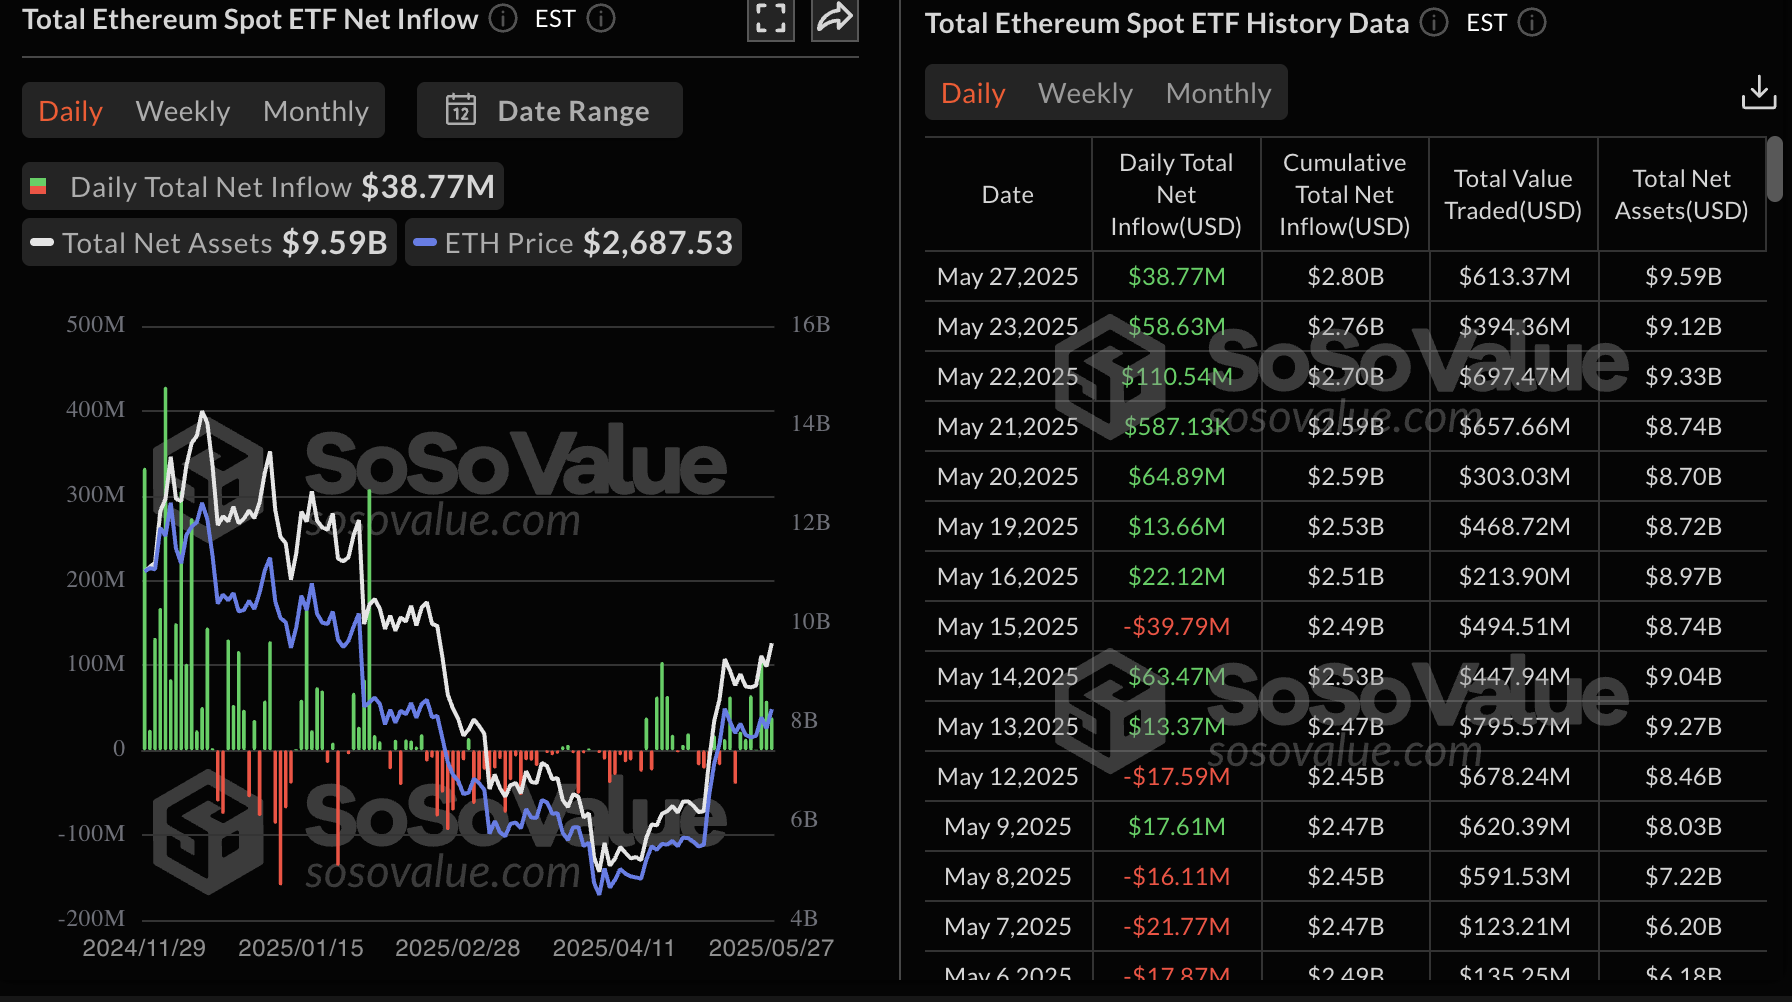
Ethereum spot ETF inflows | Source SoSoValue
Meanwhile, a recent filing with the Securities and Exchange Commission (SEC) shows that the BlackRock Strategic Income Opportunities Portfolio held approximately 2,123,592 shares of the iShares Bitcoin Trust (IBIT) as of March 31, valued at approximately $99.4 million, up from 1,691,143 shares as of December 31. The fund, which is actively managed as a bond portfolio, invests primarily in diversified fixed-income securities.
Trump Media & Technology Group announced on Tuesday a Bitcoin treasury worth $2.5 billion following up to 50 agreements with institutional investors to issue and sell its common stock and convertible senior secured notes for approximately $1.5 billion and $1 billion, respectively. The company said that the decision to invest in Bitcoin marks a major milestone in its America First principles.
Sentiment in the broader cryptocurrency market remains in "greed" levels based on the Alternative.me's Fear & Greed Index, which currently reads 71 compared to a 54 "neutral" last month.
The Fear & Greed Index suggests that behavior shapes market trends. Investors tend to be greedy when prices are climbing, depicting the fear of missing out (FOMO). Conversely, investors tend to sell irrationally when prices are tumbling, implying a state of "fear." The platform suggests that investors should consider selling during periods of "extreme greed" and buy when the market is experiencing "extreme fear."
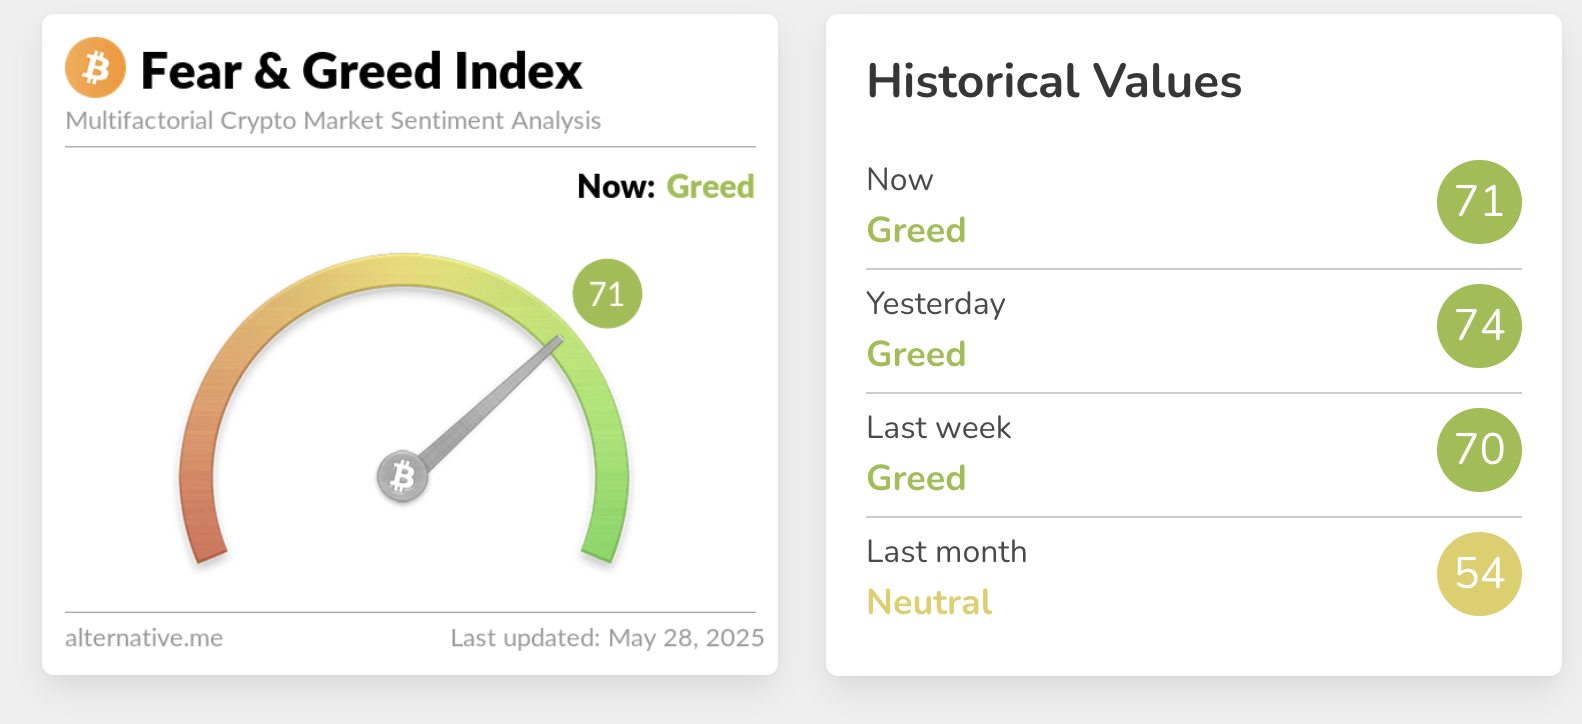
Fear & Greed Index | Source: Alternative.me
According to IntoTheBlock's In/Out of the Money Around Price (IOMAP) model, over 90% of Bitcoin holders are in profit, leaving only 9.53% with unrealised losses. Most of the liquidity lies below the current market price, as illustrated by the green circles. This implies that Bitcoin has a higher probability of extending the uptrend than correcting sharply.
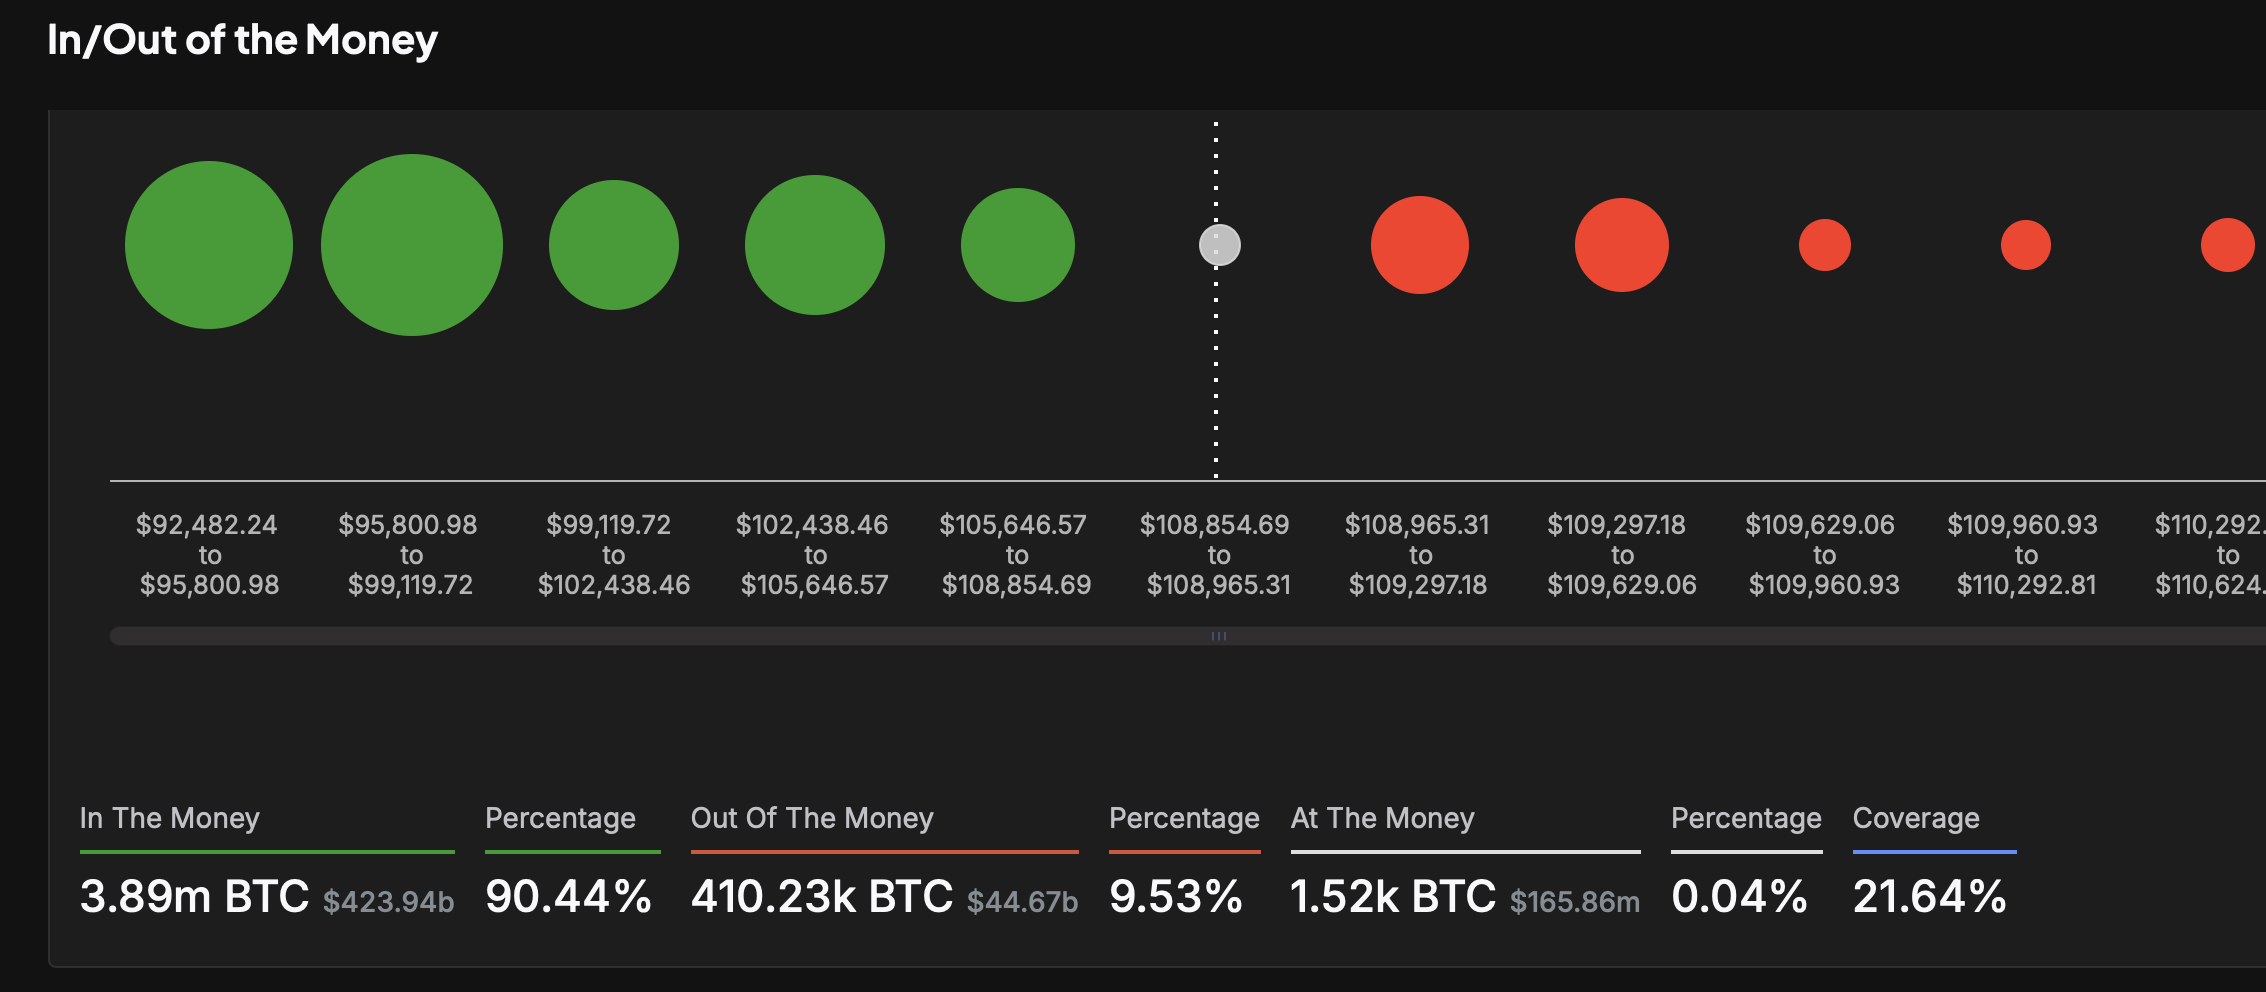
Bitcoin IOMAP model | Source: IntoTheBlock
Chart of the day: Bitcoin consolidates under $110,000 resistance
The largest cryptocurrency by market capitalization hovers at around $108,820 at the time of writing on Wednesday, sitting on top of the 50-period Exponential Moving Average (EMA) in the 4-hour chart at $108,235.
The chart below shows that despite BTC holding above key support areas, including the 100-period EMA at $106,109 and the 200-period EMA at $101,927, prevailing downside risks cannot be ignored.
For instance, the sell signal confirmed by the Moving Average Convergence Divergence (MACD) indicator on Tuesday could encourage traders to reduce their exposure to BTC, thereby increasing overhead pressure. The expanding red histogram bars below the mean linepoint to potential bearish momentum.
Furthermore, the Relative Strength Index (RSI) is in a downward trend, currently below the 50 midline, indicating a potentially bearish momentum.
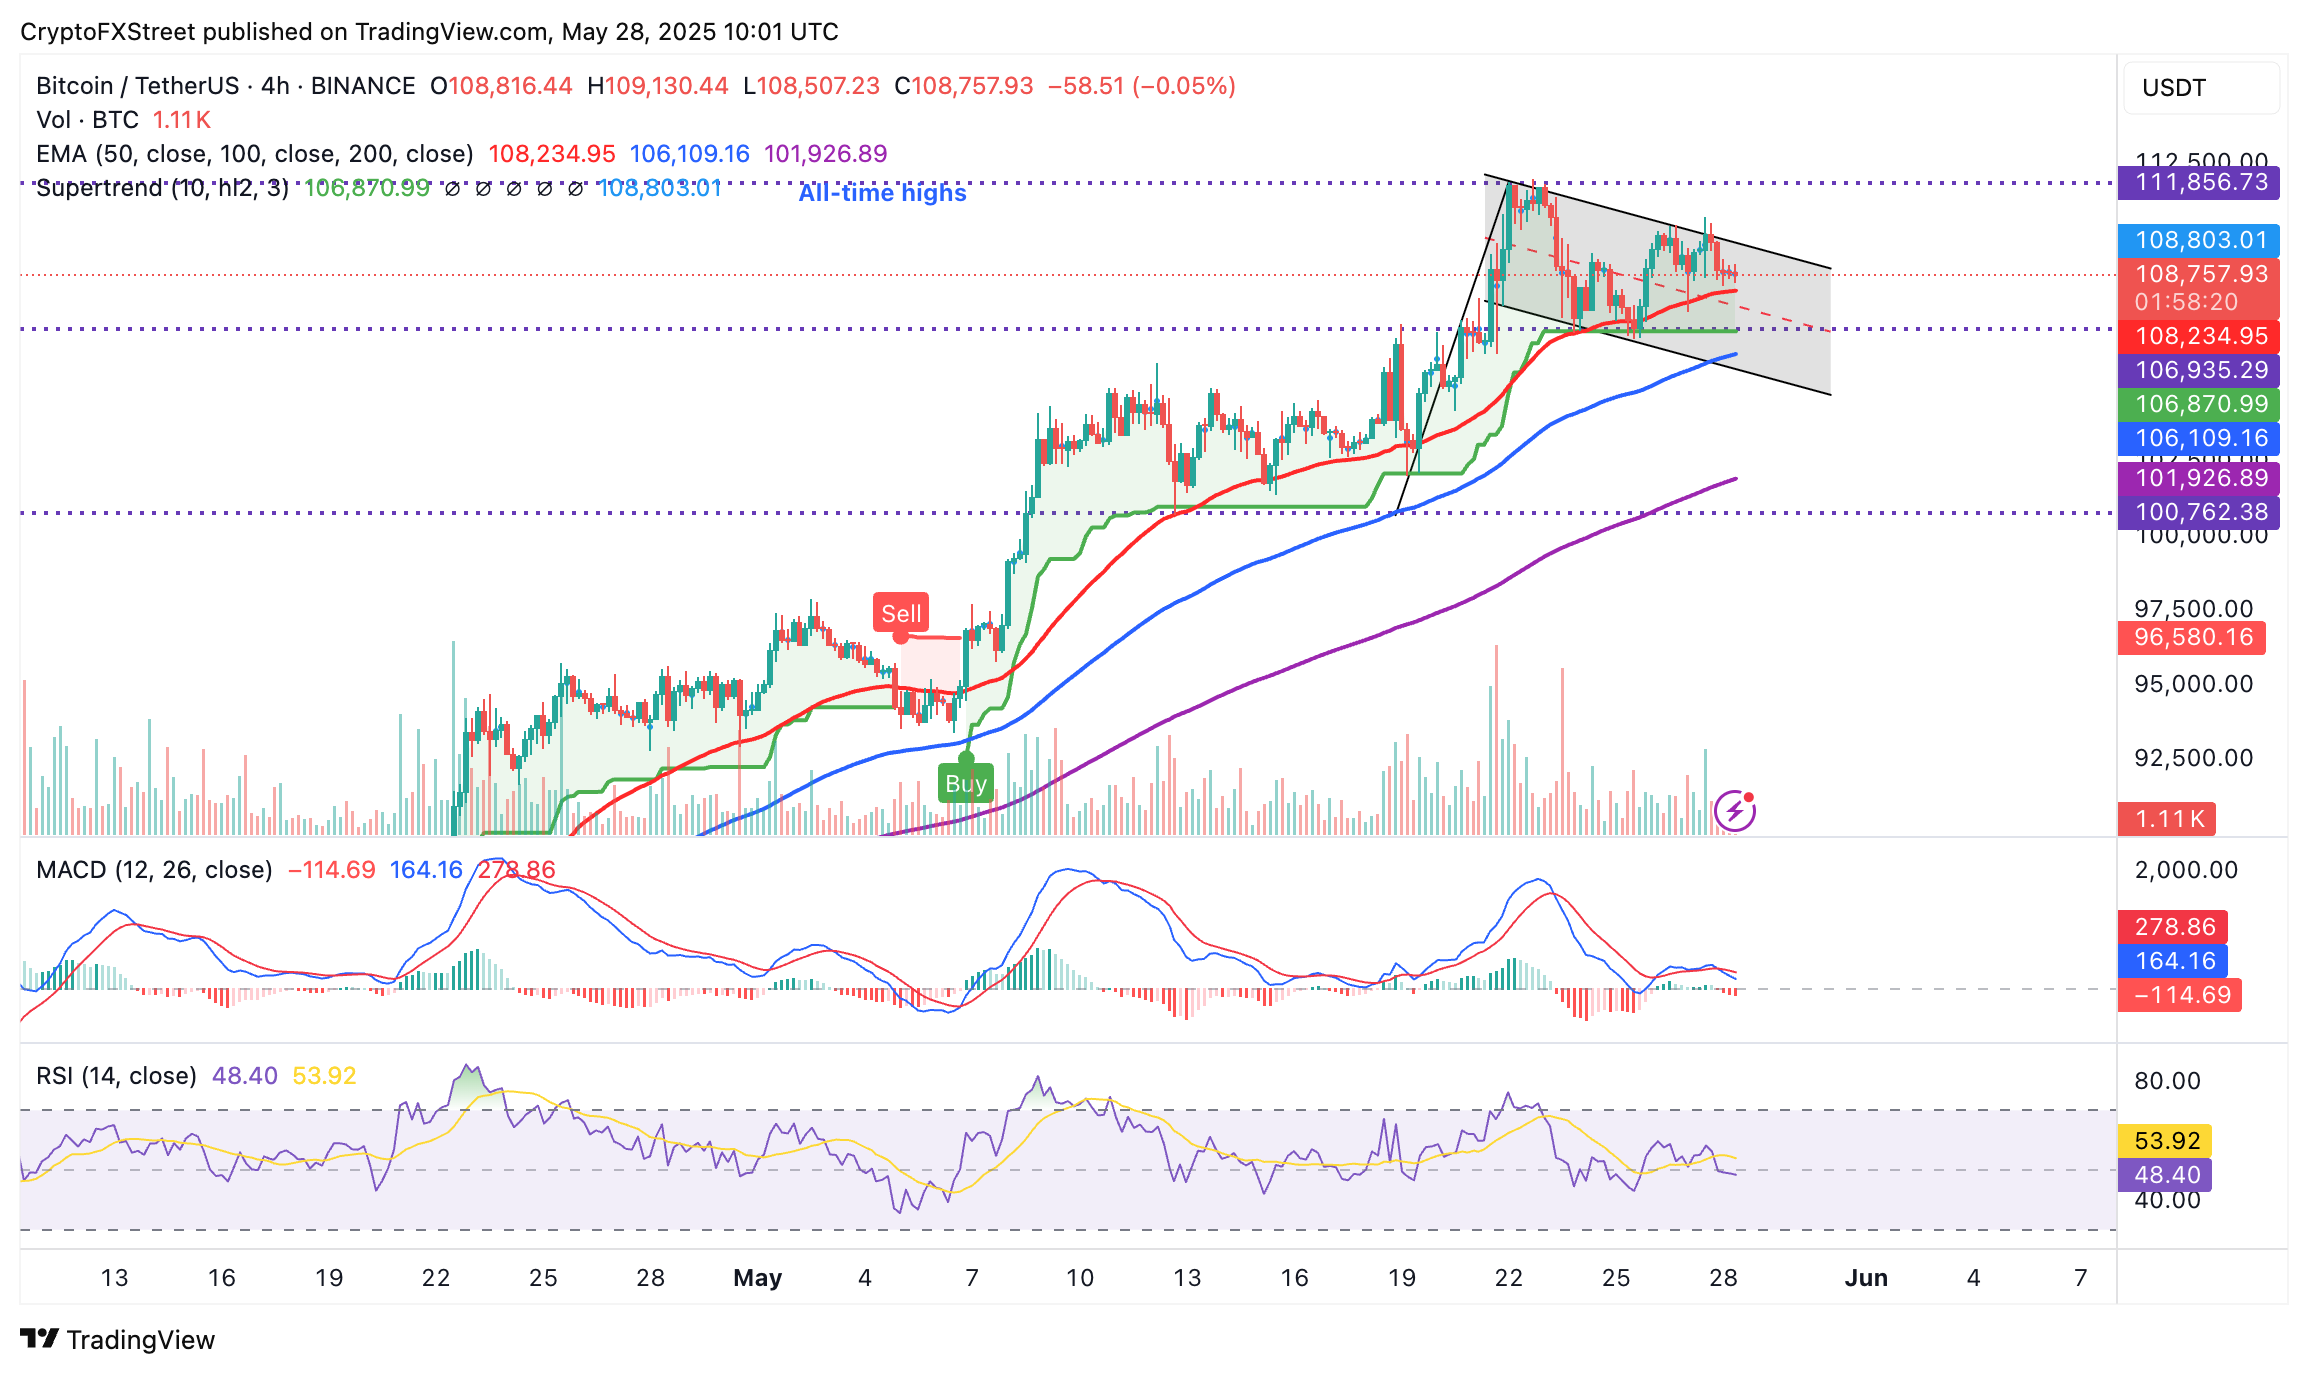
BTC/USDT 4-hour chart
The largest smart contracts token by market capitalization, Ethereum, continues to extend its current consolidation phase within a rectangle pattern. Like Bitcoin, downside risks remain apparent, especially after ETH's rejection from the pattern's upper boundary around $2,716.
Should the MACD indicator validate a sell signal with the blue MACD line crossing under the red signal line, the path with the least resistance could stay downward longer than expected. This signal could make Ethereum shorts attractive to traders, contributing to sell-side pressure.
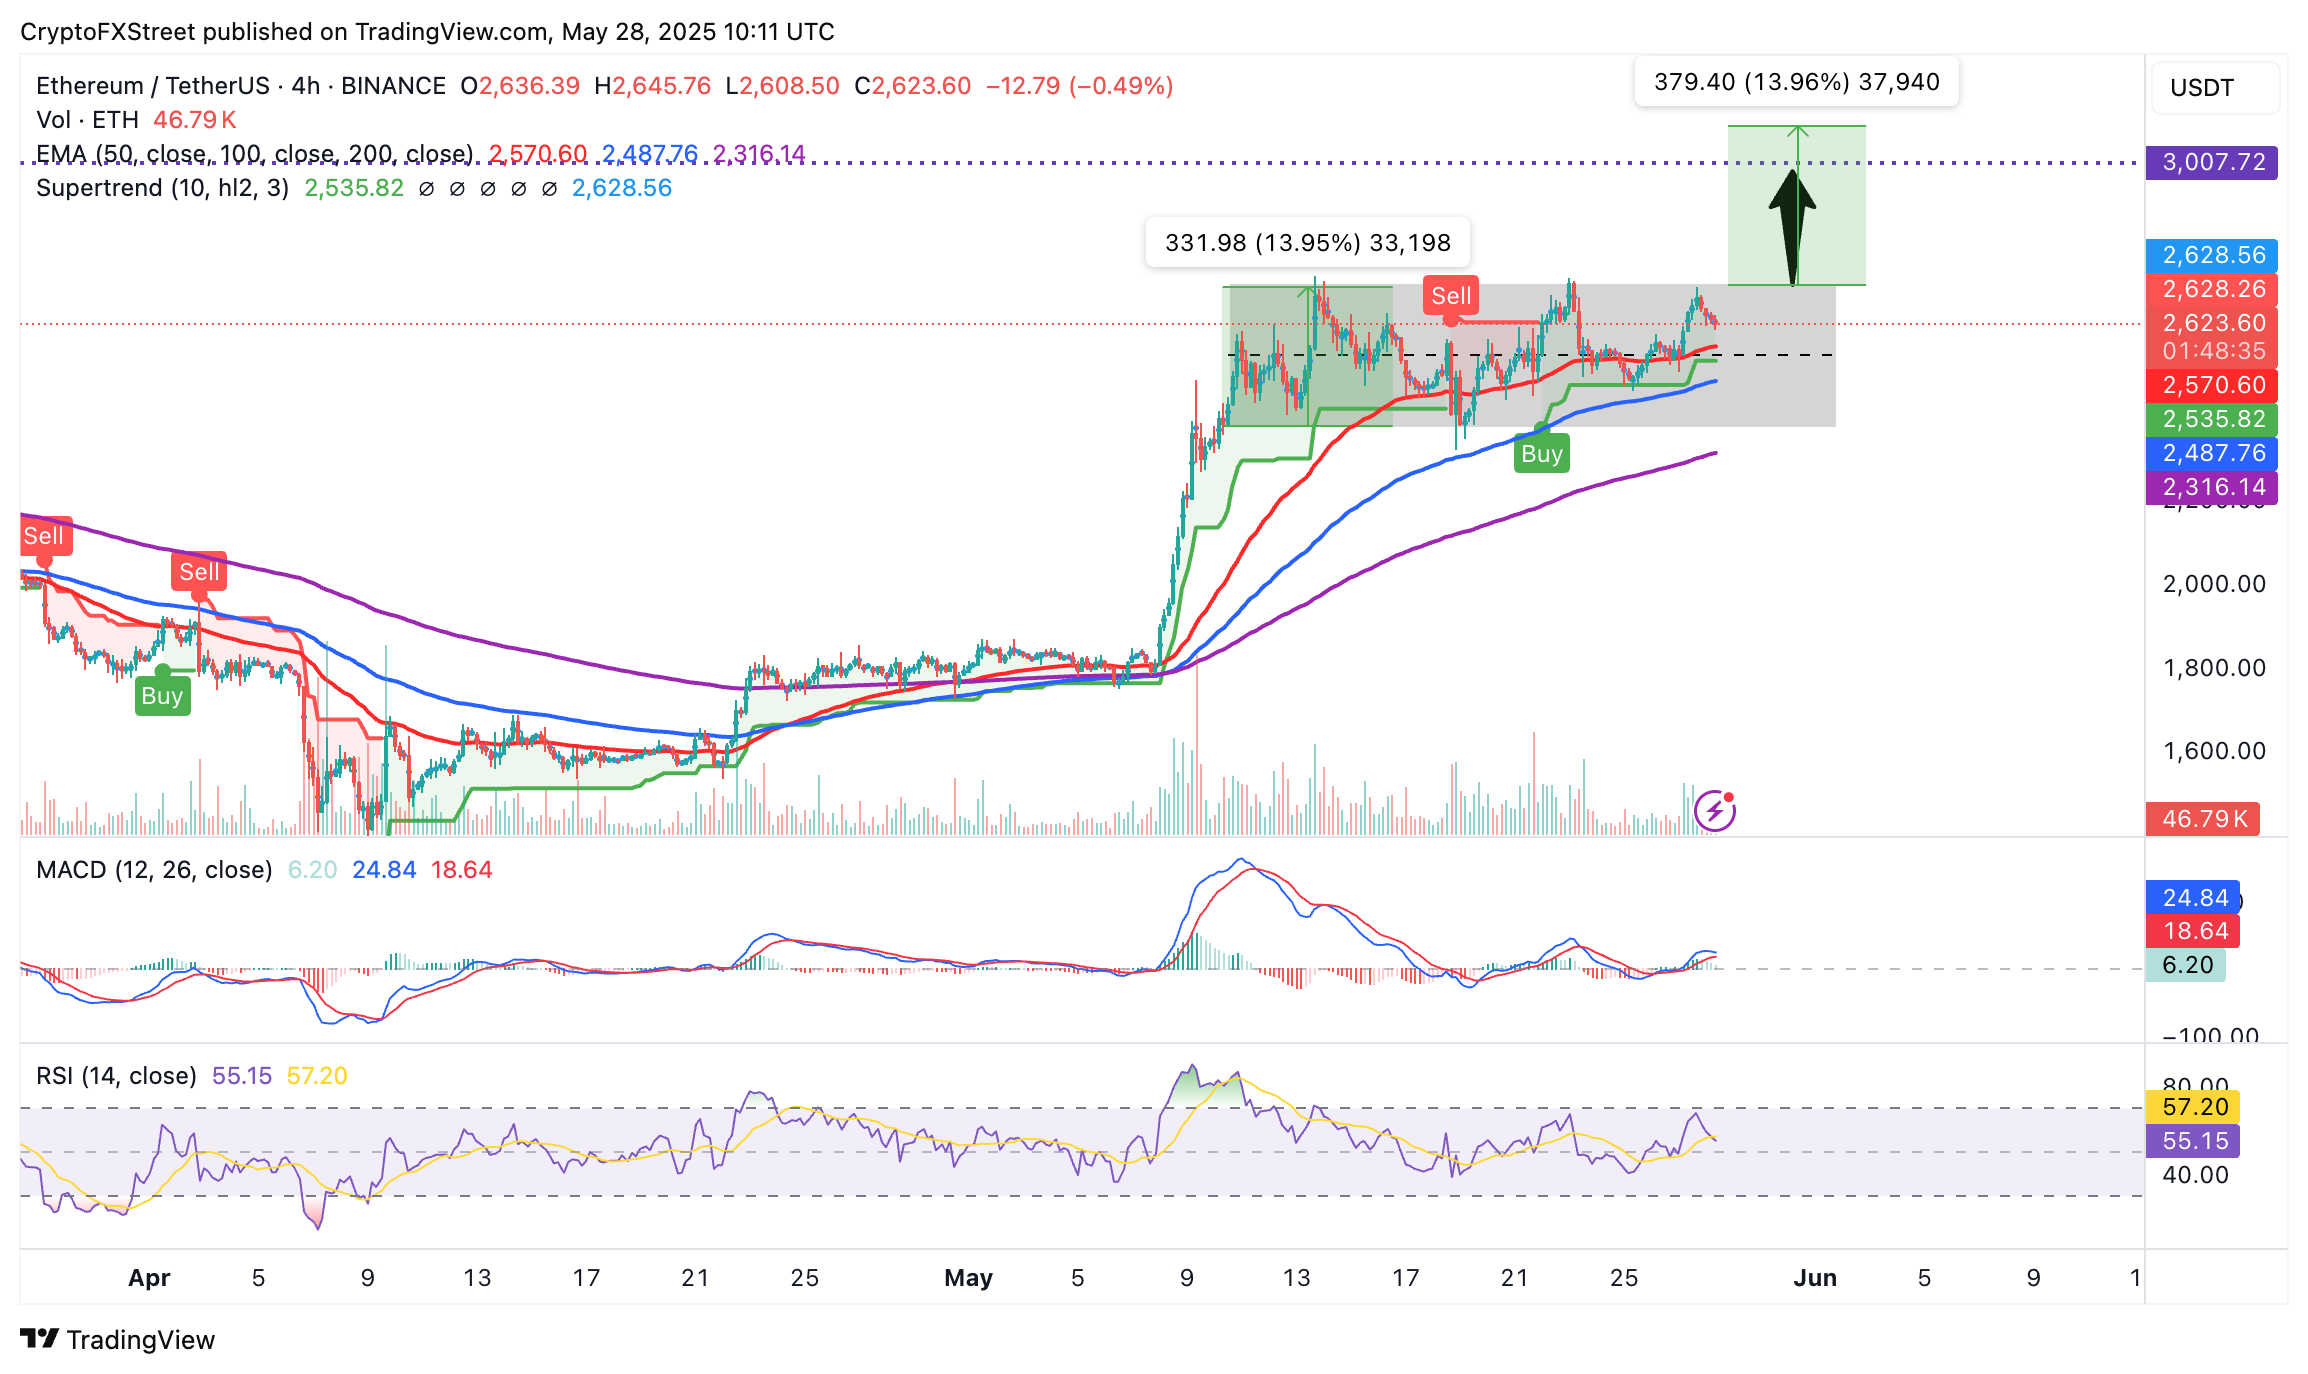
ETH/USDT 4-hour chart
The RSI's sharp drop from near-overbought conditions on Tuesday approaching the 50 midline shows that buyers are losing momentum.
Still, the rectangle is a bullish pattern, which, if validated, could propel Ethereum's price 14% above the breakout point (the upper boundary) to $3,096.
A sharp increase in trading volume often accompanies such a breakout. The breakout target is determined by measuring the width of the rectangle and extrapolating it above the breakout point.
Cryptocurrency metrics FAQs
The developer or creator of each cryptocurrency decides on the total number of tokens that can be minted or issued. Only a certain number of these assets can be minted by mining, staking or other mechanisms. This is defined by the algorithm of the underlying blockchain technology. On the other hand, circulating supply can also be decreased via actions such as burning tokens, or mistakenly sending assets to addresses of other incompatible blockchains.
Market capitalization is the result of multiplying the circulating supply of a certain asset by the asset’s current market value.
Trading volume refers to the total number of tokens for a specific asset that has been transacted or exchanged between buyers and sellers within set trading hours, for example, 24 hours. It is used to gauge market sentiment, this metric combines all volumes on centralized exchanges and decentralized exchanges. Increasing trading volume often denotes the demand for a certain asset as more people are buying and selling the cryptocurrency.
Funding rates are a concept designed to encourage traders to take positions and ensure perpetual contract prices match spot markets. It defines a mechanism by exchanges to ensure that future prices and index prices periodic payments regularly converge. When the funding rate is positive, the price of the perpetual contract is higher than the mark price. This means traders who are bullish and have opened long positions pay traders who are in short positions. On the other hand, a negative funding rate means perpetual prices are below the mark price, and hence traders with short positions pay traders who have opened long positions.
Recommended Articles


