
Top 3 Price Prediction: BTC slips below key support, ETH and XRP show bearish cues


Bitcoin closes below the critical $106,400 support level, signaling the potential for a deeper correction.
Ethereum struggles to breach the $2,724 resistance, with weakening momentum increasing downside risk.
Ripple dips under its 50-day EMA, setting the stage for a possible pullback toward $1.96.
Bitcoin (BTC) trades below $106,000 on Friday after slipping below a crucial support level, increasing the likelihood of a deeper correction. Ethereum (ETH) faces rejection from a key level while Ripple (XRP) closes below its important support zone, both suggesting increasing downside risks in the near term.
Bitcoin closes below key support, heading toward the $100,000 mark
Bitcoin price dipped and closed below its daily level of $106,406 on Thursday, following its ongoing correction over the previous two days. At the time of writing on Friday, it hovers and trades at around $105,600.
If BTC continues its correction, it could extend the decline to revisit its psychologically important level of $100,000.
The Relative Strength Index (RSI) reads 54, pointing downward toward its neutral level of 50, indicating fading bullish momentum. Additionally, the Moving Average Convergence Divergence (MACD) indicator also showed a bearish crossover. It also shows rising red histogram bars below its neutral level, indicating a correction ahead.
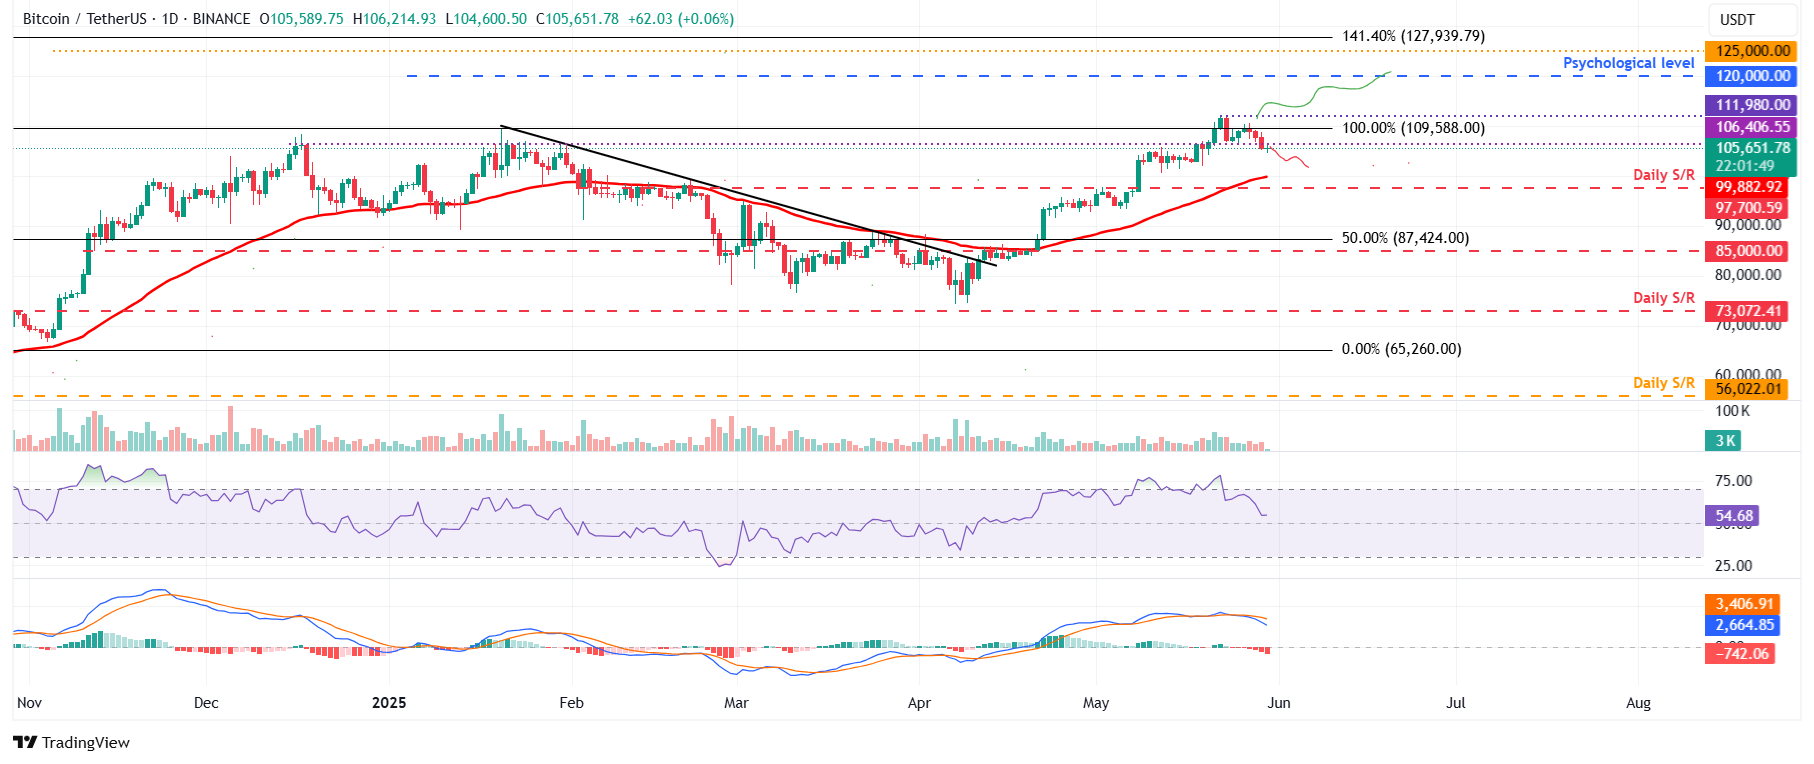
BTC/USDT daily chart
However, if BTC recovers and closes above its all-time high, it could extend the rally toward the key psychological level of $120,000.
Ethereum shows weakness as it faces rejection from its $2,724 resistance
Ethereum price faced rejection around its daily level of $2,724 on Thursday and declined slightly. At the time of writing on Friday, it continues to trade down around $2,600.
Suppose ETH continues its correction and closes below the 200-day Exponential Moving Average (EMA) at $2,455 on a daily basis. ETH could extend the decline to retest its next support level at $2,277, its 50-day EMA.
The RSI on the daily chart reads 64, having been rejected from its overbought level of 70 on Wednesday, and is pointing downward, indicating a fading bullish momentum. The MACD indicator also displayed a bearish crossover, further underscoring the weakness in momentum and indicating a potential downward trend.
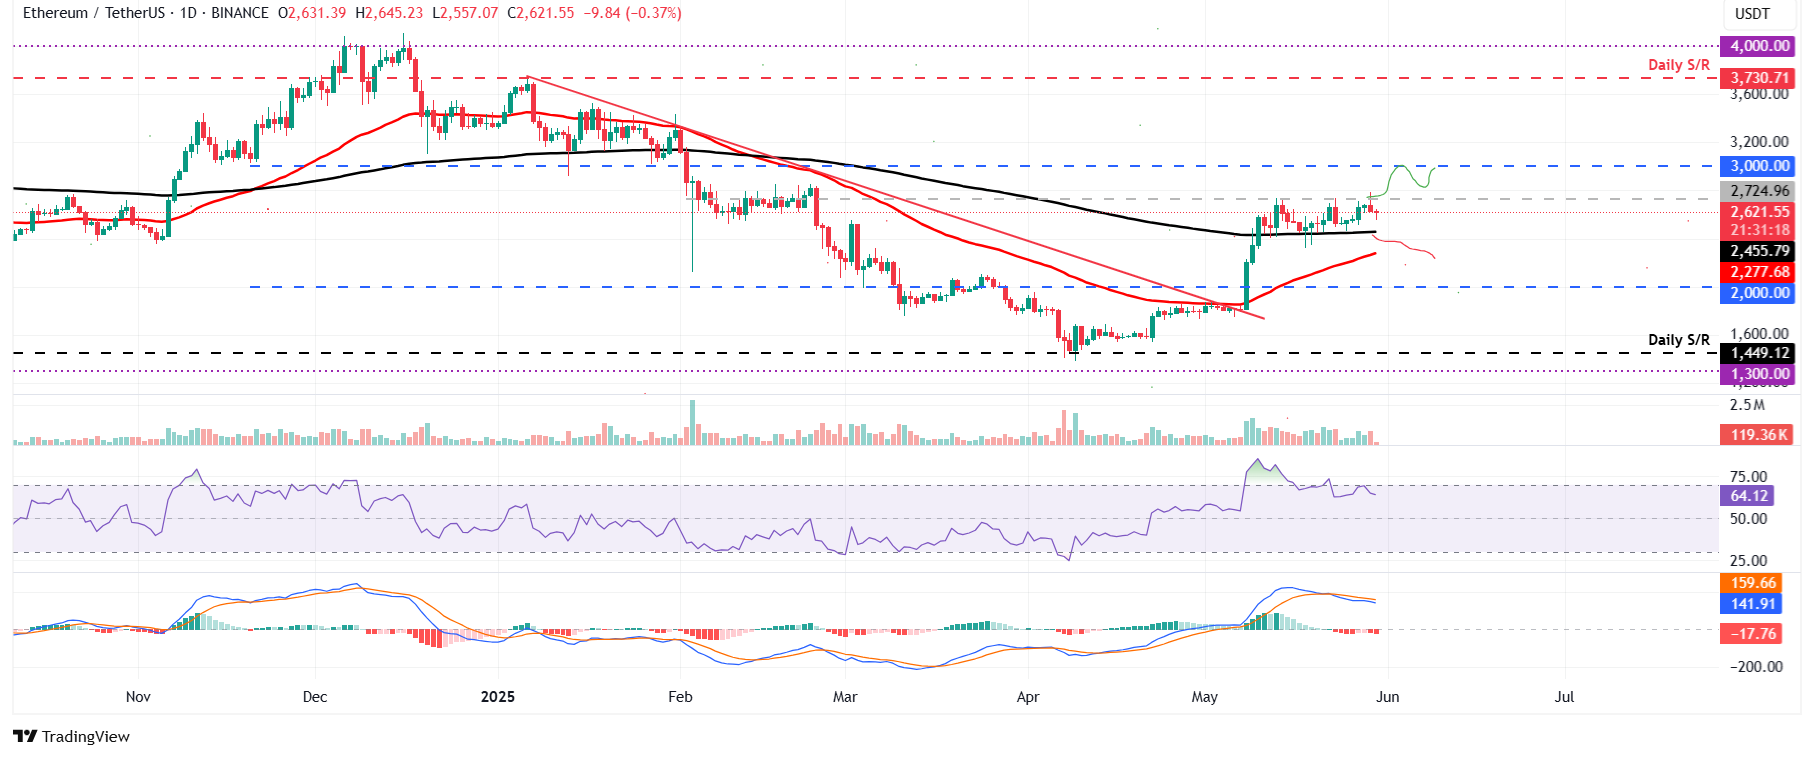
ETH/USDT daily chart
Conversely, if ETH breaks and closes above its $2,724 resistance on a daily basis, it could extend the rally to retest its psychologically important level at $3,000.
XRP faces a downleg as it closes below its 50-day EMA
XRP price faced a pullback and closed below its 50-day EMA at $2.29 on Wednesday, declining 3% the following day. At the time of writing on Friday, it continues to trade down around $2.21.
If XRP continues its downward trend, it could extend the correction to retest its next support level at $1.96.
The RSI on the daily chart reads 41, below its neutral level of 50 and points downward, indicating strong bearish momentum. The MACD indicator also displayed a bearish crossover, further underscoring the weakness in momentum and indicating the continuation of a downward trend.
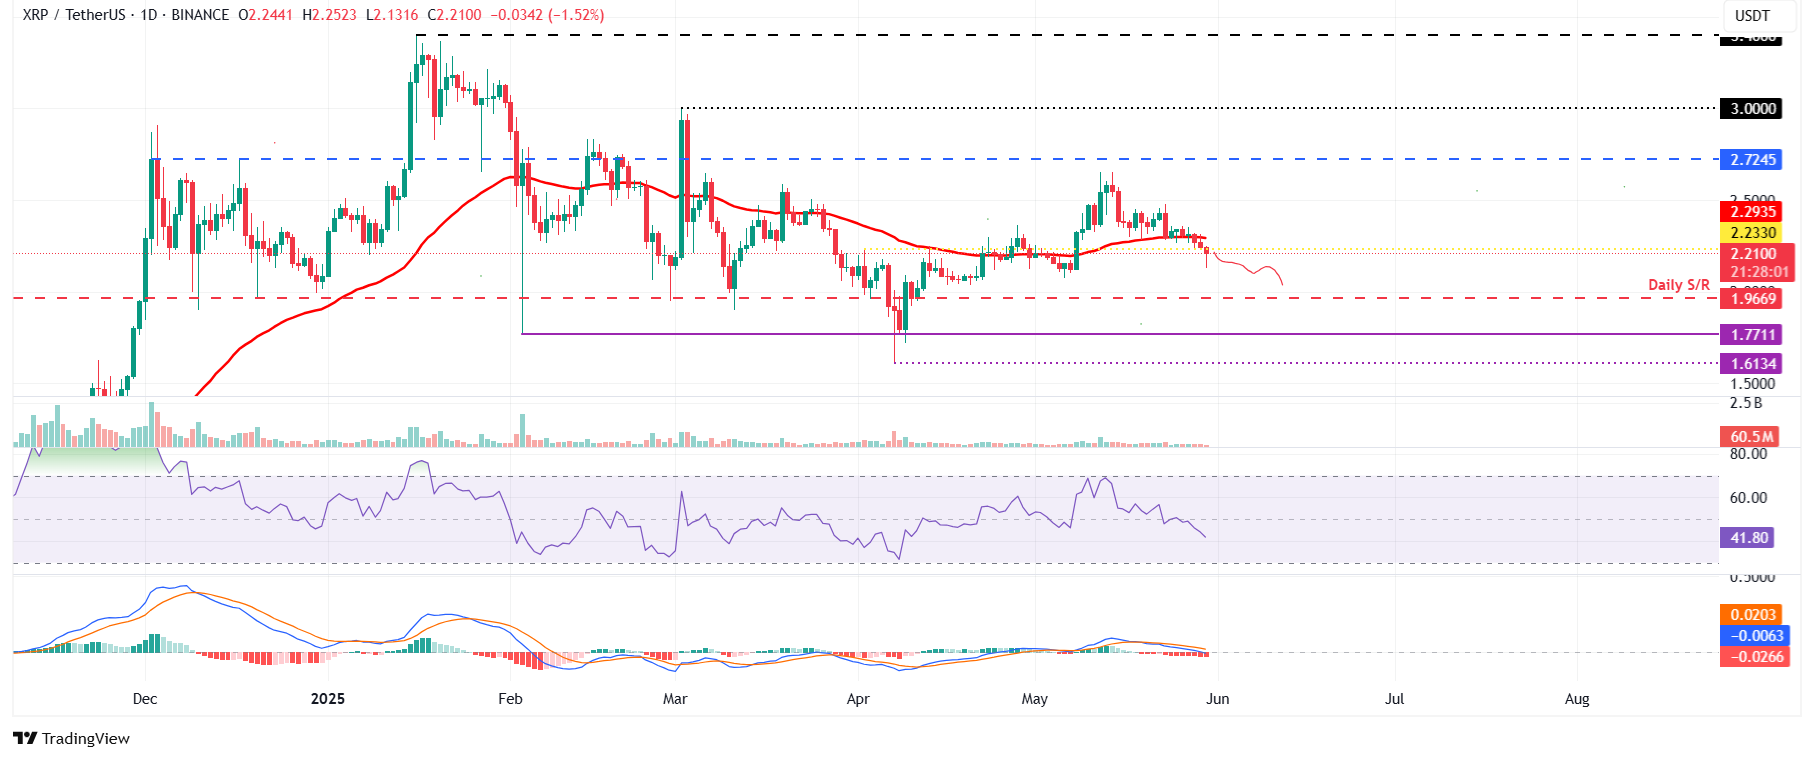
XRP/USDT daily chart
On the other hand, if XRP recovers, it could extend the recovery to retest its 50-day EMA at $2.29.
* The content presented above, whether from a third party or not, is considered as general advice only. This article should not be construed as containing investment advice, investment recommendations, an offer of or solicitation for any transactions in financial instruments.


