

Dogecoin Price Prediction: DOGE refuses to let WIF have all the fun
- Dogecoin is leading meme coins north, even though Dogwifhat is outperforming it.
- With DOGE defending the gains, the upside potential remains alive and the meme coin could reclaim its March 2 peak.
- If Dogecoin price loses the $0.1356 support, it could weaken the bullish thesis, paving the way for an extended fall.
Dogecoin (DOGE) price is trading with a bullish bias, but so are Dogwifhat (WIF) and most of the large market capitalization-sized meme coins.
Also Read: DOGE, SHIB, PEPE, WIF soar as meme coins prove to be a global shelling point for speculative liquidity
Dogecoin defends gains against Dogwifhat
Dogecoin (DOGE) price is up 69% over the last week, while Dogwifhat price is up almost 420% in the same timeframe. Over the last day, DOGE is up only by a fraction, but WIF boasts upwards of 30% in gains.
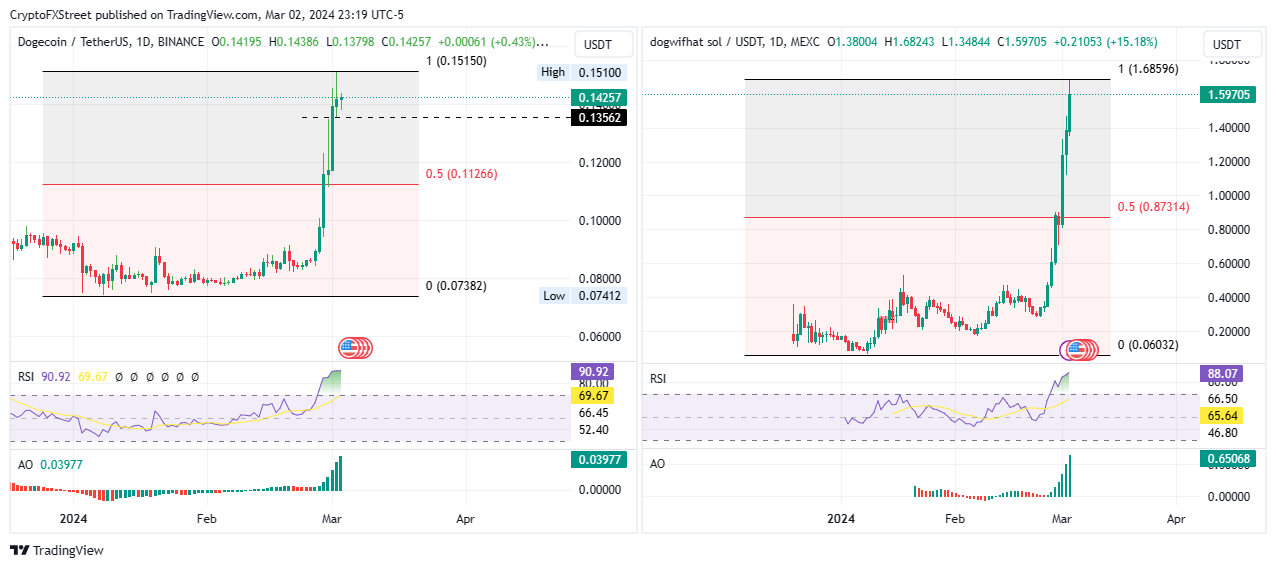
DOGE/USDT 1-day chart, WIF/USDT 1-day chart
Nevertheless, despite the abysmal gains, the Dogecoin price still has some upside potential as it continues to defend the $0.1356 support level. Like DOGE, WIF could still extend the gains.
Notably, the upside potential of Dogecoin is for the most part influenced by Bitcoin (BTC) price, seeing as DOGE maintains a strong correlation with Bitcoin price. Data according to IntoTheBlock shows a correlation of 85%.

BTC-DOGE Correlation
The strong correlation between BTC and DOGE is a bullish fundamental for Dogecoin considering the Bitcoin market is currently on fire, steered by growing interest in BTC exchange-traded funds (ETFs). This is reinforced by anticipation of the BTC halving, barely seven weeks out. The overflows of the BTC rally could spill over to Dogecoin, catalyzing its surge.
Dogecoin price outlook amid soaring BTC-DOGE correlation
Dogecoin price managed to flip the ascending trendline into a support with the god candle recorded on March 1. As it continues to hold above this trendline, DOGE price could record more gains. Increased buying pressure above current levels could see the largest meme coin by market capitalization reclaim the $0.1510 range high, nearly 7% above current levels.
In a highly bullish case, Dogecoin price could clear this local top, extending a neck higher to tag the $0.1600 psychological level. Such a move would constitute a 13% climb above current levels.
The Relative Strength Index (RSI) is northbound, pointing to rising momentum as the bulls continue to maintain a strong presence in the DOGE market. This is seen with the large volumes of green histogram bars of the Awesome Oscillator (AO) and the Moving Average Convergence Divergence (MACD) in positive territory.
The position of the MACD well above its signal line (orange band) further strengthens the bullish outlook, showing the optimism cycle is strengthening.

DOGE/USDT 1-day chart
On the flip side, if selling pressure increases and Dogecoin price slips below the support due to the ascending trendline, confirmed by a close below the $0.1356 support, DOGE value could extend towards the $0.1200 psychological level.
In a dire case, Dogecoin price could descend towards the mid-level of the market range at the 50% Fibonacci retracement level of $0.1126. This would constitute a 20% fall below current levels.
Recommended Articles


