Chainlink Price Prediction: Another buy opportunity at $18.12 likely for LINK traders

Source Fxstreet
  • Chainlink price has taken its wave-like motion the next step, having established another range higher.
  • LINK could drop 10% before another leg up, providing entry for traders looking to buy the dip.
  • A break and close below $18.86 would produce a lower low, initiating a possible trend change.

Chainlink (LINK) price is trading with a bullish bias, recording higher highs and higher lows since October when cryptocurrency markets turned bullish. The altcoin has provided one of the easiest trades since November, with a defined and predictable wave-like motion within a range. If history rhymes, LINK traders could have another chance to buy LINK at discounted rates.

Also Read: Chainlink’s large wallet holders pull $216 million worth of LINK out of exchanges, fuel gains

Chainlink price eyes 10% fall before next leg up

Chainlink (LINK) price is confronting resistance at $20.70 for the second time in February. The altcoin could suffer a rejection, potentially falling 10% to $18.12, and giving another buy opportunity around this level before the next leg up.

Notice the position of the Relative Strength Index (RSI), around the level where it has pulled south multiple times in the past. The Moving Average Convergence Divergence (MACD) indicator also has a bearish crossover in the line, pending execution once the orange band of the signal line crosses below the MACD, expected to provoke a trend reversal to the south.

Buy orders are likely accumulated around the $18.12, the 50-day Simple Moving Average (SMA) at $17.49, or for the overly confident traders, the $16.86 support level, which is a critical area marking the peak of the previous range-bound move.


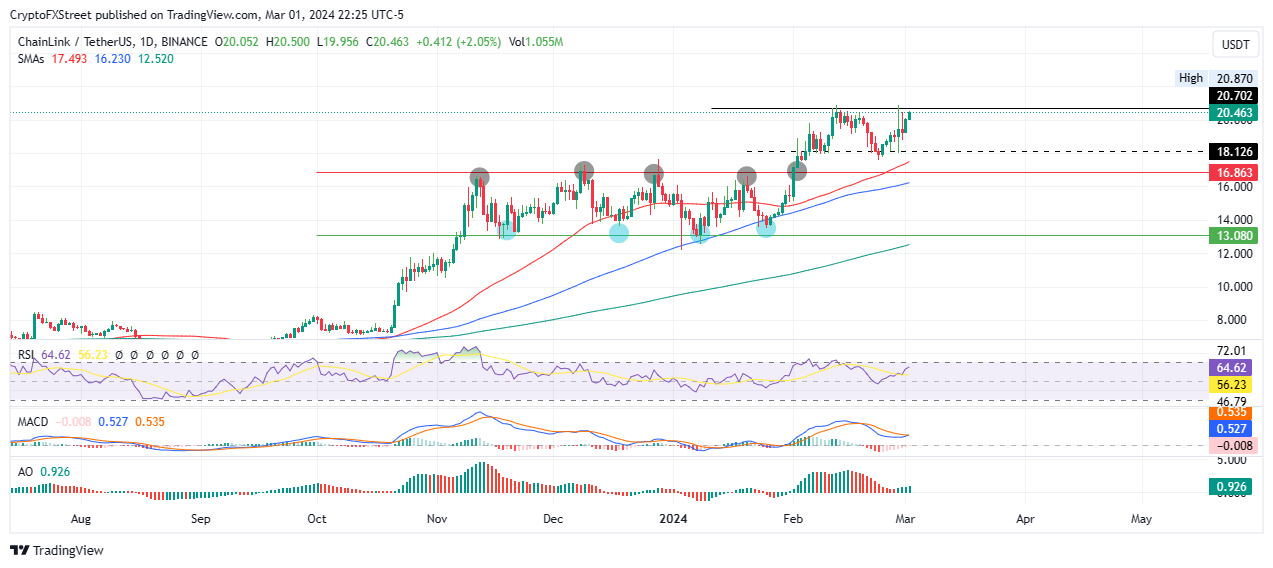
LINK/USDT 1-day chart

On the flip side, if buying pressure increases, Chainlink price could extrapolate the gains. A break and close above the $20.87 range high would violate the pattern. To the south side, a break and close below $16.86 range bottom would produce a lower low, flipping the trend in favor of the downside. 

Disclaimer: For information purposes only. Past performance is not indicative of future results.
placeholder
Bitcoin Price Forecast: BTC battles at key technical zone amid mixed flow signalsBitcoin (BTC) steadies around the key technical support on Tuesday after its recent correction. The Crypto King’s next directional move could hinge on this key technical zone.
Author  FXStreet
13 hours ago
Bitcoin (BTC) steadies around the key technical support on Tuesday after its recent correction. The Crypto King’s next directional move could hinge on this key technical zone.
placeholder
WTI declines below $102.00 after Trump says he called off Iran attacksWest Texas Intermediate (WTI), the US crude oil benchmark, is trading around $101.85 during the early Asian trading hours on Tuesday. The WTI price declines after US President Donald Trump said he was holding off a military attack on Iran planned for Tuesday at the request of Gulf states.
Author  FXStreet
22 hours ago
West Texas Intermediate (WTI), the US crude oil benchmark, is trading around $101.85 during the early Asian trading hours on Tuesday. The WTI price declines after US President Donald Trump said he was holding off a military attack on Iran planned for Tuesday at the request of Gulf states.
placeholder
Iran Situation Rekindles Threat of War. Bitcoin Price Decline Accelerates, $75,000 Geopolitical Defense Line Faces TestU.S.-Israel discussions on resuming strikes against Iran trigger an accelerated Bitcoin price pullback; future gains depend on whether the $75,000 support level holds.On May 18, the poten
Author  TradingKey
Yesterday 09: 03
U.S.-Israel discussions on resuming strikes against Iran trigger an accelerated Bitcoin price pullback; future gains depend on whether the $75,000 support level holds.On May 18, the poten
placeholder
Euro softens to near 1.1600 on US–Iran tensions The EUR/USD pair trades in negative territory around 1.1615 during the early Asian session on Monday. The Euro (EUR) extends the decline as the prolonged US-Iran conflict weighs on the riskier assets.
Author  FXStreet
Yesterday 01: 34
The EUR/USD pair trades in negative territory around 1.1615 during the early Asian session on Monday. The Euro (EUR) extends the decline as the prolonged US-Iran conflict weighs on the riskier assets.
placeholder
Financial Markets 2026: Volatility Catalysts in Gold, Silver, Oil, and Blue-Chip Stocks—A CFD Trader's OutlookGet a comprehensive financial market 2026 outlook exploring key economic drivers, volatility catalysts in gold, oil and stocks, and what the evolving economic outlook means for cfd trading strategies and risk management on global markets.
Author  Rachel Weiss
May 15, Fri
Get a comprehensive financial market 2026 outlook exploring key economic drivers, volatility catalysts in gold, oil and stocks, and what the evolving economic outlook means for cfd trading strategies and risk management on global markets.
Related Instrument
goTop
quote