


Could Bitcoin Be on the Verge of a Bull Rally? Analysts See Positive Signs in May
Bitcoin (BTC) is exhibiting signs of a potential bullish trend in May, driven by key indicators. Experts have highlighted factors such as miner economics, network hashrate, long-term holder accumulation, and rising global fiat liquidity, suggesting that a price increase could be on the horizon.
This comes as the largest cryptocurrency continues its recovery rally from early April lows, up 14.6% over the past month.
Is a Bitcoin Bull Run Returning?
In the latest X (formerly Twitter) post, analyst and WiM Media founder Robert Breedlove referenced Blockware Team’s average miner breakeven cost data to forecast that Bitcoin might be on the cusp of a bull market.
He noted that the price generally doesn’t remain below this average for extended periods, as it represents the threshold at which miners may cease operations if unprofitable.
“In a rational economy, assets rarely trade below their cost of production,” Breedlove remarked.
He highlighted that the index accurately identified six bottoms between 2016 and 2024. Notably, it signals another bottom, suggesting that a price increase in Bitcoin could be imminent.
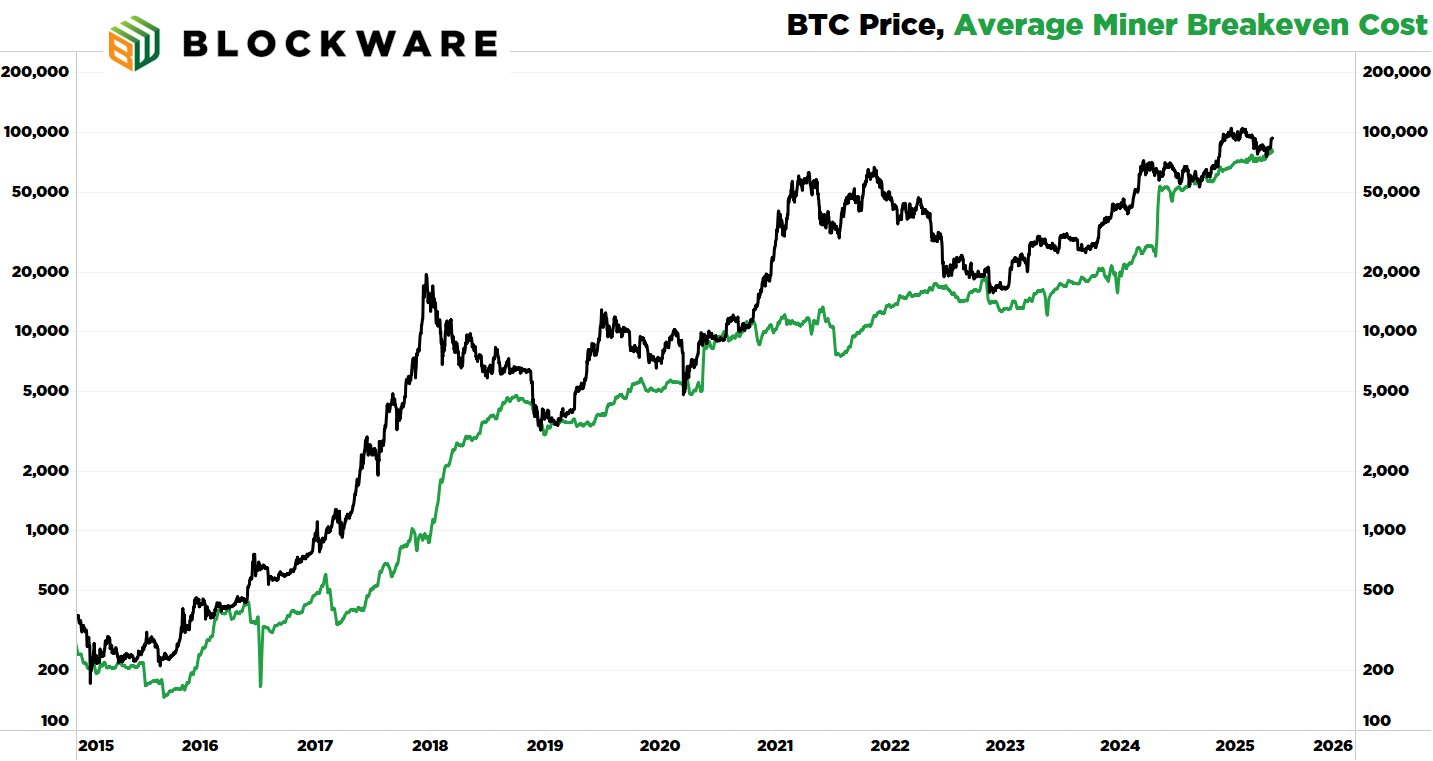 Bitcoin Miner’s Average Cost of Production. Source: X/Robert Breedlove
MacroMicro data further supports this. At the time of writing, the 30-day moving average (MA) of the mining cost-to-BTC price ratio stood at 1.05.
This indicated that miners have been operating at a loss on average over the past month. Therefore, this could potentially lead to an upward price movement as miners operating at a loss scale back, tightening supply.
The Bitcoin hash rate price model, which evaluates Bitcoin’s value based on the historical relationship between its price and hash rate, adds to the bullish outlook.
Analyst Giovanni commented on X that the model is currently at a Bitcoin support level.
“The fact the hash rate based BTC valuation is at the support level means that probably we reached some kind of local bottom,” the analyst said.
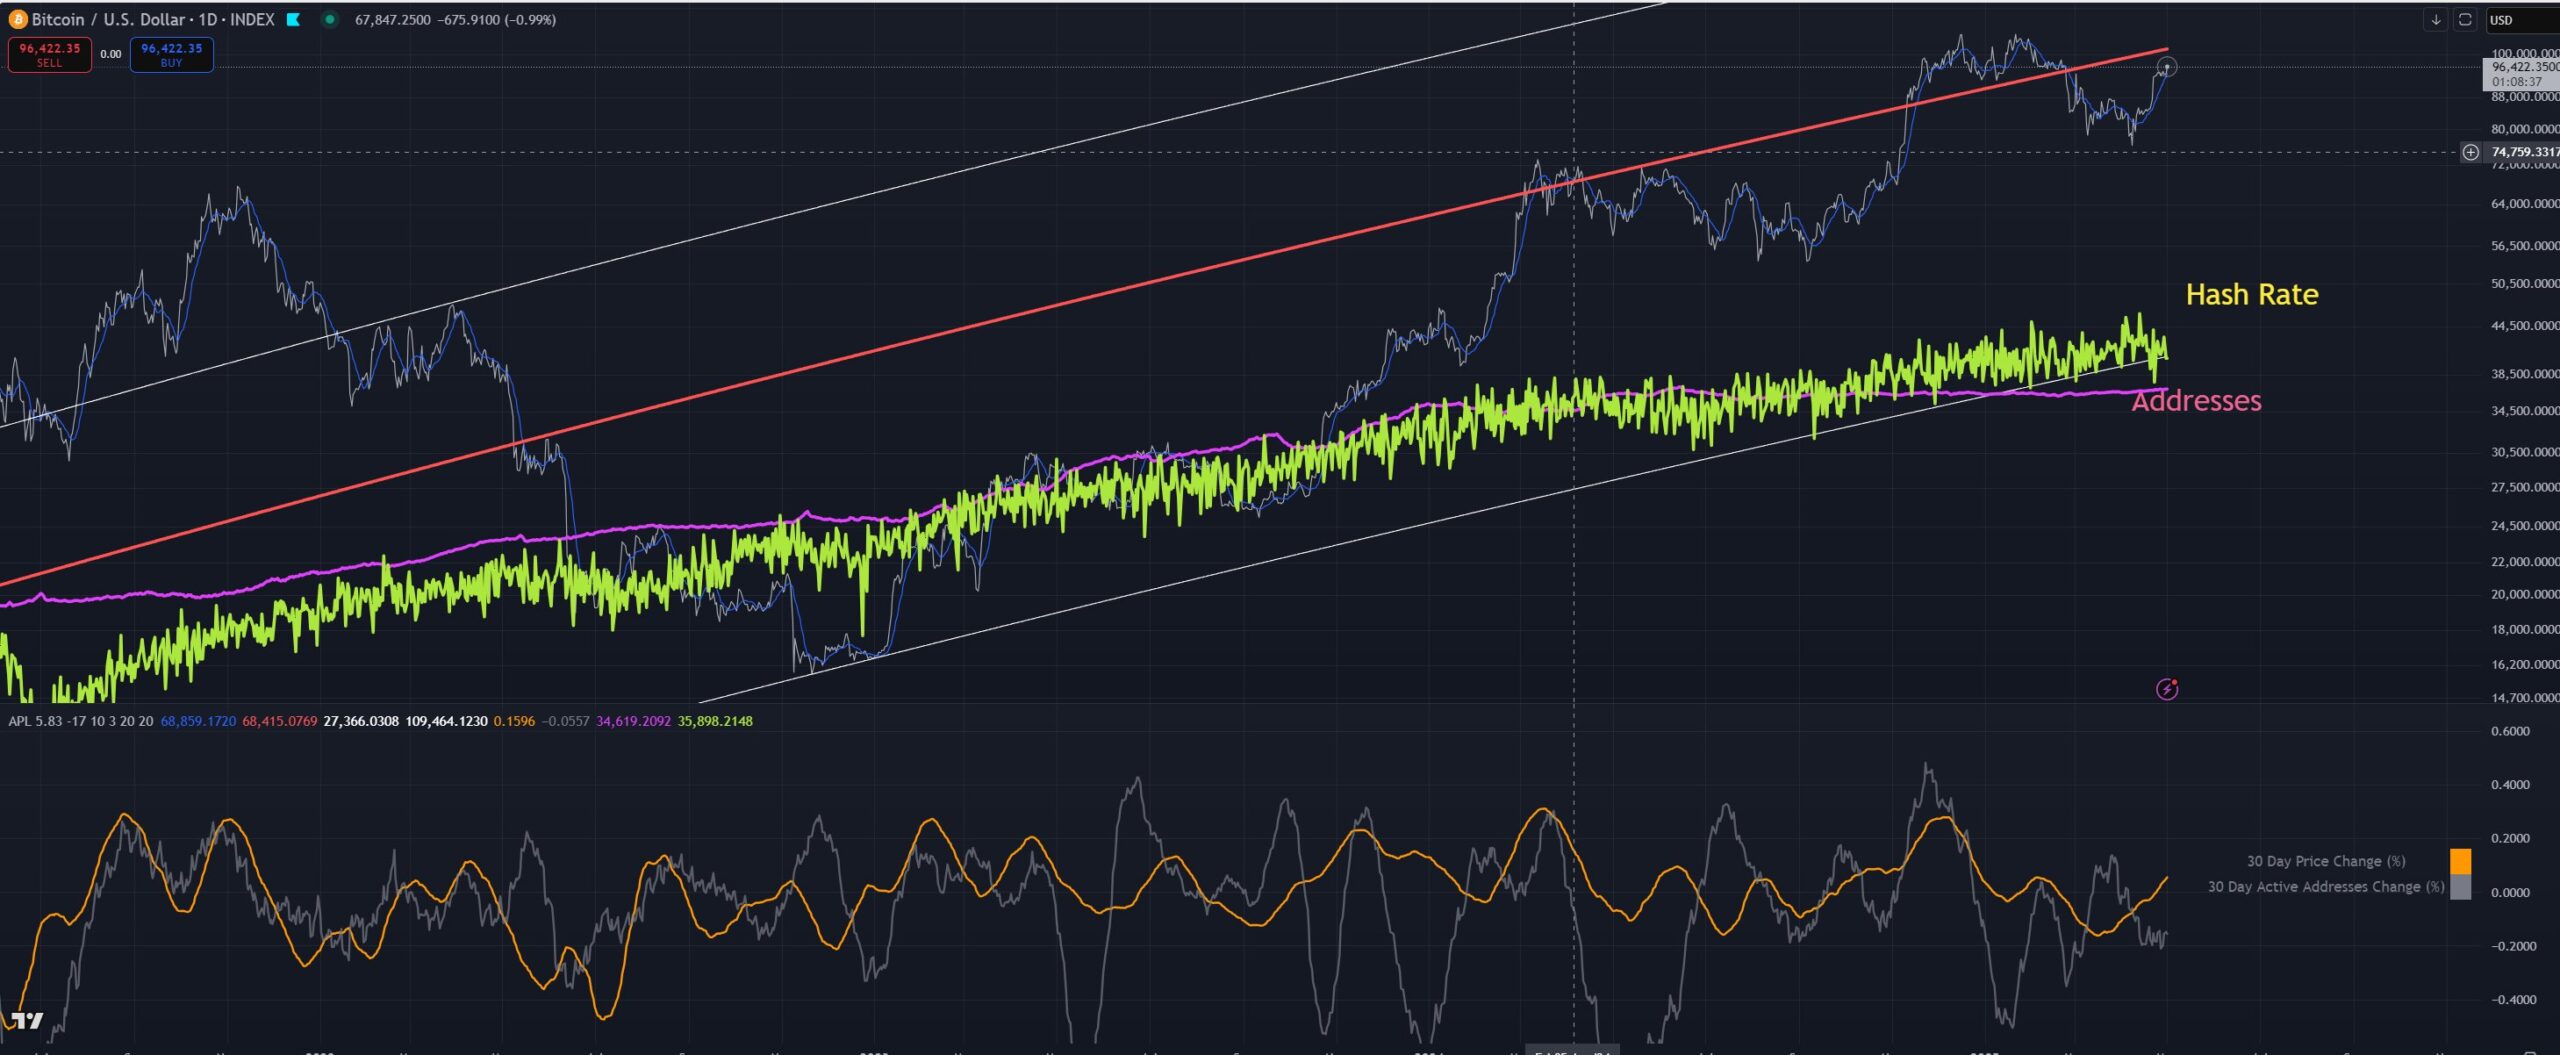 Bitcoin Power Law Hash Rate Indicator. Source: X/Giovanni
Additional market signals reinforce the case for a potential rally. Breedlove pointed out that long-term holders have accumulated approximately 150,000 BTC over the past 30 days. This suggested reduced selling pressure in the $80,000 to $100,000 range.
As fewer people are willing to sell Bitcoin at these levels, the price could face upward pressure as demand remains strong, but the supply of available Bitcoin dwindles.
“At its core, the Bitcoin price is simply a function of supply and demand. After an increase in the Bitcoin price, you start to see previously inactive coins move on-chain. Inversely, after prolonged periods of sideways or negative price action, long-term holders begin accumulating more coins, setting the stage for a supply-shock and upward price pressure,” he added.
Furthermore, rising global fiat liquidity is expanding the pool of capital available to invest in Bitcoin. This is further bolstered by exchange-traded funds (ETFs), Bitcoin treasury companies, and convertible bonds.
These financial vehicles provide easier access for new liquidity to enter the Bitcoin market, bridging the gap between traditional finance and cryptocurrency.
“And it’s not just USD liquidity that’s increasing – liquidity of all fiat currencies is on the rise, and Bitcoin is a global asset,” Breedlove stated.
Recently, BeInCrypto also highlighted a few bullish factors for BTC. The coin’s apparent demand turned positive, implying an increase in interest or buying activity for Bitcoin.
Additionally, the Market Value to Realized Value (MVRV) ratio rebounded from the historically significant mean of 1.74. This movement has previously proven to be a reliable indicator of the early stages of a bull market for Bitcoin.
Amidst these bullish signs, BTC’s price performance has been quite notable. After briefly dropping below the 75,000 mark in early April, the price has continued to recover.
 BTC Price Performance. Source: BeInCrypto
Over the past week, BTC has seen a 4.3% uptick. At press time, Bitcoin’s trading price stood at $97,048, representing daily gains of 2.3%.
Recommended Articles


