

Is Bitcoin Demand Returning? Active Address Trend May Suggest So

Source Newsbtc

On-chain data shows the Bitcoin network is currently noting an uptick in Daily Active Addresses. Here’s what this could mean for BTC’s price.

Bitcoin Active Addresses Just Crossed The 800,000 Mark

In a new post on X, the market intelligence platform IntoTheBlock has discussed about the latest trend in the Daily Active Addresses of Bitcoin. The “Daily Active Addresses” here is an on-chain indicator that keeps track of the total number of BTC addresses that are becoming involved in some kind of transaction activity on the network every day.

When the value of this metric rises, it means the number of users becoming active on the blockchain is going up. Such a trend can be a sign that the interest in the cryptocurrency is on the rise.

On the other hand, the indicator going down implies investors may be shifting their attention elsewhere as not many of them are coming online to make moves on the network.

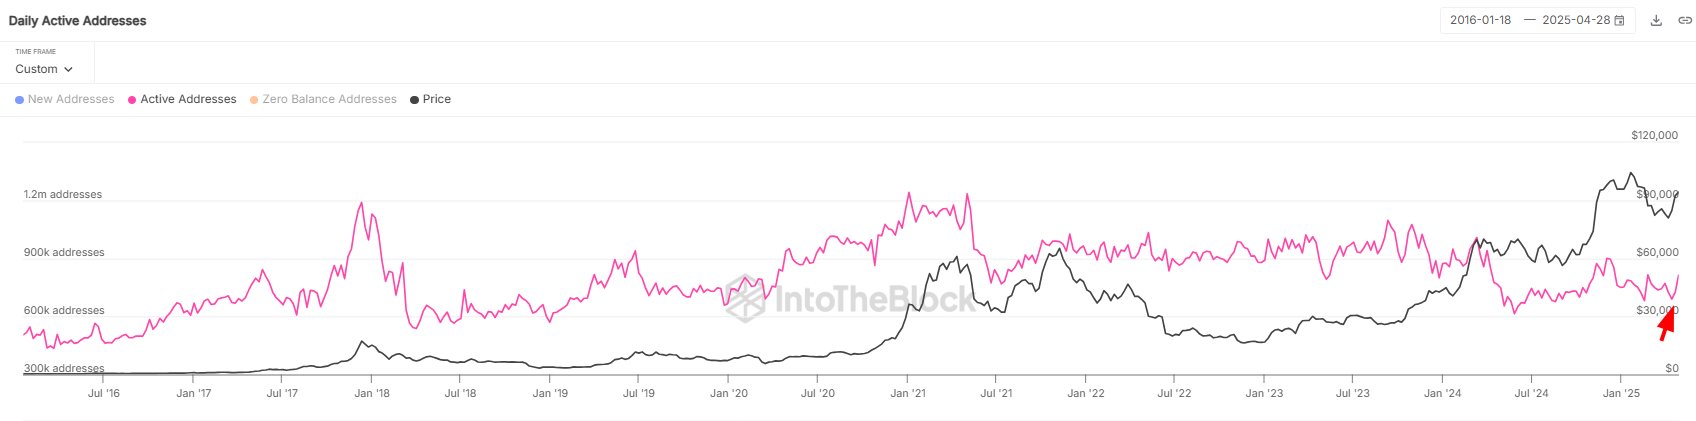
Now, here is the chart shared by the analytics firm that shows the trend in the Bitcoin Daily Active Addresses over the past decade:
Bitcoin Active Addresses

As displayed in the above graph, the Bitcoin Daily Active Addresses has witnessed a jump recently, suggesting user activity has grown on the network. This uplift in the indicator has come after the cryptocurrency has witnessed a price rally.

Historically, the blockchain has tended to become active during volatile periods, as investors usually come online to reposition themselves in such phases. As such, the latest spike in the Daily Active Addresses may not be too surprising.

Generally, rallies only end up being sustainable when they can attract user attention, as it’s the increased chain activity that can provide the fuel such a move needs to keep going. Price surges that are unable to induce an increase in the metric usually fizzle out before long.

Given that the Daily Active Addresses has jumped recently, the current recovery rally may at least be in the clear in terms of this, if the activity spike indeed corresponds to demand from the investors.

That said, while there has indeed been renewed activity on the Bitcoin network recently, the indicator’s current value of about 800,000 is still not too high when compared to the past.

Last year, the Daily Active Addresses managed to hit a high of 900,000. This value was still notably lower than the 1.2 million high that the blockchain saw during the past two bull markets.

BTC Price

Bitcoin has taken to sideways movement during the last few days as its price is still trading around the $94,800 level.

Bitcoin Price Chart
Disclaimer: For information purposes only. Past performance is not indicative of future results.
placeholder
Financial Markets 2026: Volatility Catalysts in Gold, Silver, Oil, and Blue-Chip Stocks—A CFD Trader's OutlookGet a comprehensive financial market 2026 outlook exploring key economic drivers, volatility catalysts in gold, oil and stocks, and what the evolving economic outlook means for cfd trading strategies and risk management on global markets.
Author  Rachel Weiss
May 15, Fri
Get a comprehensive financial market 2026 outlook exploring key economic drivers, volatility catalysts in gold, oil and stocks, and what the evolving economic outlook means for cfd trading strategies and risk management on global markets.
placeholder
Finding The Best Japan Stocks to Buy? These are Top Japanese Companies to Watch Discover the best Japanese stocks to buy, including AI semiconductor leaders, Buffett-backed trading houses, and undervalued Japan stocks benefiting from corporate reforms and yen trends.
Author  Mitrade
May 29, Fri
Discover the best Japanese stocks to buy, including AI semiconductor leaders, Buffett-backed trading houses, and undervalued Japan stocks benefiting from corporate reforms and yen trends.
placeholder
Bitcoin Price Forecast: Persistent ETF inflows, easing Middle East tensions lift risk appetiteBitcoin (BTC) extends its gains, trading above $64,800 at the time of writing on Thursday, breaking above the key resistance zone. Institutional demand supports BTC price action with spot Exchange Traded Funds (ETFs) recording a third consecutive day of inflows so far this week.
Author  FXStreet
Aug 06, Thu
Bitcoin (BTC) extends its gains, trading above $64,800 at the time of writing on Thursday, breaking above the key resistance zone. Institutional demand supports BTC price action with spot Exchange Traded Funds (ETFs) recording a third consecutive day of inflows so far this week.
placeholder
Gold Price Forecast: Can Gold Still Rise Above $4,300 Ahead of July Non-Farm Payrolls?As of the European session on August 7, gold prices ( XAUUSD) extended their recent strong performance, rising over 1% intraday to briefly cross the $4,300 mark. With a cumulative gain of
Author  TradingKey
Aug 07, Fri
As of the European session on August 7, gold prices ( XAUUSD) extended their recent strong performance, rising over 1% intraday to briefly cross the $4,300 mark. With a cumulative gain of
placeholder
WTI advances above $82.50 due to mixed signals regarding potential US-Iran dealWest Texas Intermediate (WTI) oil price extends its gains for the third successive day, trading around $82.70 per barrel during the Asian hours on Wednesday. Crude oil prices advance as investors weigh mixed signals regarding a potential deal between the United States (US) and Iran.
Author  FXStreet
6 hours ago
West Texas Intermediate (WTI) oil price extends its gains for the third successive day, trading around $82.70 per barrel during the Asian hours on Wednesday. Crude oil prices advance as investors weigh mixed signals regarding a potential deal between the United States (US) and Iran.
goTop
quote