

Top Analyst Predicts Ethereum Could Ignite Bull Rally If Price Surpasses $2,330

Source Newsbtc

As Bitcoin (BTC) approaches the $90,000 mark, Ethereum (ETH) remains in a consolidation phase, trading just above $1,500. This divergence in price movements has sparked discussions among crypto analysts regarding the potential future trajectory of Ethereum, particularly in light of Bitcoin’s bullish momentum.

Ethereum Bull Run Potential

Crypto analyst Ali Martinez recently shared insights on social media platform X (formerly Twitter), suggesting that Ethereum could ignite a new bull run if it manages to breach the critical resistance level at $2,330. 

Martinez emphasized that a breakout above this supply wall could signal renewed investor interest and push ETH towards significantly higher prices. However, Ethereum has been trapped in a narrow range between $1,500 and $1,650 for the past week, lacking any substantial catalysts to spur an upward movement.

The immediate focus for Ethereum bulls is the $1,600 level, which has emerged as a near-term resistance point. Market expert TedPillows highlighted that Ethereum has recently broken out of a downtrend for the first time since February 2025, indicating a potential shift in market sentiment. If ETH can hold above the $1,600 threshold, analysts speculate it could rally towards the $2,000 mark by April.

Conversely, some analysts, including Crypto Fella, warn of the risks associated with Ethereum’s current stagnation. The importance of a swift upward movement; a failure to break through the nearest resistance could result in a drop towards $1,200, highlighting the precarious nature of the altcoin’s current position.
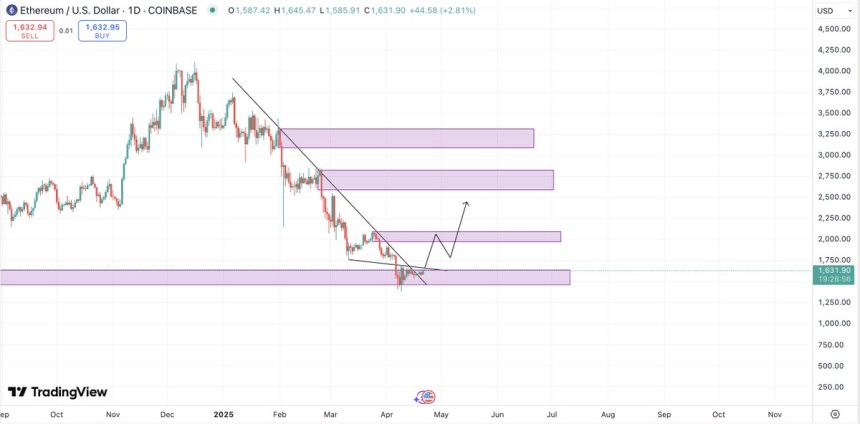
Ethereum

Bitcoin Surges Past $87,000

In stark contrast, Bitcoin’s market performance paints a different picture. The cryptocurrency’s recent surge above $87,000 is interpreted by Nicholas Roberts-Huntley, CEO of Concrete and Glow Finance, as a clear indication that investors are seeking refuge in decentralized assets amidst rising tariffs, inflation concerns, and global economic uncertainty. 

This sentiment is echoed as the crypto market reacts to political tensions, particularly surrounding President Trump’s threats to remove Federal Reserve Chair Jerome Powell for not expediting interest rate cuts. 

Youwei Yang, chief economist at Bitcoin mining company BIT Mining, provided further context on Bitcoin’s behavior in the current economic climate. 

Yang noted that while Bitcoin may initially respond like a risk asset—similar to tech stocks—during times of crisis, it tends to stabilize and exhibit characteristics of a safe haven asset akin to gold as market conditions improve.

Ethereum

At the time of writing, ETH is trading at $1,584, posting losses of over 3% in the weekly time frame. Even more concerning, the altcoin is still down nearly 70% from its all-time high reached in the last bullish cycle.

Featured image from DALL-E, chart from TradingView.com 

Disclaimer: For information purposes only. Past performance is not indicative of future results.
placeholder
Nvidia reports tomorrow with an interim CEO — $108 billion is the easy numberNvidia closed at 162.85 on Friday, down 12.75% on the week and 32% below its 6 October record, with market value down to $3.92 trillion. The Q3 bar is $108 billion ±2%, and consensus already sits at $108.7 ~ 108.8 billion, so the revenue line is not where the surprise lives. The number that decides the reaction is the 71 ~ 72% Q4 gross-margin trough, followed by a Q4 guide against a $124.9 billion consensus. This piece prices the print, marks the 158.39 line and lays out the three scenarios in a table.
Author  Irene Q.
Yesterday 02: 11
Nvidia closed at 162.85 on Friday, down 12.75% on the week and 32% below its 6 October record, with market value down to $3.92 trillion. The Q3 bar is $108 billion ±2%, and consensus already sits at $108.7 ~ 108.8 billion, so the revenue line is not where the surprise lives. The number that decides the reaction is the 71 ~ 72% Q4 gross-margin trough, followed by a Q4 guide against a $124.9 billion consensus. This piece prices the print, marks the 158.39 line and lays out the three scenarios in a table.
placeholder
Anthropic is six times oversubscribed at $1.4 trillion while Nvidia is down 32% — the AI trade has two pricesAnthropic lists on Nasdaq as ANT on Thursday at $70 ~ $78 a share, raising up to $64.4 billion at a target valuation near $1.4 trillion, and the book is reportedly six times covered. In the same six weeks, Nvidia has fallen 32% and the QQQ is 10.9% below its October peak. Private capital and public markets are marking the same AI complex at two very different prices. This piece separates the two books: what the S-1 shows, who is anchoring the $26 billion private placement, and what Thursday's debut would have to do to change the public tape.
Author  Irene Q.
Yesterday 02: 27
Anthropic lists on Nasdaq as ANT on Thursday at $70 ~ $78 a share, raising up to $64.4 billion at a target valuation near $1.4 trillion, and the book is reportedly six times covered. In the same six weeks, Nvidia has fallen 32% and the QQQ is 10.9% below its October peak. Private capital and public markets are marking the same AI complex at two very different prices. This piece separates the two books: what the S-1 shows, who is anchoring the $26 billion private placement, and what Thursday's debut would have to do to change the public tape.
placeholder
Weekly Report: The index rose 2.5% while Nvidia fell 12.7% — two equity divergences, one should closeThe S&P 500 rose 2.51% to 7,561.67 and the QQQ rose 3.63% to 679.89 last week, while Nvidia fell 12.75% to 162.85 — a sixth straight weekly loss and 32% below its October record. In the same five sessions, energy equities rose 5.42% while WTI fell 2.52%. Both pairs normally move together (60-day correlations of +0.64 and +0.58). This report ranks which divergence closes first, with the trigger for each.
Author  Irene Q.
Yesterday 02: 35
The S&P 500 rose 2.51% to 7,561.67 and the QQQ rose 3.63% to 679.89 last week, while Nvidia fell 12.75% to 162.85 — a sixth straight weekly loss and 32% below its October record. In the same five sessions, energy equities rose 5.42% while WTI fell 2.52%. Both pairs normally move together (60-day correlations of +0.64 and +0.58). This report ranks which divergence closes first, with the trigger for each.
placeholder
Gold Price Analysis Today | Forex Gold Analysis | XAU/USD Analysis - November 16, 2026Get the latest gold price analysis, forex gold insights, and XAU/USD analysis for November 16, 2026. Read on for the details.
Author  Mitrade
23 hours ago
Get the latest gold price analysis, forex gold insights, and XAU/USD analysis for November 16, 2026. Read on for the details.
placeholder
Weekly Report: DXY 103.41, 10-year 5.15%, AUD carry 3bp — three FX regimes flipped in one weekThe dollar index rose 1.09% to 103.41, a 19-month high, while the US 10-year closed at 5.154% and the Australia-US two-year spread collapsed to about 3 basis points from 36. EURUSD fell 1.59% to 1.1024, USDJPY rose 1.51% to 159.78 and AUDUSD fell 1.79% to 0.6764, a 10-month low. Three FX regimes — the broad dollar, the US rate level and the Australian carry premium — flipped in the same week. This report marks the thresholds, ranks which one can flip back first, and lists the week's calendar.
Author  Irene Q.
23 hours ago
The dollar index rose 1.09% to 103.41, a 19-month high, while the US 10-year closed at 5.154% and the Australia-US two-year spread collapsed to about 3 basis points from 36. EURUSD fell 1.59% to 1.1024, USDJPY rose 1.51% to 159.78 and AUDUSD fell 1.79% to 0.6764, a 10-month low. Three FX regimes — the broad dollar, the US rate level and the Australian carry premium — flipped in the same week. This report marks the thresholds, ranks which one can flip back first, and lists the week's calendar.
goTop
quote