


Bitcoin Enters New Phase: Analyst Predicts Positive Movement In 2025
According to a recent CryptoQuant Quicktake post, Bitcoin (BTC) may be close to completing its price correction for the current market cycle. The premier cryptocurrency appears primed for positive movement in 2025, despite lingering macroeconomic uncertainty.
Bitcoin Looks Ready To Reverse Trend
In a Quicktake post, CryptoQuant contributor Crypto Dan highlighted that BTC is currently undergoing a correction phase similar to the one observed in 2024. The analyst noted that the amount of BTC held for less than one week to one month can serve as an indicator of how “overheated” the crypto market is.
For context, in markets with high speculative activity – such as crypto – price pullbacks tend to be significant. In contrast, markets with lower speculation, like gold, typically experience shallower corrections.
Crypto Dan shared the following chart showing three major phases of the crypto market – a market rally (red arrow), an increase in the ratio of BTC held for less than one week to one month (green pattern), and a subsequent correction (yellow arrow).
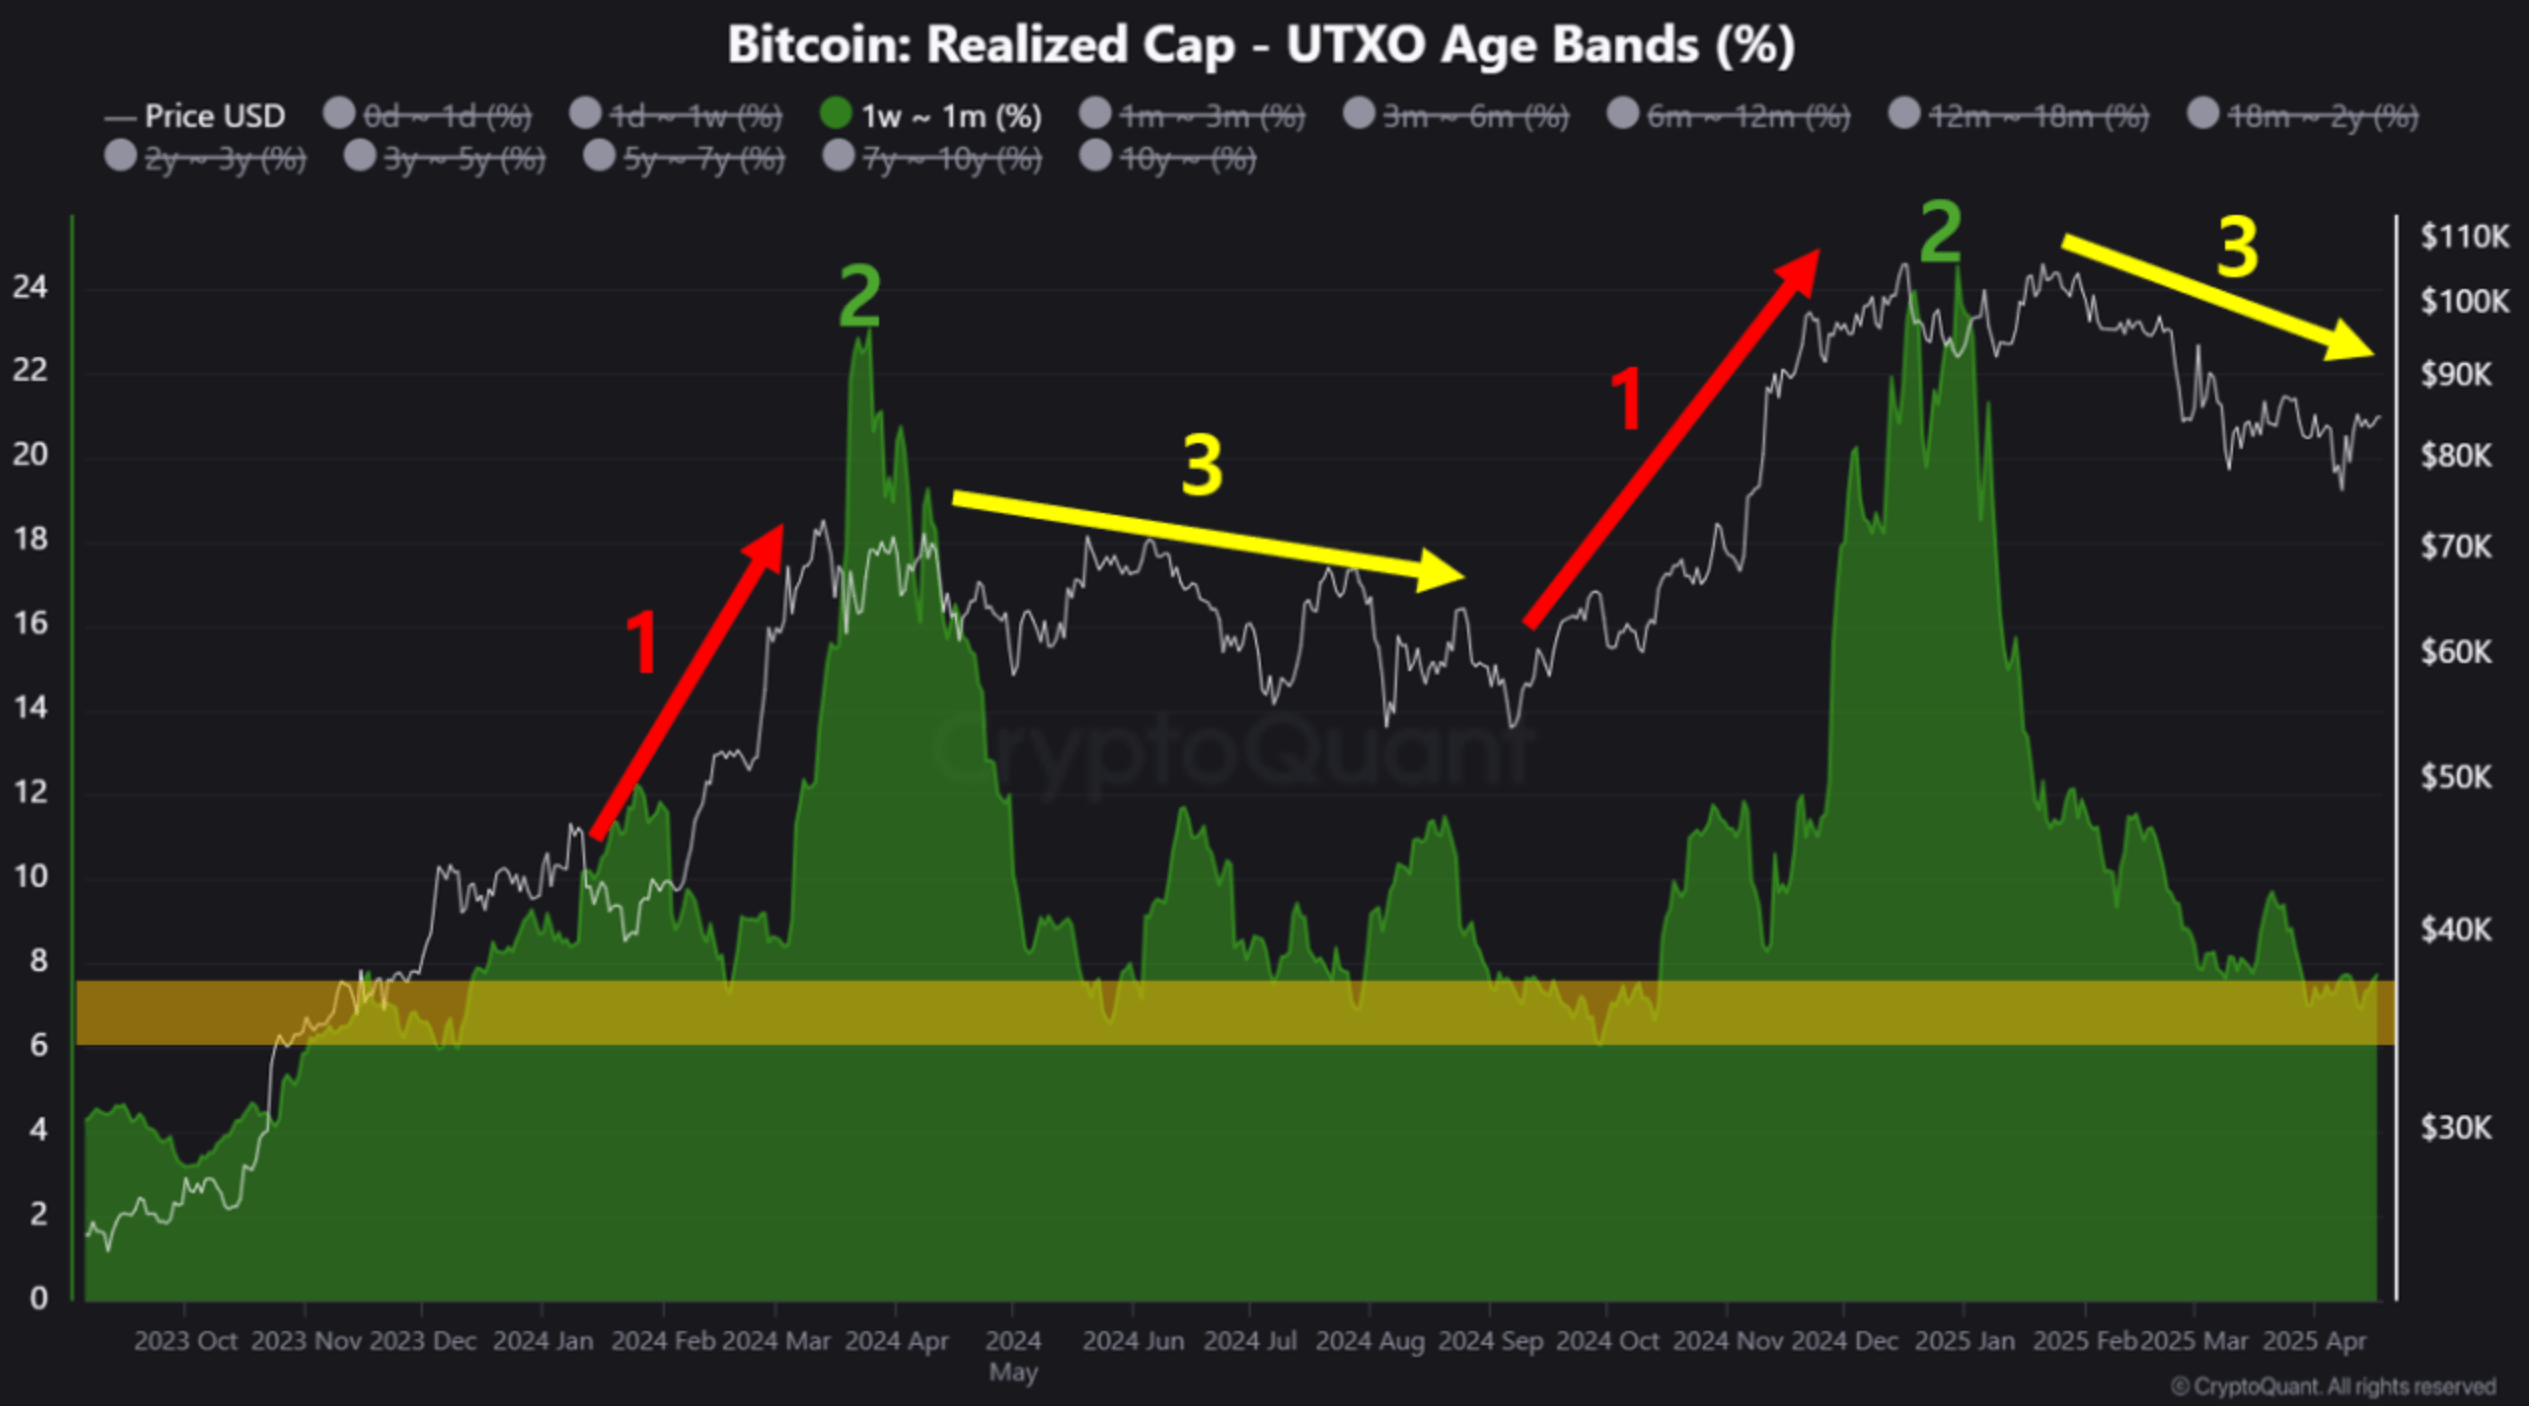
He explained that this pattern has played out twice during the current bull market, with both instances showing similarly elevated levels of short-term BTC holdings, suggesting a comparable degree of market overheating.
This ratio has now reached a cycle low, highlighted in the yellow-box region of the chart. Notably, this same region also marked the bottom of the 2024 market cycle.
If the pattern mirrors its behaviour from 2024, it could indicate that the current cycle has also bottomed out. Crypto Dan explained:
In other words, the overheating is now resolved, and although we may need to wait a little longer, with the progress of macroeconomic issues, 2025 is likely to show a positive movement.
Adding to the optimism, a separate post on X by crypto analyst Titan of Crypto also points to a possible shift in momentum. The analyst noted that BTC recently formed a golden cross on the daily chart – a bullish signal that often suggests a trend reversal is underway.
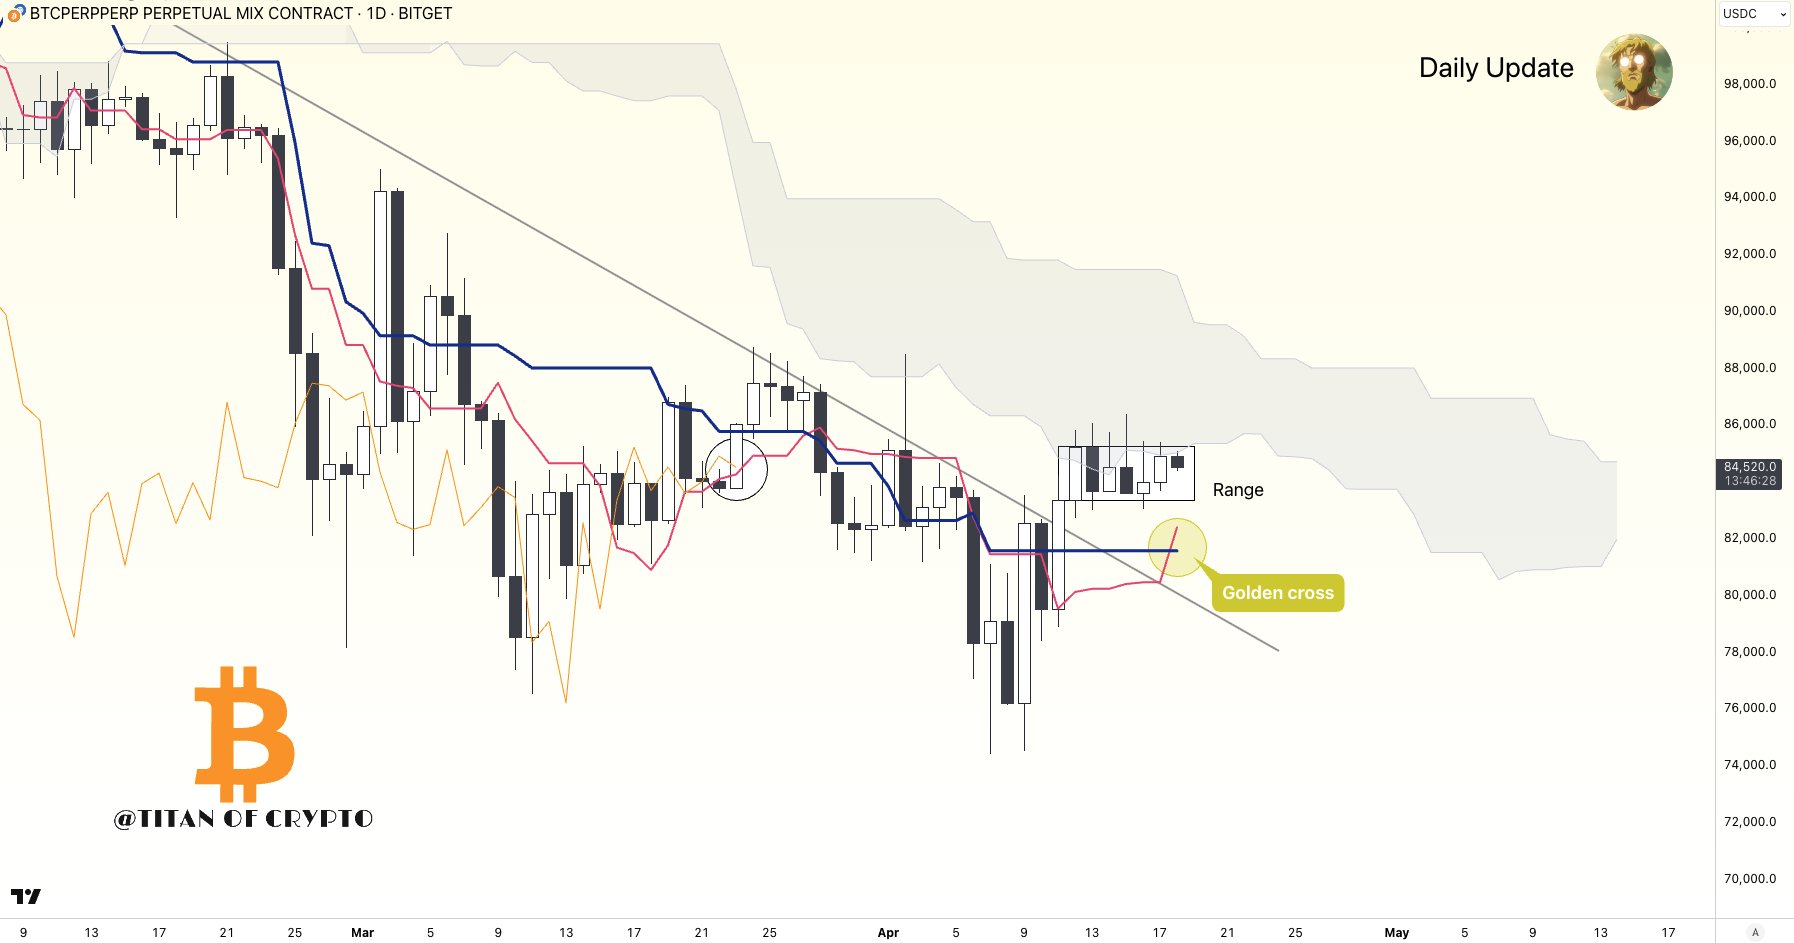
For the uninitiated, a golden cross occurs when Bitcoin’s 50-day moving average crosses above its 200-day moving average, signalling a potential long-term bullish trend. It’s widely seen as a buy signal by traders, indicating growing upward momentum.
BTC Futures Sentiment Index Signals Caution
Despite these bullish signals, not all analysts are convinced. Fellow CryptoQuant contributor abramchart recently observed that BTC’s futures sentiment index has continued to decline since February, suggesting a more cautious outlook among derivatives traders.
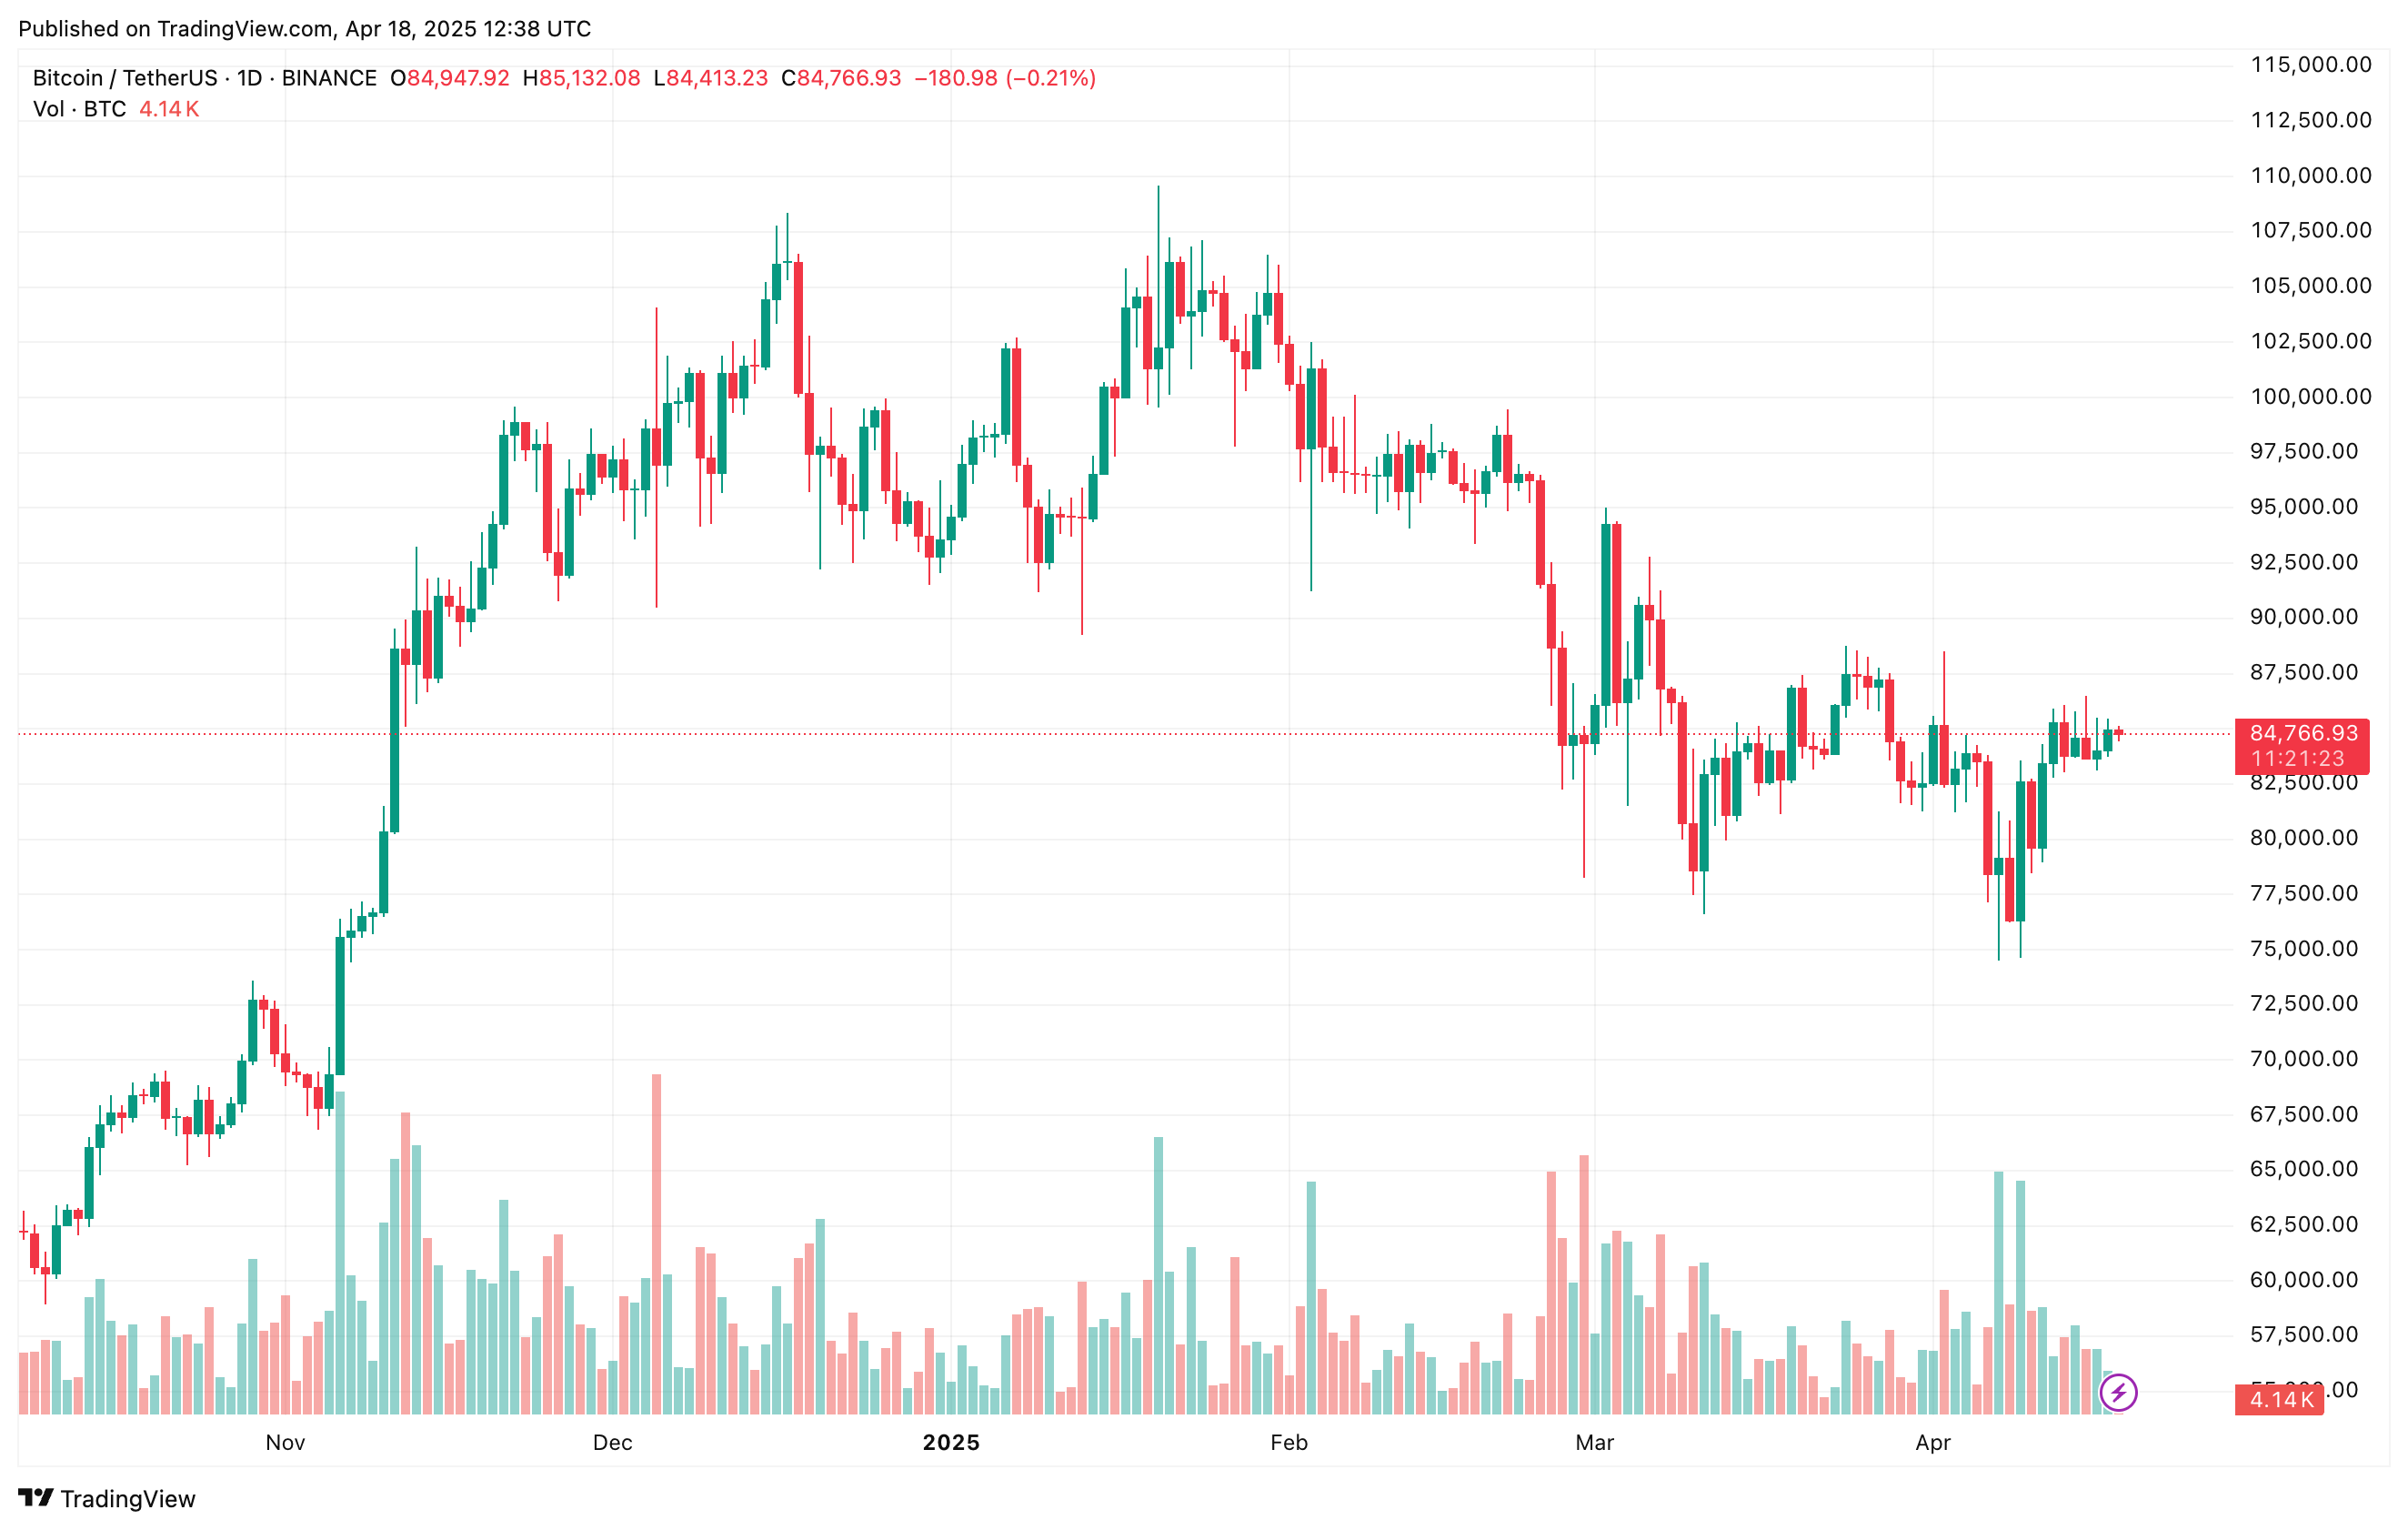
Adding to the leading digital asset’s woes, a recent report suggested that China may be preparing to sell a large amount of confiscated BTC, which may increase selling pressure and potentially suppress prices in the short term. At press time, BTC trades at $84,766, down 0.1% in the past 24 hours.
Recommended Articles


