

Solana (SOL) Jumps 20% In a Week With DEX Volume and Protocol Fees Soaring
Solana (SOL) is up 20% over the past seven days, supported by strong technical indicators and rising on-chain activity. Its Ichimoku Cloud and BBTrend charts both point to bullish momentum, with trend strength and volatility on the rise.
At the same time, Solana is reclaiming the top spot in DEX volume and dominating protocol fee rankings across major DeFi apps. With a recent golden cross on the EMA lines, SOL now looks set to test key resistance levels if momentum holds.
Solana Indicators Paint A Bullish Picture
Solana Ichimoku Cloud chart shows a clear bullish structure, with price trading above both the Tenkan-sen and Kijun-sen. This alignment indicates strong short- and medium-term momentum, with buyers maintaining control.
The Kumo ahead is green and steadily expanding, which supports the continuation of the current uptrend. The distance between the price and the cloud also gives the trend some room before any potential weakness sets in.
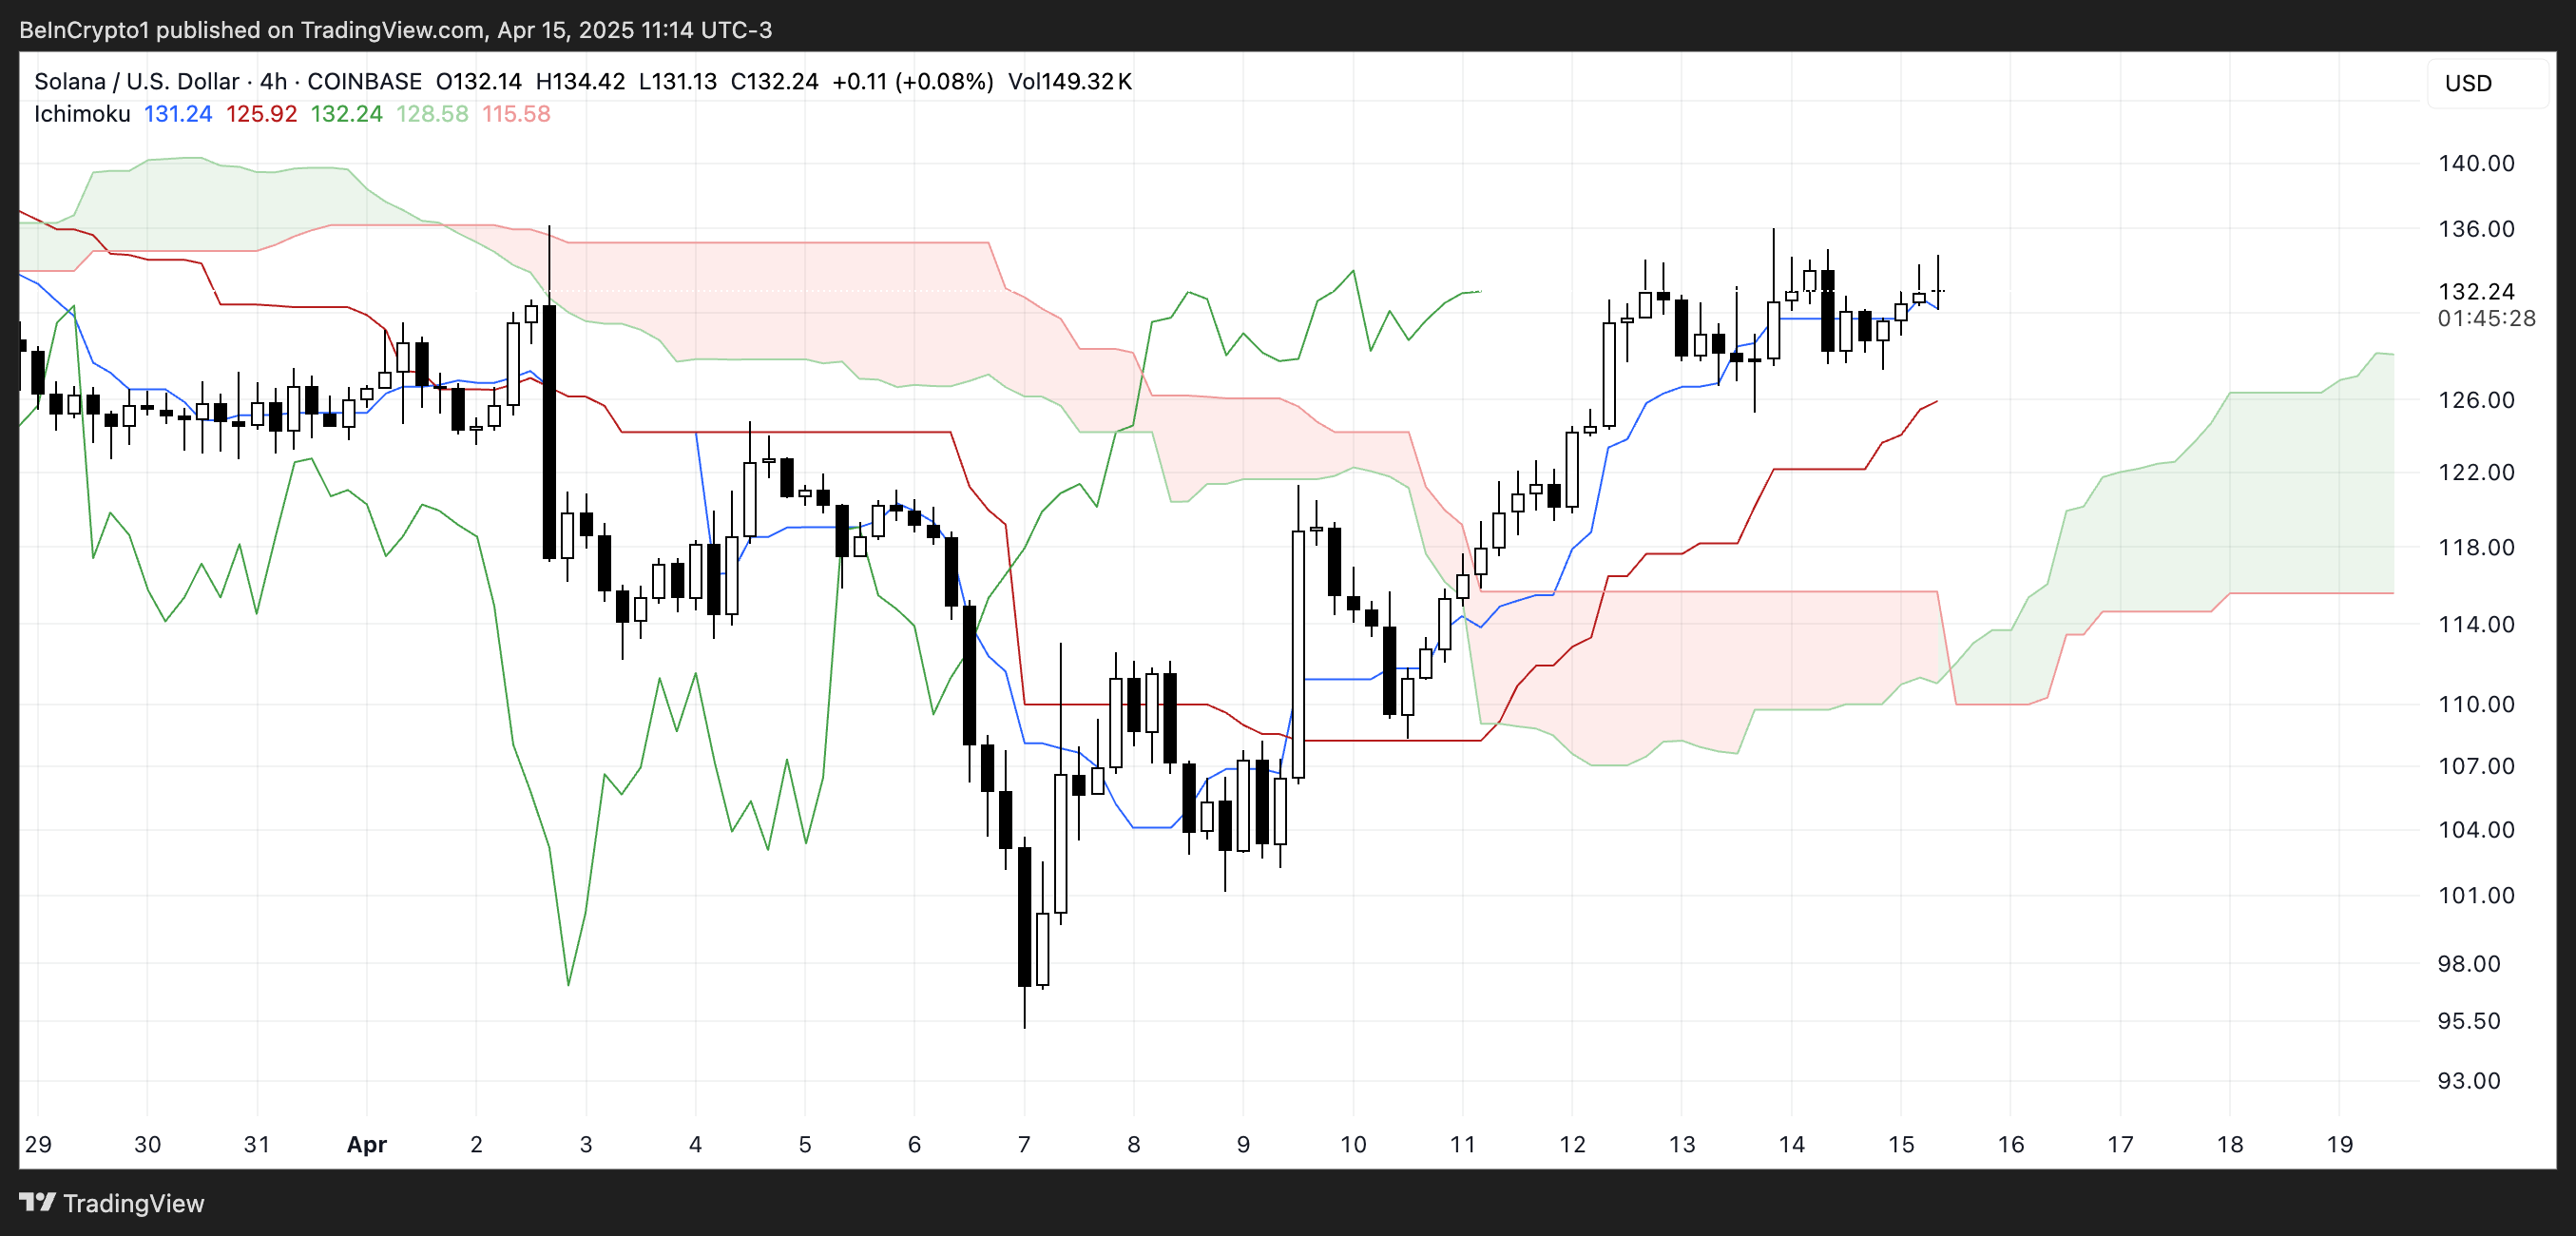 SOL Ichimoku Cloud. Source: TradingView.
The Chikou Span is positioned above the cloud and candles, confirming bullish confirmation from past price action. As long as Solana stays above the Kijun-sen and the cloud remains supportive, the trend bias remains upward.
Solana’s BBTrend is currently at 16.89, showing a strong increase from 1.88 two days ago, though slightly down from 17.54 yesterday. This sharp rise indicates that volatility and trend strength have recently expanded significantly.
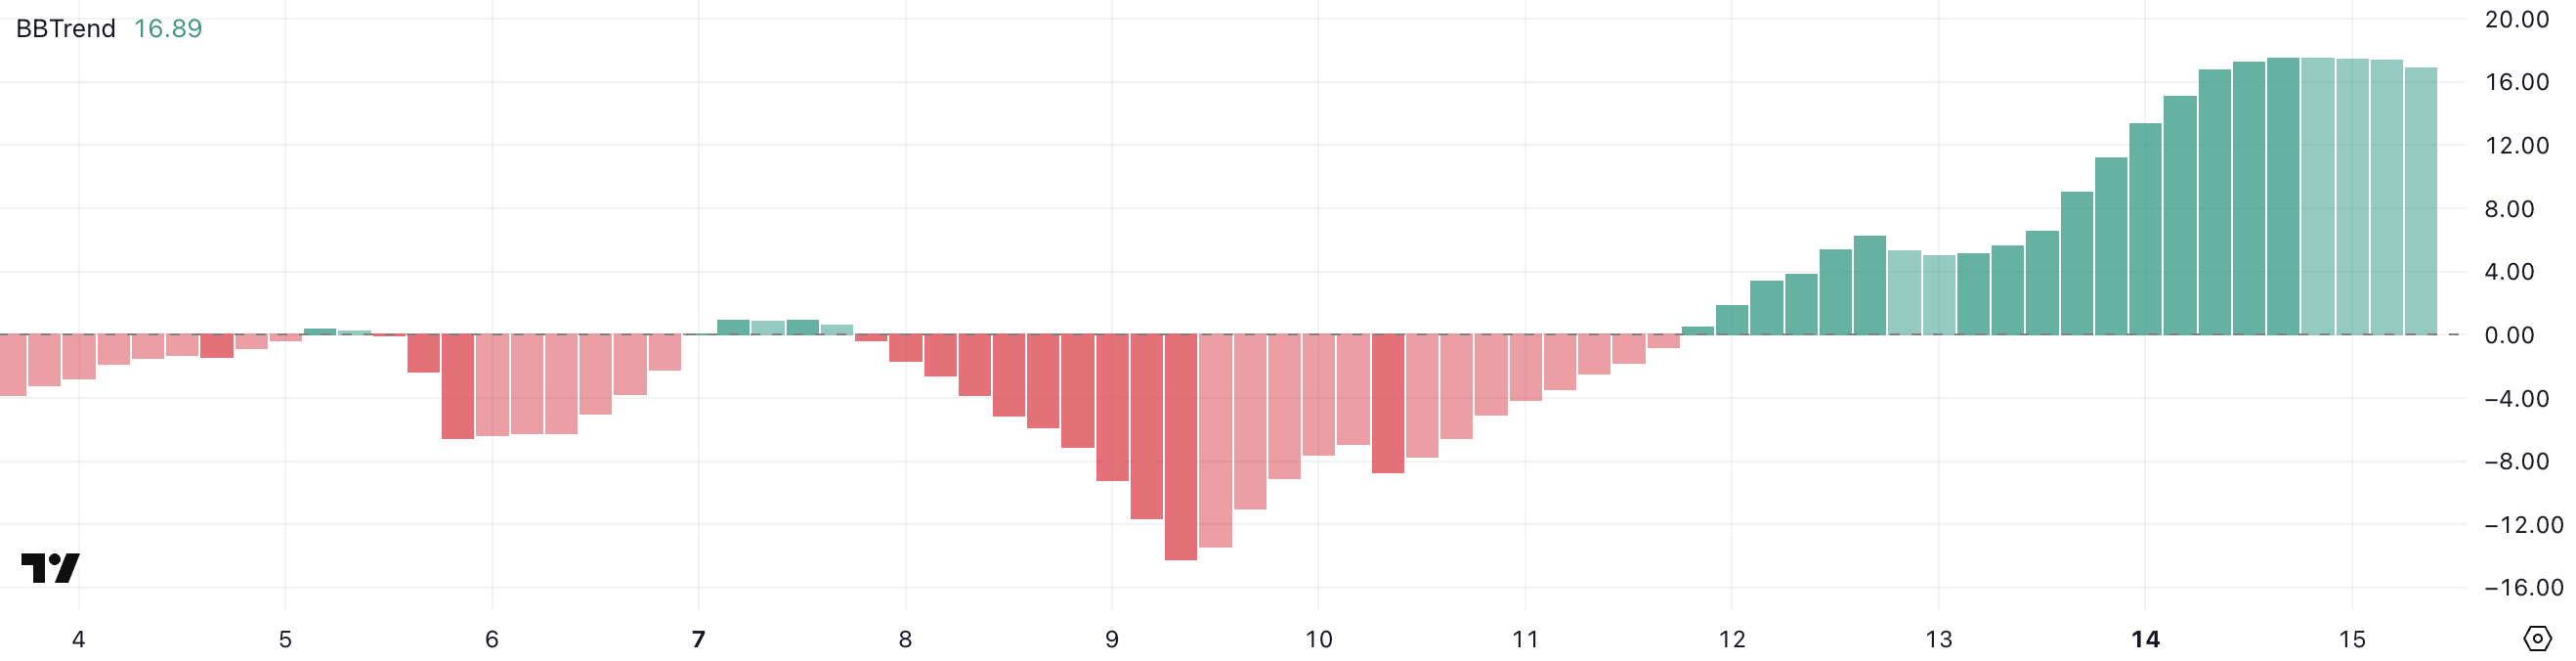 SOL BBTrend. Source: TradingView.
The BBTrend, or Bollinger Band Trend indicator, measures the strength of a trend based on how far price moves away from its average range. Readings above 10 generally signal a strong trend in motion, while lower values reflect a range-bound or weak market.
With SOL’s BBTrend holding near elevated levels, it suggests the asset is still in a strong trending phase. If it remains high or rises again, it could support further upward movement—but a steady decline might hint at a slowing trend or consolidation ahead.
SOL Volumes and Apps Are On The Rise
Solana is firmly reestablishing its dominance in the decentralized exchange (DEX) space, pulling ahead of Ethereum and BNB in daily volume.
Over the past 24 hours, Solana recorded $2.5 billion in DEX activity, marking a 14% increase over the last seven days. That growth outpaces Base’s 10% and contrasts sharply with the declines seen on Ethereum (-3%) and BNB (-9%).
 DEX Volume by Chain. Source: DeFiLlama.
More impressively, Solana’s seven-day DEX volume has surpassed the combined volume of Base, BNB, and Arbitrum.
 Protocols and Chains Fees. Source: DeFiLlama.
Beyond trading volume, Solana is also leading in protocol revenue generation. Among the top eight non-stablecoin protocols ranked by fees, five are directly built on Solana: Pump, Axiom, Jupiter, Jito, and Meteora.
Pump stands out in particular, generating $2.73 million in fees in just the past 24 hours and $15 million across the past week.
Can Solana Break Above $150 In The Next Weeks?
Solana’s EMA lines recently formed a golden cross, a bullish signal that often marks the start of a new uptrend.
This crossover suggests momentum is shifting in favor of buyers, with the potential for Solana price to soon test key resistance levels.
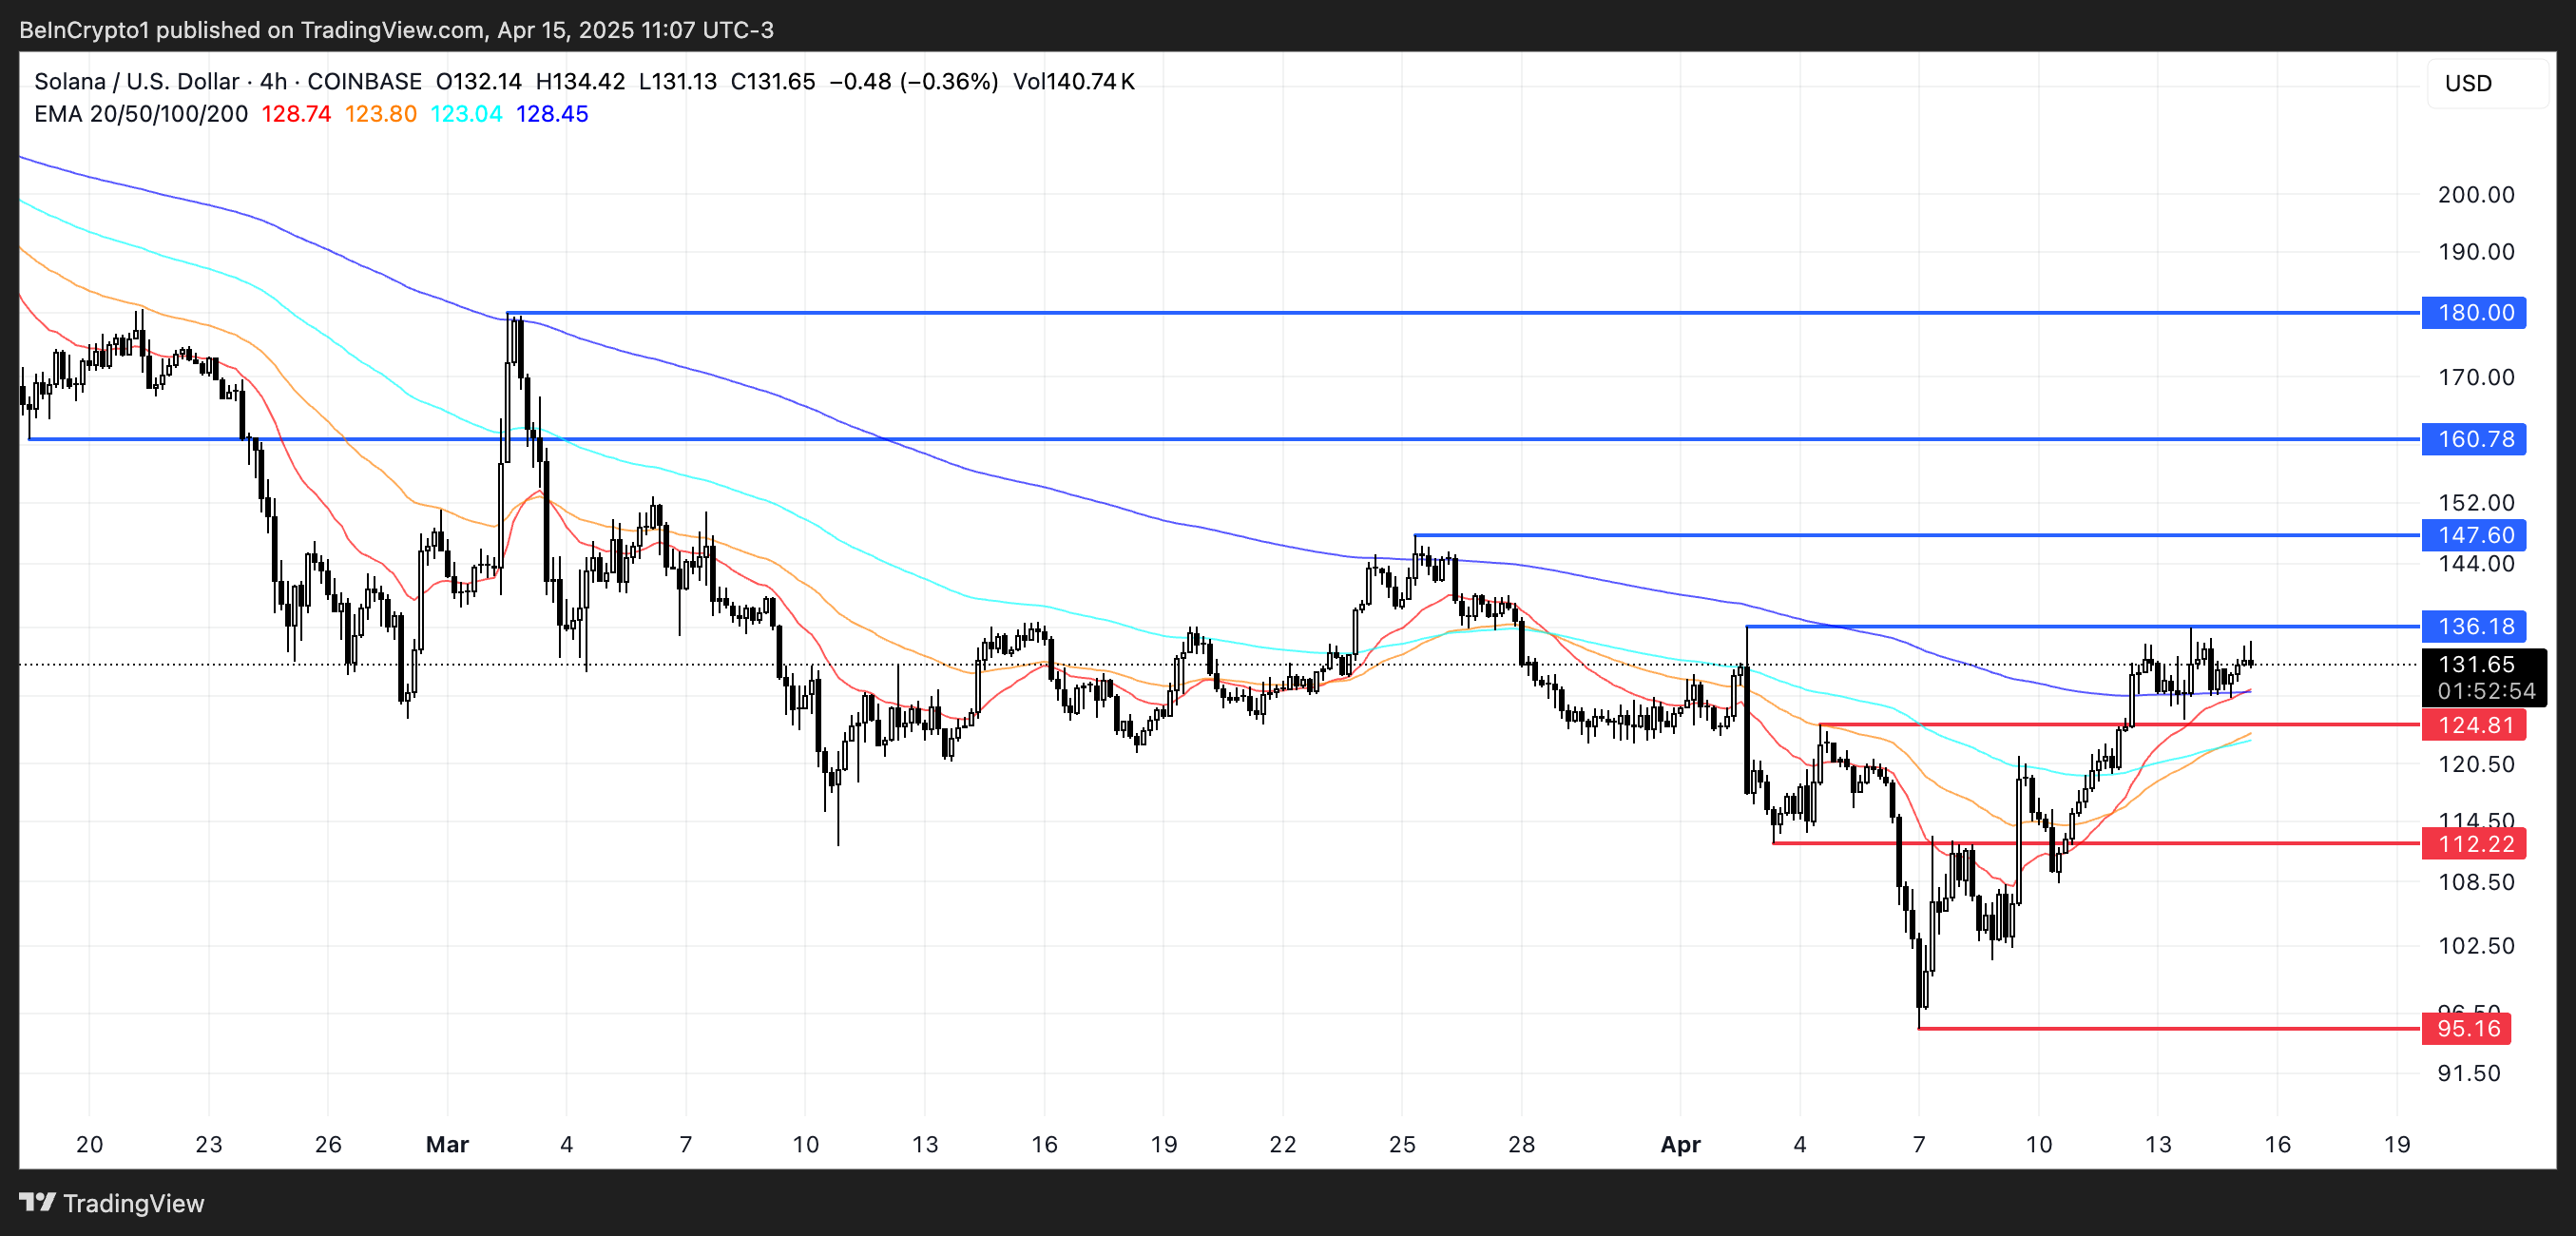 SOL Price Analysis. Source: TradingView.
If the current trend holds, Solana could challenge resistance around the $136 zone. A breakout there may open the path toward higher levels such as $147, $160, and even $180 if bullish pressure intensifies.
However, if momentum fades, Solana may face a pullback toward the $124 support zone. A break below that could trigger deeper downside moves, potentially revisiting $112 or even $95 if selling pressure accelerates.
Recommended Articles


