


Cronos (CRO) Surges 7% To Become The Top Altcoin Gainer Of The Day
Cronos (CRO) has been gaining serious momentum in recent weeks after Trump Media announced a partnership with Crypto.com. The news helped drive CRO’s price above the $0.10 mark for the first time since early February, triggering a wave of bullish technical signals.
Indicators like RSI, BBTrend, and EMA alignment all point toward strong upward momentum, with CRO even becoming the top-performing altcoin in the past 24 hours. As traders eye key resistance and support levels, the question now is whether this rally has enough fuel to carry CRO toward $0.20.
CRO RSI Is Back To Neutral After Reaching Its Highest Levels In Years
Cronos has captured market attention in recent weeks, especially following the announcement of a partnership between Trump Media and Crypto.com.
This surge in interest drove CRO’s Relative Strength Index (RSI) to a peak of 89.64 just three days ago—its highest level in over a year—signaling intense buying pressure.
Since then, the RSI has cooled down to 61.2, as the price consolidates after its strong rally. Despite the slight RSI drop, Cronos remains the top-performing altcoin in the past 24 hours, with a 7% price increase, showing that momentum is still in its favor.
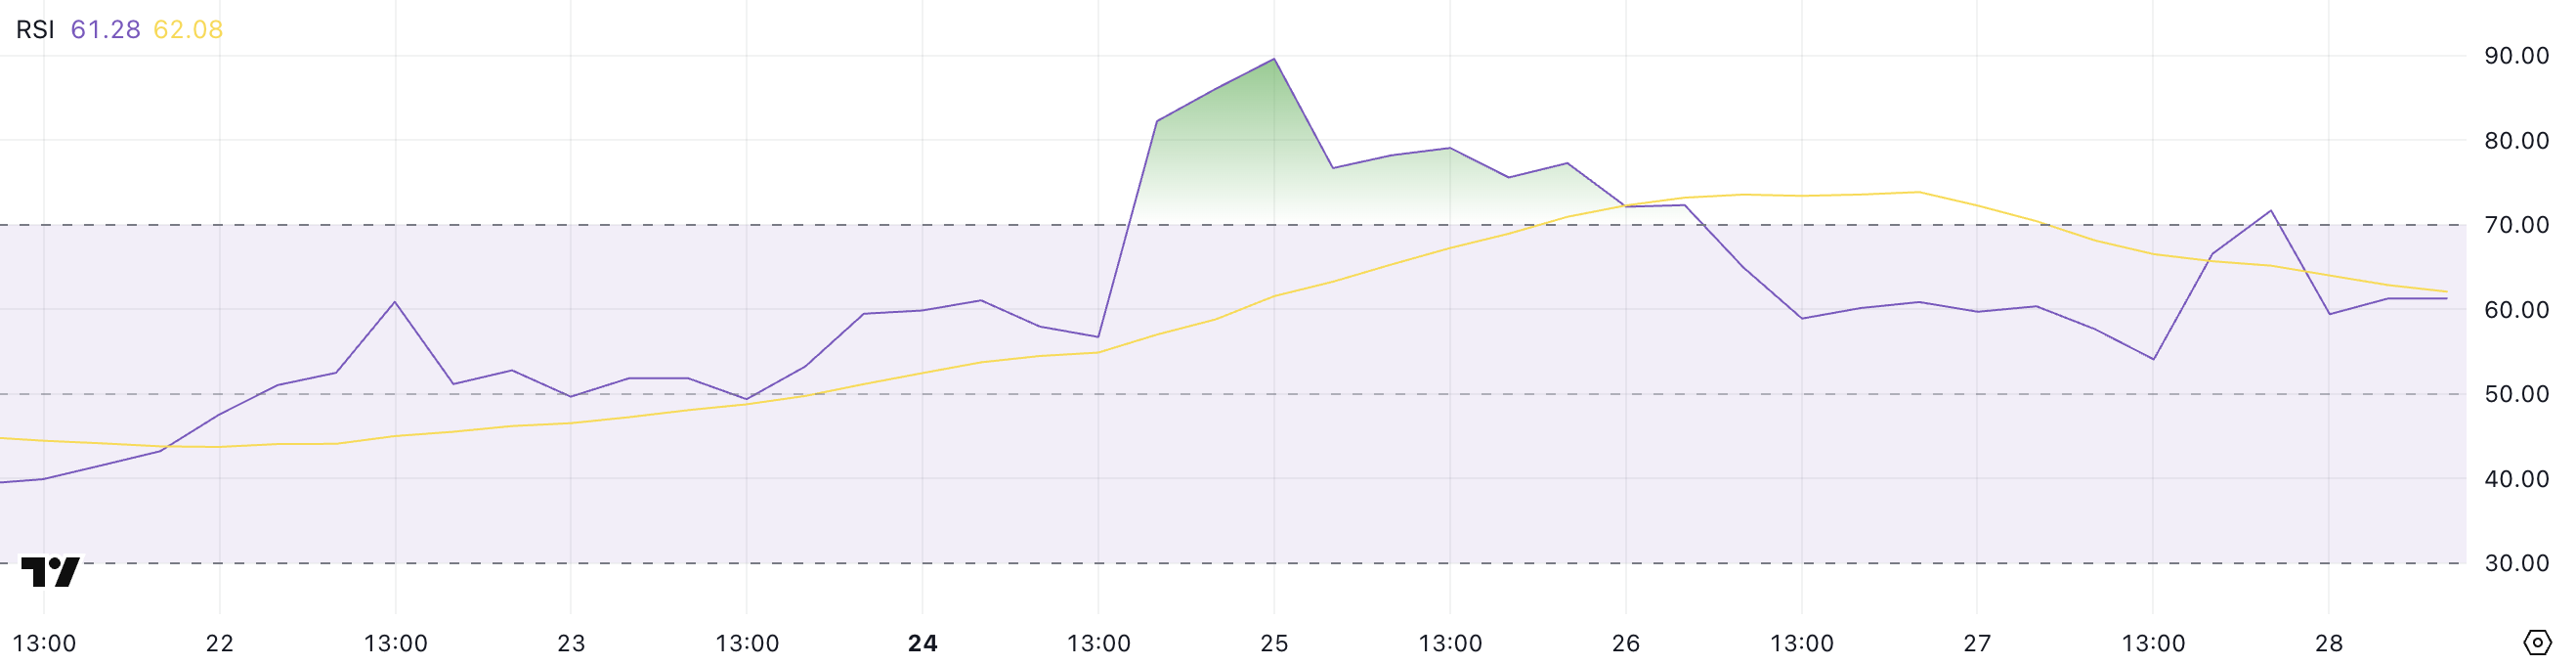 CRO RSI. Source: TradingView.
The RSI (Relative Strength Index) is a momentum indicator used to assess whether an asset is overbought or oversold. It ranges from 0 to 100, with levels above 70 typically suggesting overbought conditions, and levels below 30 indicating oversold territory.
With CRO’s RSI now at 61.2, the asset is no longer in an overbought state but still shows healthy bullish momentum. This suggests the price could continue climbing, especially if renewed interest or news catalysts emerge.
At the same time, the cooldown from extreme RSI levels may be giving the market room to build a more sustainable rally.
Cronos BBTrend Is Still Very Positive, But Down From The Recent Peak
Cronos has recently flipped its BBTrend indicator back into positive territory, currently sitting at 25.05—down slightly from a recent peak of 26.56 reached just yesterday.
This shift comes after five consecutive days of negative BBTrend values, suggesting a notable change in market momentum.
The move into positive territory indicates that bullish pressure has returned, aligning with the broader uptick in price and sentiment surrounding CRO following its recent surge in visibility and trading activity.
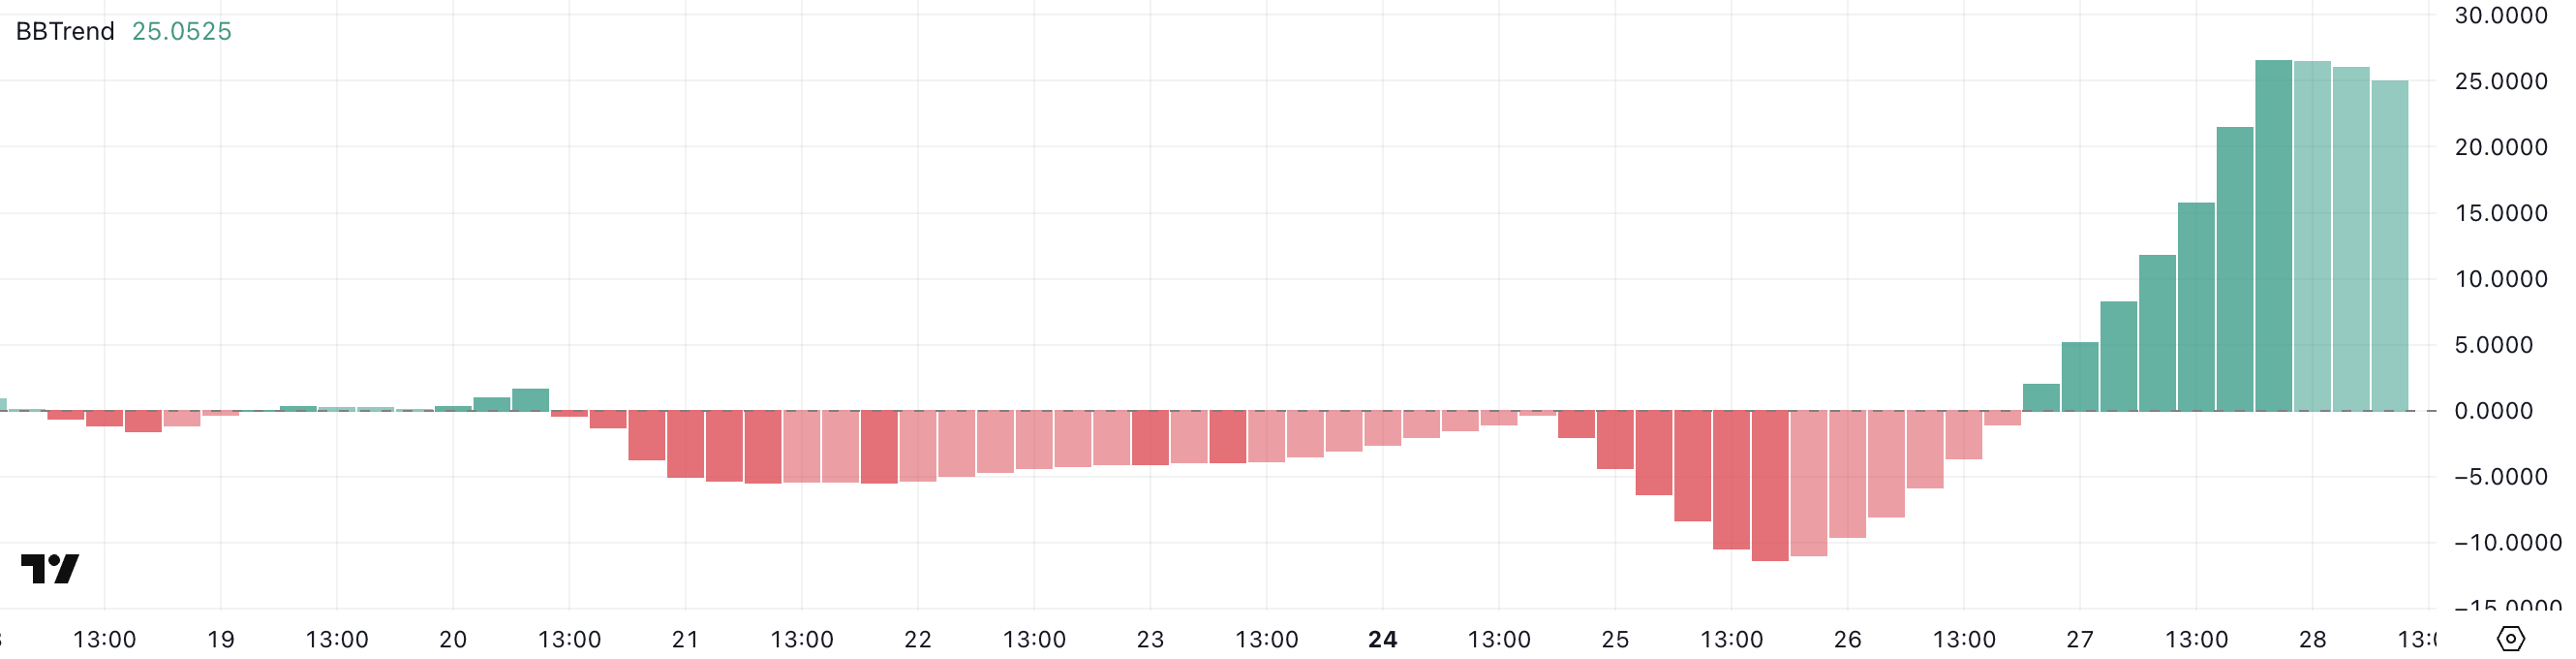 CRO BBTrend. Source: TradingView.
BBTrend, or Bollinger Band Trend, is a momentum indicator that helps identify whether an asset is trending upwards, downwards, or moving sideways.
A positive BBTrend value generally indicates bullish momentum, while a negative value points to bearish sentiment. The higher the value, the stronger the trend.
With CRO’s BBTrend at 25.05, the asset is showing strong bullish momentum, though the slight drop from yesterday’s peak could signal early signs of a cooldown or brief consolidation.
However, as long as the BBTrend stays above zero, the upward bias remains intact, supporting the possibility of further CRO price appreciation.
Can Cronos Rise 100% In The Next Weeks?
Cronos price recently climbed above the $0.10 mark for the first time since early February.
The EMA (Exponential Moving Average) indicators are painting a bullish picture, with short-term EMAs positioned above the long-term ones and maintaining a healthy distance between them—often a sign of strong upward momentum.
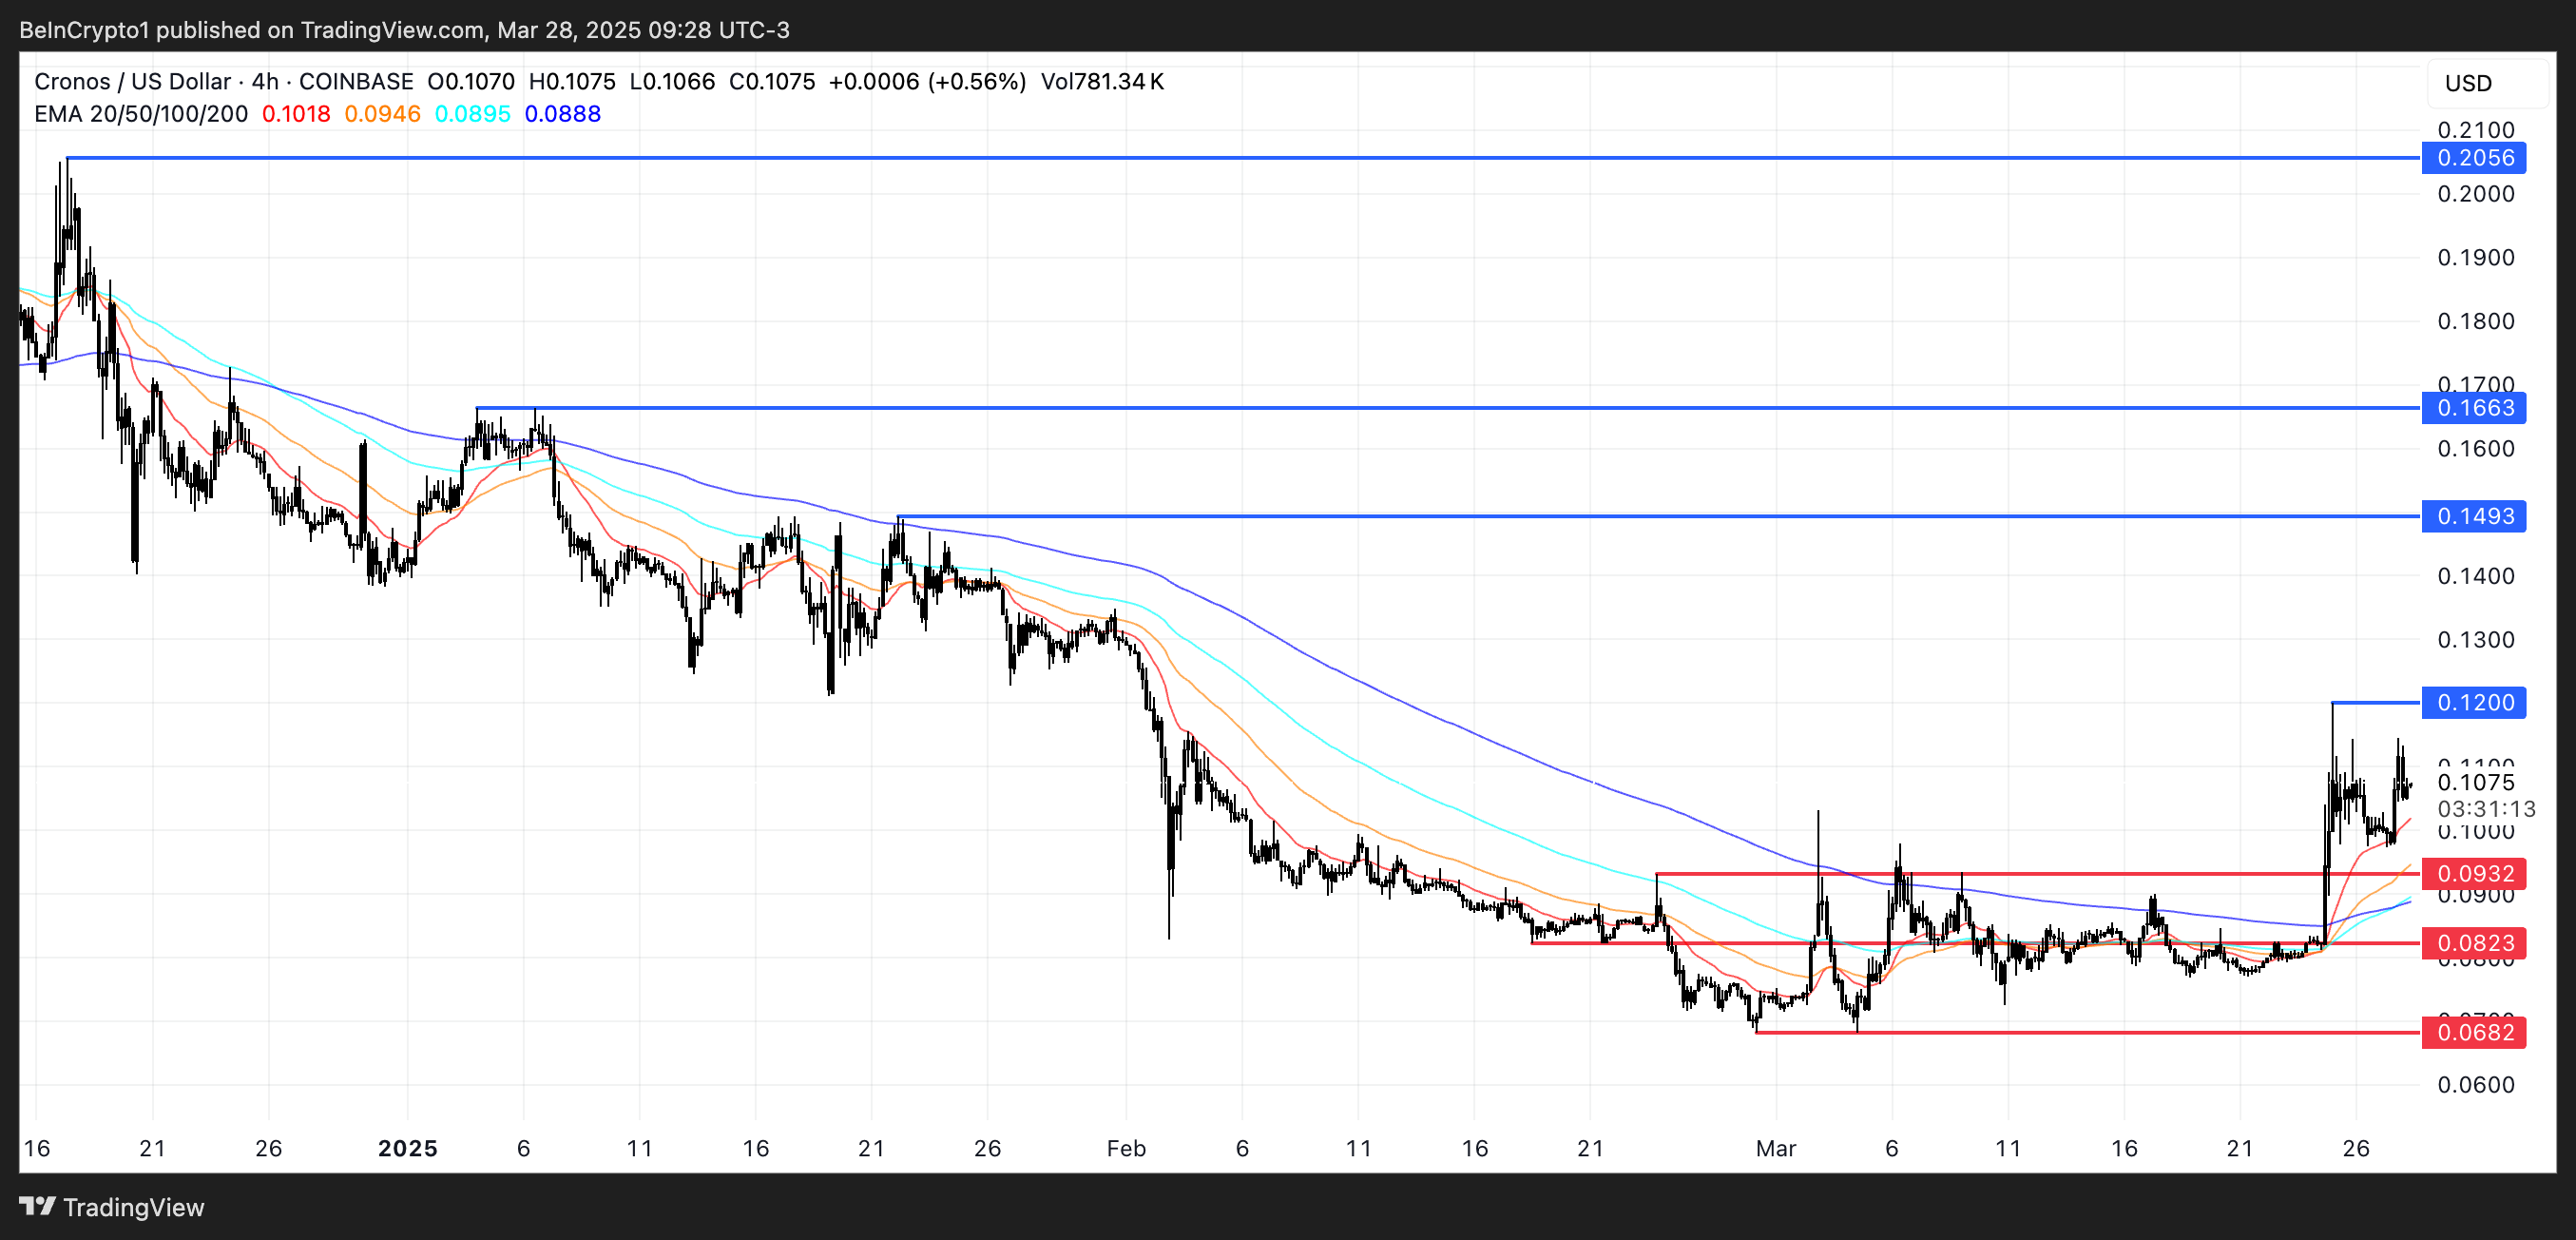 CRO Price Analysis. Source: TradingView.
If this trend holds, CRO could target the next resistance levels at $0.12, followed by $0.149 and $0.166.
In the case of a particularly strong rally, a move toward $0.20 is on the table. This would mark its highest price since the end of 2024, as conversations about a potential CRO ETF could gain more traction soon.
However, if bullish momentum starts to wane, CRO may pull back toward key support at $0.093. A break below that could accelerate the correction, with $0.082 and $0.068 as the next potential downside targets.
Recommended Articles


