

Analyst Unveils Extended XRP Price Target To $44, Reveals When To Take Profits

Source Newsbtc

Egrag Crypto, a prominent crypto market analyst on X (formerly Twitter), has unveiled new bullish projections for the XRP price, with an ambitious extended target of $44. The price forecast has sparked excitement among investors, especially as the analyst reveals the ideal time to take profits. 

XRP Price Next Bullish Targets Unveiled

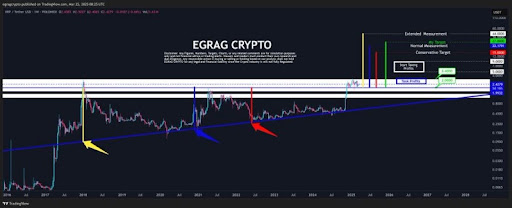
On March 25, Egrag Crypto shared an XRP price analysis, revealing several measured bullish targets for the cryptocurrency. The analyst predicted that his extended or long-term price target for XRP was $44, representing a massive 1,688% increase from its present market value. 

Egrag Crypto’s future price projections for XRP highlight a conservative target of $15, a normal measurement of $22, a personal target of $27, and an extended measurement of $44. While the extended bullish target represents the most ambitious scenario, considering XRP is still trading under $3, the analyst suggests that the cryptocurrency could first reach these intermediate levels before making a push toward $44.
XRP

Notably, the analyst has shared a chart, highlighting XRP’s support and resistance levels, and historic trendlines. The upward blue trendline represents a long-term rising support level at $1.99. Additionally, the white and black horizontal lines in the chart show that the XRP price recently broke above a key resistance zone, further reinforcing its bullish position. 

Egrag Crypto also cites XRP’s historical price action and trend lines as support for his projected bullish targets. The yellow arrow in the chart shows that in 2018, the cryptocurrency experienced a major price surge to its current ATH of $3.84. As highlighted by the blue arrow, another major price spike occurred in the last bull run in 2021.

Following this bull market trend, XRP is expected to rally again before the end of the bull cycle in Q4 2025. While this projected surge to $44 may seem rather ambitious, XRP has historically demonstrated the potential for exponential growth during bull cycles. Just this year, the cryptocurrency had surpassed expectations, jumping from $0.5 to $3 for the first time in almost 7 years. 

When Traders Can Take Profits

While the extended bullish measurement of $44 is an optimistic scenario for the XRP price, Egrag Crypto has advised investors to be strategic with their profit-taking approach. The analyst suggests that traders can consider securing profits as prices gradually go up rather than waiting for the highest possible price, which can be unpredictable. This strategy prioritizes risk management, guaranteeing some returns even if the price of the cryptocurrency later drops. 

Egrag Crypto’s XRP price chart shows that during the last rally, the analyst took profits early at $2.42 instead of waiting for a price peak. This time, he has identified the price point between $5 and $9 as a key zone where traders can start taking profits before XRP reaches its first conservative target of $15.

XRP
Disclaimer: For information purposes only. Past performance is not indicative of future results.
placeholder
Financial Markets 2026: Volatility Catalysts in Gold, Silver, Oil, and Blue-Chip Stocks—A CFD Trader's OutlookGet a comprehensive financial market 2026 outlook exploring key economic drivers, volatility catalysts in gold, oil and stocks, and what the evolving economic outlook means for cfd trading strategies and risk management on global markets.
Author  Rachel Weiss
May 15, Fri
Get a comprehensive financial market 2026 outlook exploring key economic drivers, volatility catalysts in gold, oil and stocks, and what the evolving economic outlook means for cfd trading strategies and risk management on global markets.
placeholder
Japanese Yen rallies to February 18 high as upbeat wage data and GDP lift BoJ hike betsThe USD/JPY pair declines for the second straight day – also marking the fourth day of a fall in the previous five – and sinks to its lowest level since February 18, around mid-153.00s during the Asian session on Tuesday.
Author  FXStreet
Sep 08, Tue
The USD/JPY pair declines for the second straight day – also marking the fourth day of a fall in the previous five – and sinks to its lowest level since February 18, around mid-153.00s during the Asian session on Tuesday.
placeholder
Gold slumps to near $4,350 amid oil-driven inflation fears, US inflation data in focusGold price (XAU/USD) falls to near $4,350 during the early Asian session on Wednesday. The precious metal faces some selling pressure as rising oil prices fueled inflation ‌concerns and boosted expectations for a rate hike by the Federal Reserve (Fed) in September.
Author  FXStreet
Sep 09, Wed
Gold price (XAU/USD) falls to near $4,350 during the early Asian session on Wednesday. The precious metal faces some selling pressure as rising oil prices fueled inflation ‌concerns and boosted expectations for a rate hike by the Federal Reserve (Fed) in September.
placeholder
Brent holds above $100 as tanker attacks tighten supply — but four forces are capping the rallyBrent crude is holding above $100 a barrel for a second session, its first close above the level since late July, as tanker attacks near the Strait of Hormuz squeeze an already tight physical market. Yet the rally has been gradual: 8.3 mb/d of Gulf output is still shut in, diesel is at a record, and forecasts now range from $74 to $100.
Author  Irene Q.
Yesterday 07: 34
Brent crude is holding above $100 a barrel for a second session, its first close above the level since late July, as tanker attacks near the Strait of Hormuz squeeze an already tight physical market. Yet the rally has been gradual: 8.3 mb/d of Gulf output is still shut in, diesel is at a record, and forecasts now range from $74 to $100.
placeholder
US August CPI lands tonight: after a 5.4% PPI shock, will the Fed hike on September 16?US August PPI came in at 5.4% year-on-year, above the 5.3% consensus, with core PPI at 4.6%. Traders have pushed the odds of a 25bp Fed hike on September 15-16 to around 70%. Tonight's CPI is the last major inflation print before the decision — here is the full calendar, the consensus numbers, and what a hot versus cool reading would mean for the dollar, yields, gold and stocks.
Author  Irene Q.
8 hours ago
US August PPI came in at 5.4% year-on-year, above the 5.3% consensus, with core PPI at 4.6%. Traders have pushed the odds of a 25bp Fed hike on September 15-16 to around 70%. Tonight's CPI is the last major inflation print before the decision — here is the full calendar, the consensus numbers, and what a hot versus cool reading would mean for the dollar, yields, gold and stocks.
goTop
quote