

Analyst Sets Dogecoin Next Target As Ascending Triangle Forms

Source Newsbtc

Crypto analyst CobraVanguard has revealed the next price target for Dogecoin as an ascending triangle forms for the foremost meme coin. A rally to this price target could pave the way for the new highs, especially with the crypto market looking to be in rebound mode. 

Next Target For Dogecoin As Ascending Triangle Forms

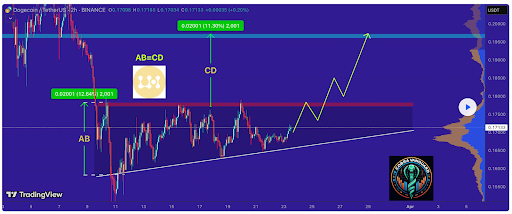
In a TradingView post, CobraVanguard set $0.197 as the next target for the Dogecoin price with an ascending triangle forming. He noted that this ascending triangle indicates a potential price increase. The analyst added that it is anticipated that the price could rise, aligning with the projected price movement of AB=CD.

Meanwhile, CobraVanguard warned that it is crucial to wait for the triangle to break before taking any action. His accompanying chart showed that Dogecoin needs to break above $0.177 to confirm a break above the ascending triangle. A break above that target would then lead to a rally to the $0.197 target. 
Dogecoin

Dogecoin already looks to be in rebound mode at the moment, alongside Bitcoin, which is nearing the $90,000 mark again. The foremost meme coin is nearing the $0.177 target for a break above the ascending triangle. As crypto analyst Kevin Capital suggested, DOGE will likely rally as long as BTC is in bullish territory. 

Crypto traders are also betting on a Dogecoin rally to the upside. Crypto analyst Ali Martinez revealed that 76.26% of traders with open DOGE positions on Binance futures are leaning bullish. This is particularly bullish because Binance traders have a good track record of being right most of the time. In another X post, Martinez revealed that whales bought over 120 million DOGE last week, which is also bullish for the foremost meme coin. 

DOGE’s Market Structure Has Shifted

In an X post, crypto analyst Trader Tardigrade revealed that Dogecoin’s market structure has shifted. This came as he noted that Dogecoin is recovering from an ascending triangle, forming higher highs and higher lows from lower highs and lower lows.

Based on this, the analyst affirmed that Dogecoin had shifted the market structure from a downtrend to an uptrend on the hourly chart since it just formed the second higher high. His accompanying chart showed that DOGE is eyeing a rally to $0.177 as it continues to form higher highs. 

Martinez raised the possibility of the Dogecoin price rallying to as high as $4 or even $20 in the long term. He stated that if DOGE holds above the $0.16 support at the lower boundary of an ascending channel, history suggests that it could rebound toward the mid-range at $4 or upper range at around $20. 

At the time of writing, the Dogecoin price is trading at around $0.174, up over 3% in the last 24 hours, according to data from CoinMarketCap.

Dogecoin
Disclaimer: For information purposes only. Past performance is not indicative of future results.
placeholder
China's factories are pricing in 5.7%. Its shoppers are pricing in 0.7%.China's October PPI rose 5.7% year on year, the fastest since June 2022, while CPI slowed to 0.7% and core CPI to 0.8%. Input prices rose faster than factory-gate prices, squeezing mid-stream margins by roughly five percentage points. The Hang Seng fell 0.13% on a day the S&P 500 rose 2.35%, the only major market to sit out the risk-on session.
Author  Irene Q.
Nov 10, Tue
China's October PPI rose 5.7% year on year, the fastest since June 2022, while CPI slowed to 0.7% and core CPI to 0.8%. Input prices rose faster than factory-gate prices, squeezing mid-stream margins by roughly five percentage points. The Hang Seng fell 0.13% on a day the S&P 500 rose 2.35%, the only major market to sit out the risk-on session.
placeholder
Gold Price Analysis Today | Forex Gold Analysis | XAU/USD Analysis - November 11, 2026Get the latest gold price analysis, forex gold insights, and XAU/USD analysis for November 11, 2026. Read on for the details.
Author  Mitrade
Nov 11, Wed
Get the latest gold price analysis, forex gold insights, and XAU/USD analysis for November 11, 2026. Read on for the details.
placeholder
Bitcoin lost its 200-day average — but the exit started three sessions before the CPIBitcoin fell 2.5% to about $73,400 on 11 November, an 11-week low, breaking its 200-day moving average near $73,100. The 24-hour liquidation tally reached $632 to $705 million, roughly 82% of it longs. But spot ETF outflows began three sessions earlier and USDT's market cap has shrunk $6.6 billion in 60 days — the leveraged length left before the inflation print did. A double top at 81,890 and 81,080 leaves a measured target of 69,366.
Author  Suzie
Nov 11, Wed
Bitcoin fell 2.5% to about $73,400 on 11 November, an 11-week low, breaking its 200-day moving average near $73,100. The 24-hour liquidation tally reached $632 to $705 million, roughly 82% of it longs. But spot ETF outflows began three sessions earlier and USDT's market cap has shrunk $6.6 billion in 60 days — the leveraged length left before the inflation print did. A double top at 81,890 and 81,080 leaves a measured target of 69,366.
placeholder
Gold Extends Slide Below $4,000 as Rising US Inflation, Fed December Hike Bets Pressure Prices On November 12, gold prices (XAUUSD) extended their recent losses, falling further below $4,000 in early Asian trading to hit an intraday low near $3,968, marking a third consecutive day
Author  TradingKey
Yesterday 02: 00
On November 12, gold prices (XAUUSD) extended their recent losses, falling further below $4,000 in early Asian trading to hit an intraday low near $3,968, marking a third consecutive day
placeholder
Gold closed below $4,000 again — the ETF crowd and central banks stayed, the momentum money leftSpot gold is trading near $3,999, its third consecutive lower daily low, after a 5.00% 10-year yield and a 102.85 dollar index raised the odds of a December hike to 87%. But the selling is not coming from the strategic holders: managed-money net longs fell to 324 tonnes, a 21-week low, and Goldman Sachs attributes roughly 95% of five weeks of selling to non-reportable positions. ETFs still hold a record 4,256 tonnes and central banks bought 321 tonnes in Q3. The table below sets the triggers, directions and levels.
Author  Irene Q.
Yesterday 03: 20
Spot gold is trading near $3,999, its third consecutive lower daily low, after a 5.00% 10-year yield and a 102.85 dollar index raised the odds of a December hike to 87%. But the selling is not coming from the strategic holders: managed-money net longs fell to 324 tonnes, a 21-week low, and Goldman Sachs attributes roughly 95% of five weeks of selling to non-reportable positions. ETFs still hold a record 4,256 tonnes and central banks bought 321 tonnes in Q3. The table below sets the triggers, directions and levels.
goTop
quote