
Pi Network Bearish Momentum Builds As PI Risks Falling to $1
Pi Network (PI) reached a record market cap of $19.2 billion on February 26, but has since fallen to $9.2 billion as selling pressure mounts.
PI has corrected by 22% over the past two weeks and is down another 8% in the last 24 hours alone. Negative sentiment has grown following a sharp sell-off after the KYC deadline. Here’s a look at the current technical setup and what could come next for PI.
Pi Network DMI Shows Sellers Are In Control
PI’s DMI chart shows its ADX sitting at 18.3, a level it has maintained since yesterday, signaling a weak trend.
The relatively flat ADX reading suggests that the current downtrend lacks strong momentum, but it is still present as the indicator remains below the key 25 threshold.
The Average Directional Index (ADX) measures the strength of a trend, with values above 25 indicating a strong trend and values below 20 suggesting a weak or range-bound market.
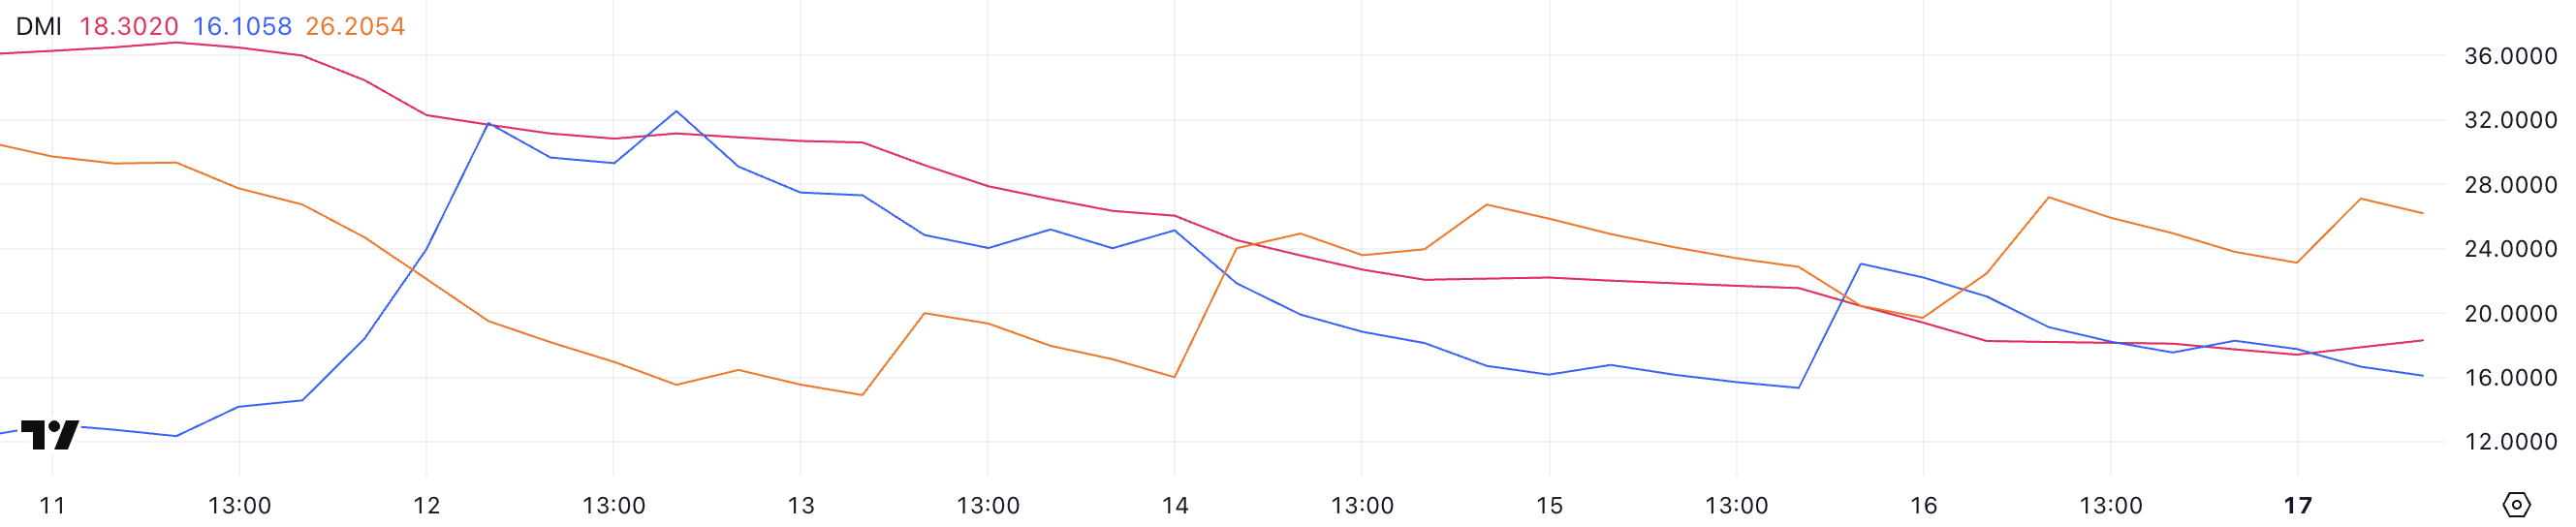 PI DMI. Source: TradingView.
Currently, PI’s +DI has dropped to 16.1 from 23 two days ago, while the -DI has climbed to 26.2 from 19.6 yesterday.
This widening gap between the +DI and -DI lines highlights that sellers are regaining control, reinforcing the existing downtrend.
Unless the +DI starts to recover and the ADX rises above 20, PI may continue to face bearish pressure in the short term.
PI CMF Is Still Struggling In Negative Levels
PI’s CMF is currently at -0.14 and has remained in negative territory for the past two days, following a recent peak of 0.15 just four days ago.
This shift marks a clear change in buying and selling dynamics, as the indicator is now at its lowest level in the past week.
The Chaikin Money Flow (CMF) measures the flow of money into and out of an asset, combining price and volume to gauge buying or selling pressure.
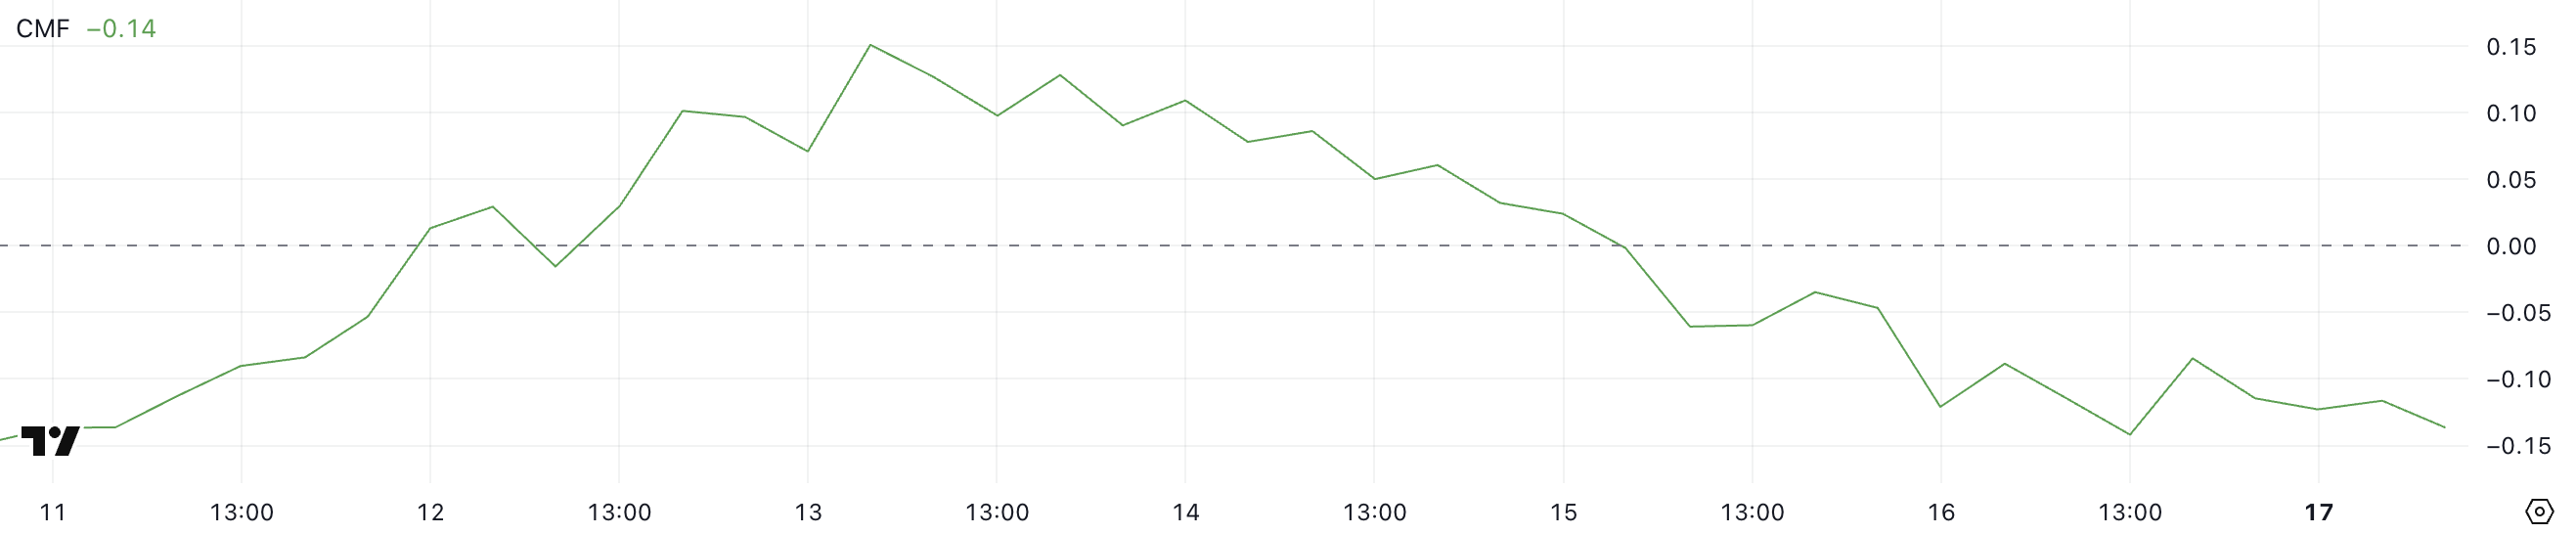 PI CMF. Source: TradingView.
A CMF above 0 indicates accumulation (buying pressure), while a CMF below 0 suggests distribution (selling pressure).
With PI’s CMF now at -0.14, this signals that sellers have gained control, adding weight to the ongoing downtrend.
The negative reading may point to continued weakness unless buying volume picks up in the short term.
Will Pi Network Fall Below $1 Soon?
PI has come under pressure in recent days following criticism surrounding the launch of its .pi domains, adding to the negative sentiment that started with a major sell-off after its mainnet migration.
If this corrective trend continues, PI could test the support at $1.23, and a break below this level could push the price under $1.20 for the first time since February 22.
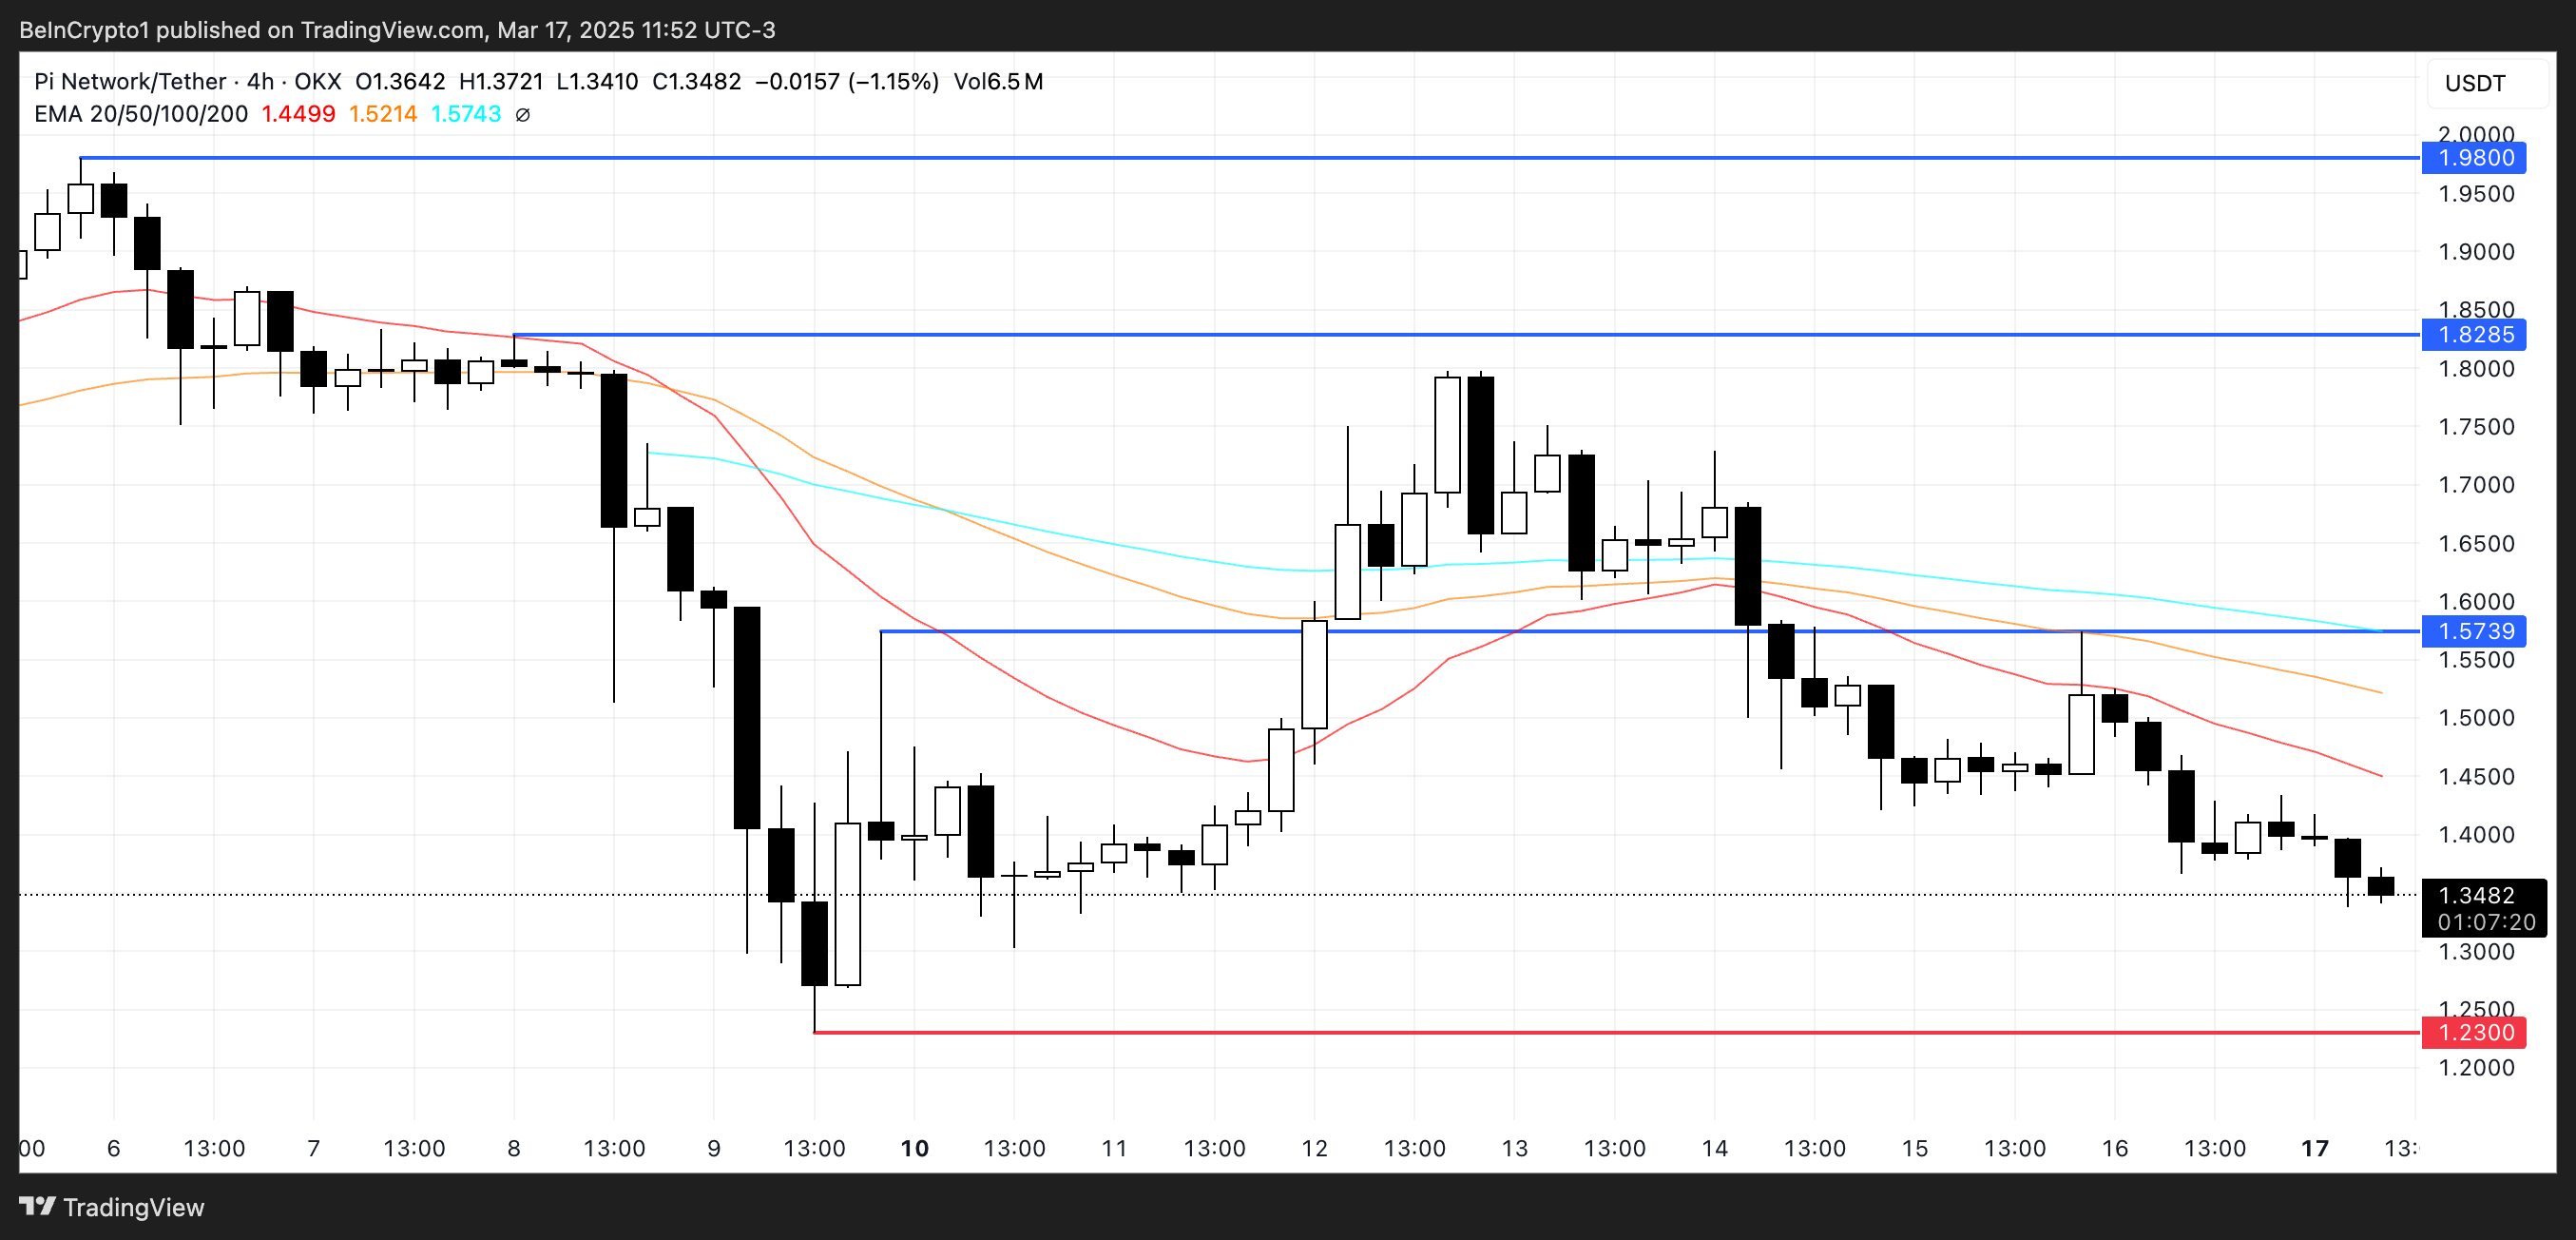 PI Price Analysis. Source: TradingView.
However, if PI price regains positive momentum, it could rebound and challenge the resistance at $1.57. A breakout above this level could open the way for further gains toward $1.82 and $1.98.
If bullish momentum accelerates, PI could potentially break above $2 for the first time since March 1, signaling a significant trend reversal.
Recommended Articles


