

Bitcoin Price Approaches 8% Breakout as Holders Signal Reversal

Source Beincrypto

Bitcoin is positioning itself for a potential breakout that could push its price above $91,000. The leading cryptocurrency is currently trading within a symmetrical triangle, signaling a possible bullish move. 

However, this rally faces challenges as short-term holders (STHs) adjust their stance while long-term holders (LTHs) contribute to selling pressure.  

Bitcoin Holders Are Settling Down

The Short-Term MVRV has fallen below the 0.9 mark, a level historically associated with saturation points for STH selling. This indicator often signals the end of a selling phase and a potential price reversal. If history repeats itself, Bitcoin may soon witness renewed buying pressure, setting the stage for recovery.  

Bitcoin has previously shown a pattern of price rebounds when the Short-Term MVRV dips to these levels. If the same trend follows, BTC could gain upward momentum in the short term. 
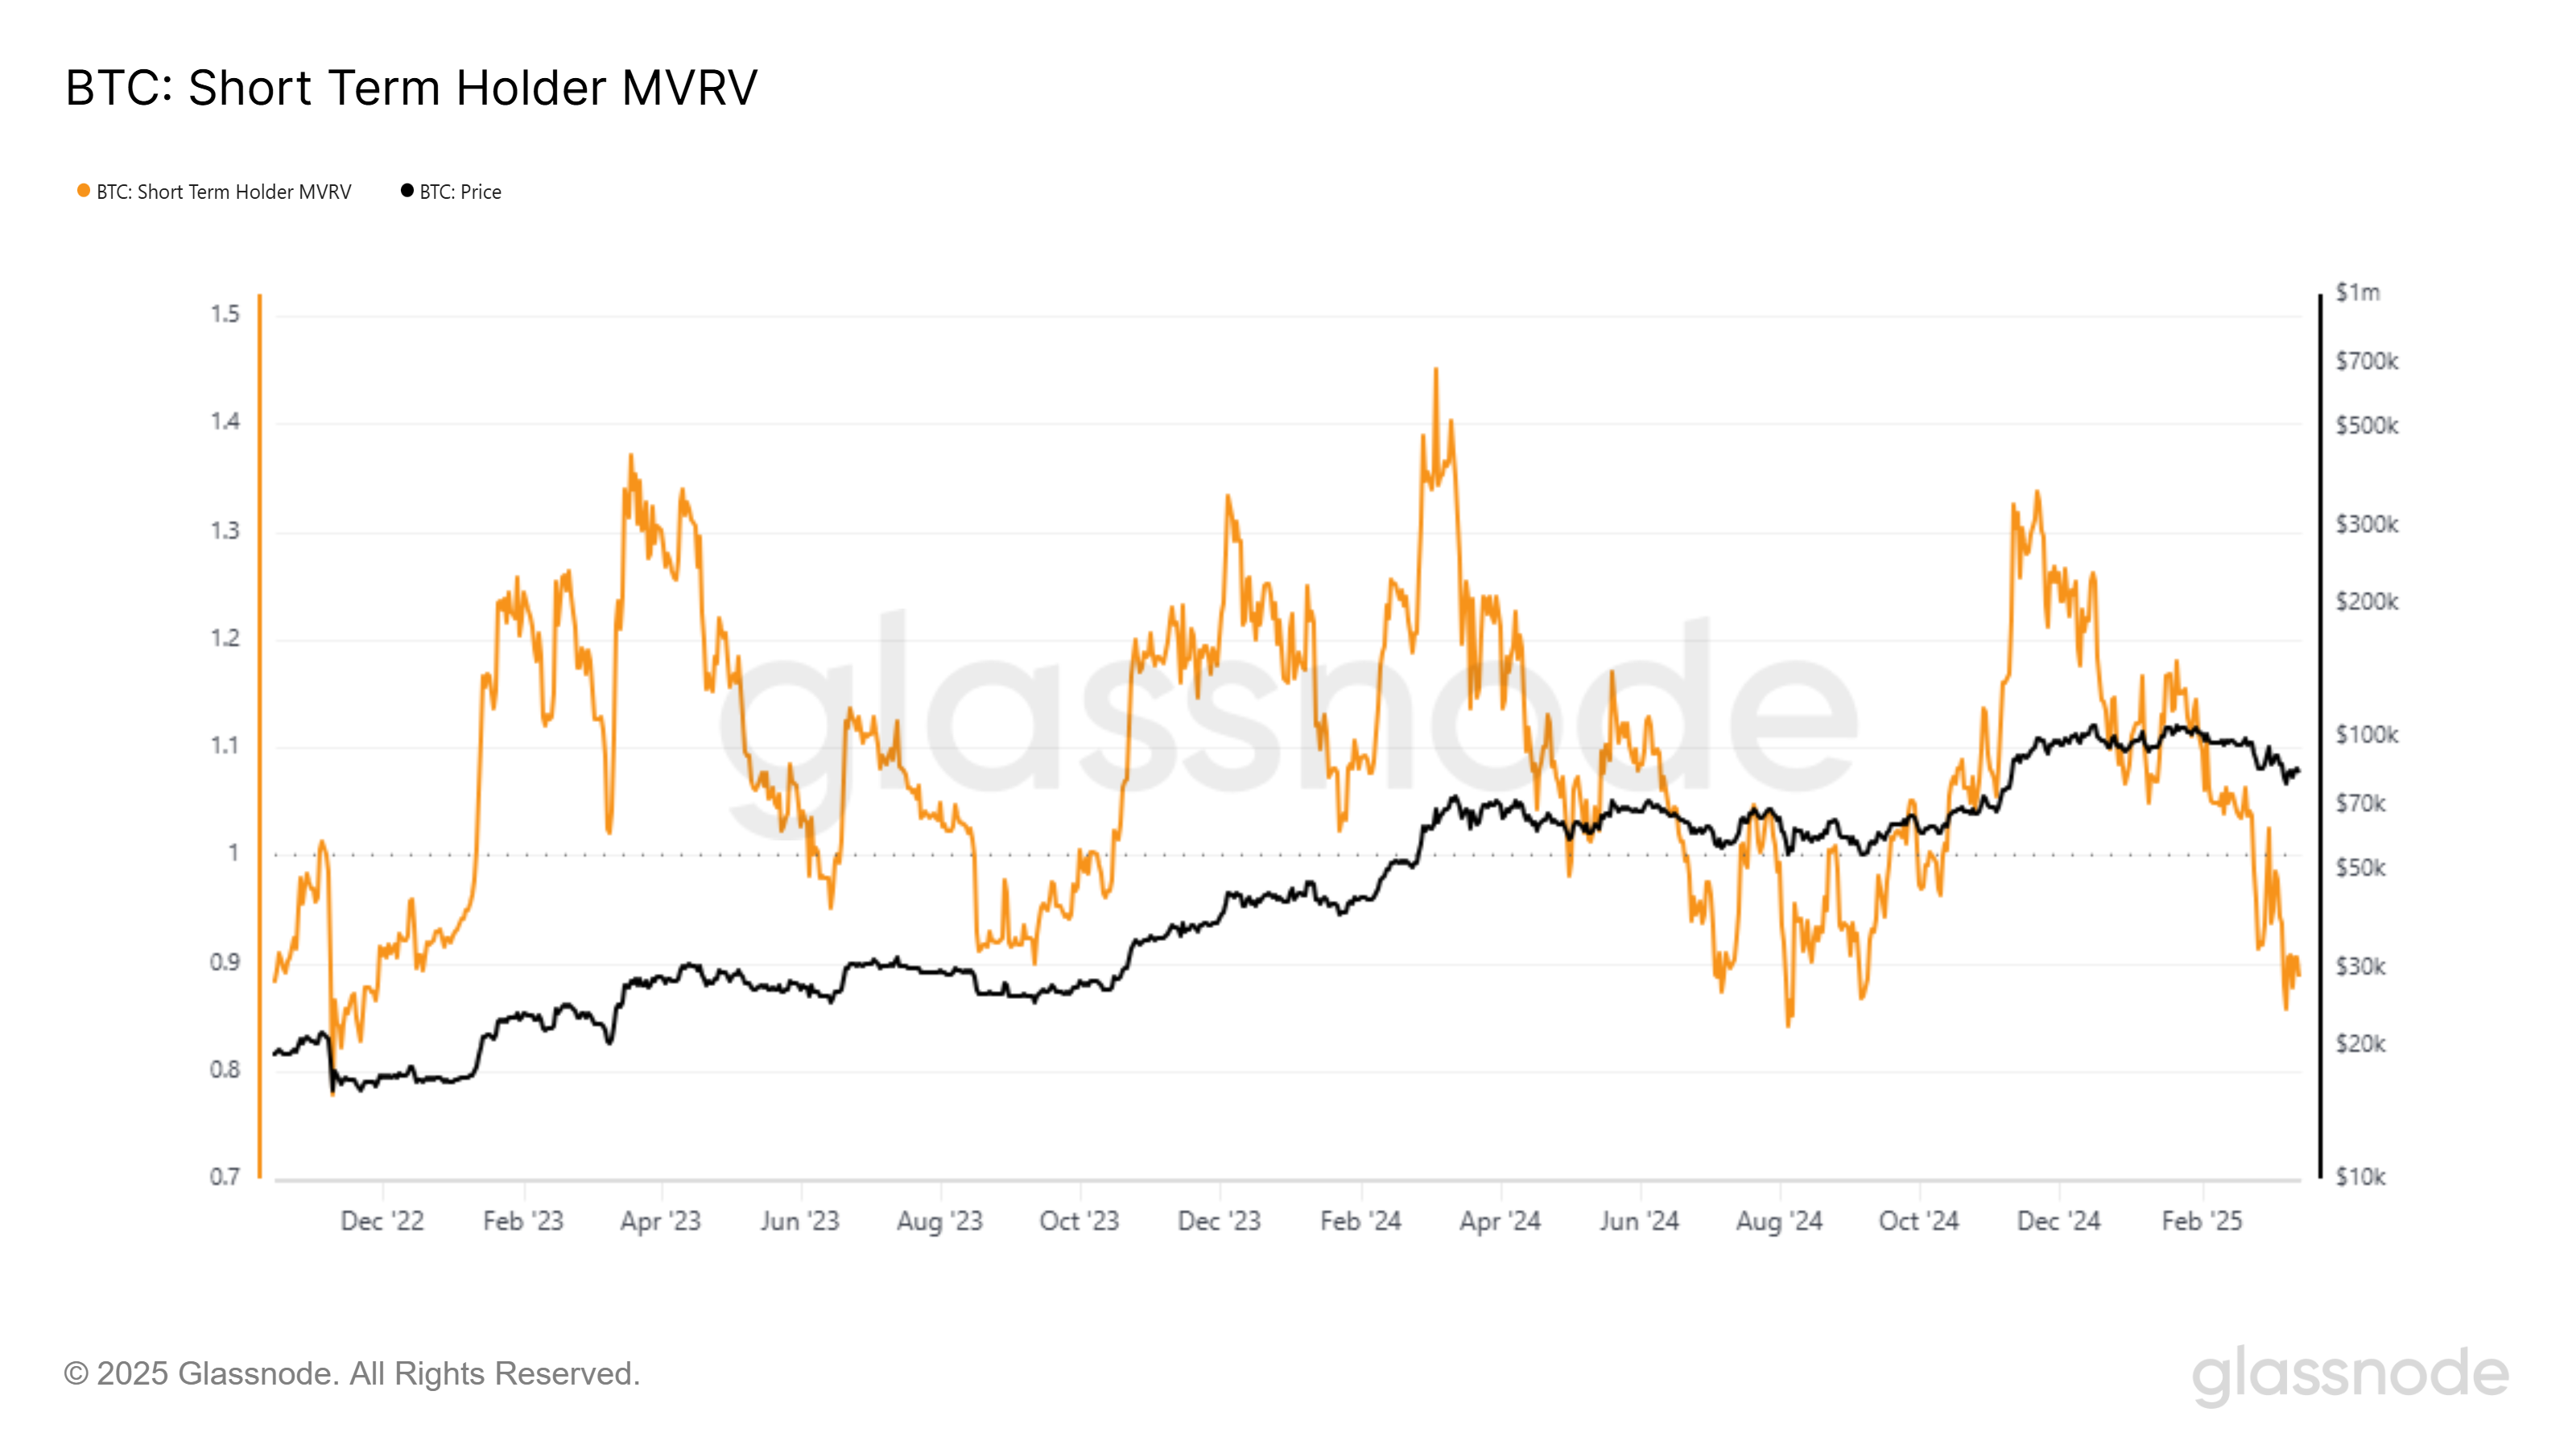
Bitcoin STH MVRVBitcoin STH MVRV. Source: Glassnode

The Long-Term Holder Market Inflation Rate measures the annualized rate of net accumulation or distribution by LTHs relative to miner issuance. Currently, values of 0.025 suggest that LTHs are still adding to sell-side pressure. Although this indicator is noting a downtick, it continues to impact Bitcoin’s price movement.

Once the LTH Market Inflation Rate drops below miner issuance levels (inflation rate at 0.008), the pressure on Bitcoin’s price will likely ease. This shift would allow BTC to gain traction, increasing its chances of breaking through resistance. Until then, the market remains vulnerable to fluctuations driven by LTH selling activity.
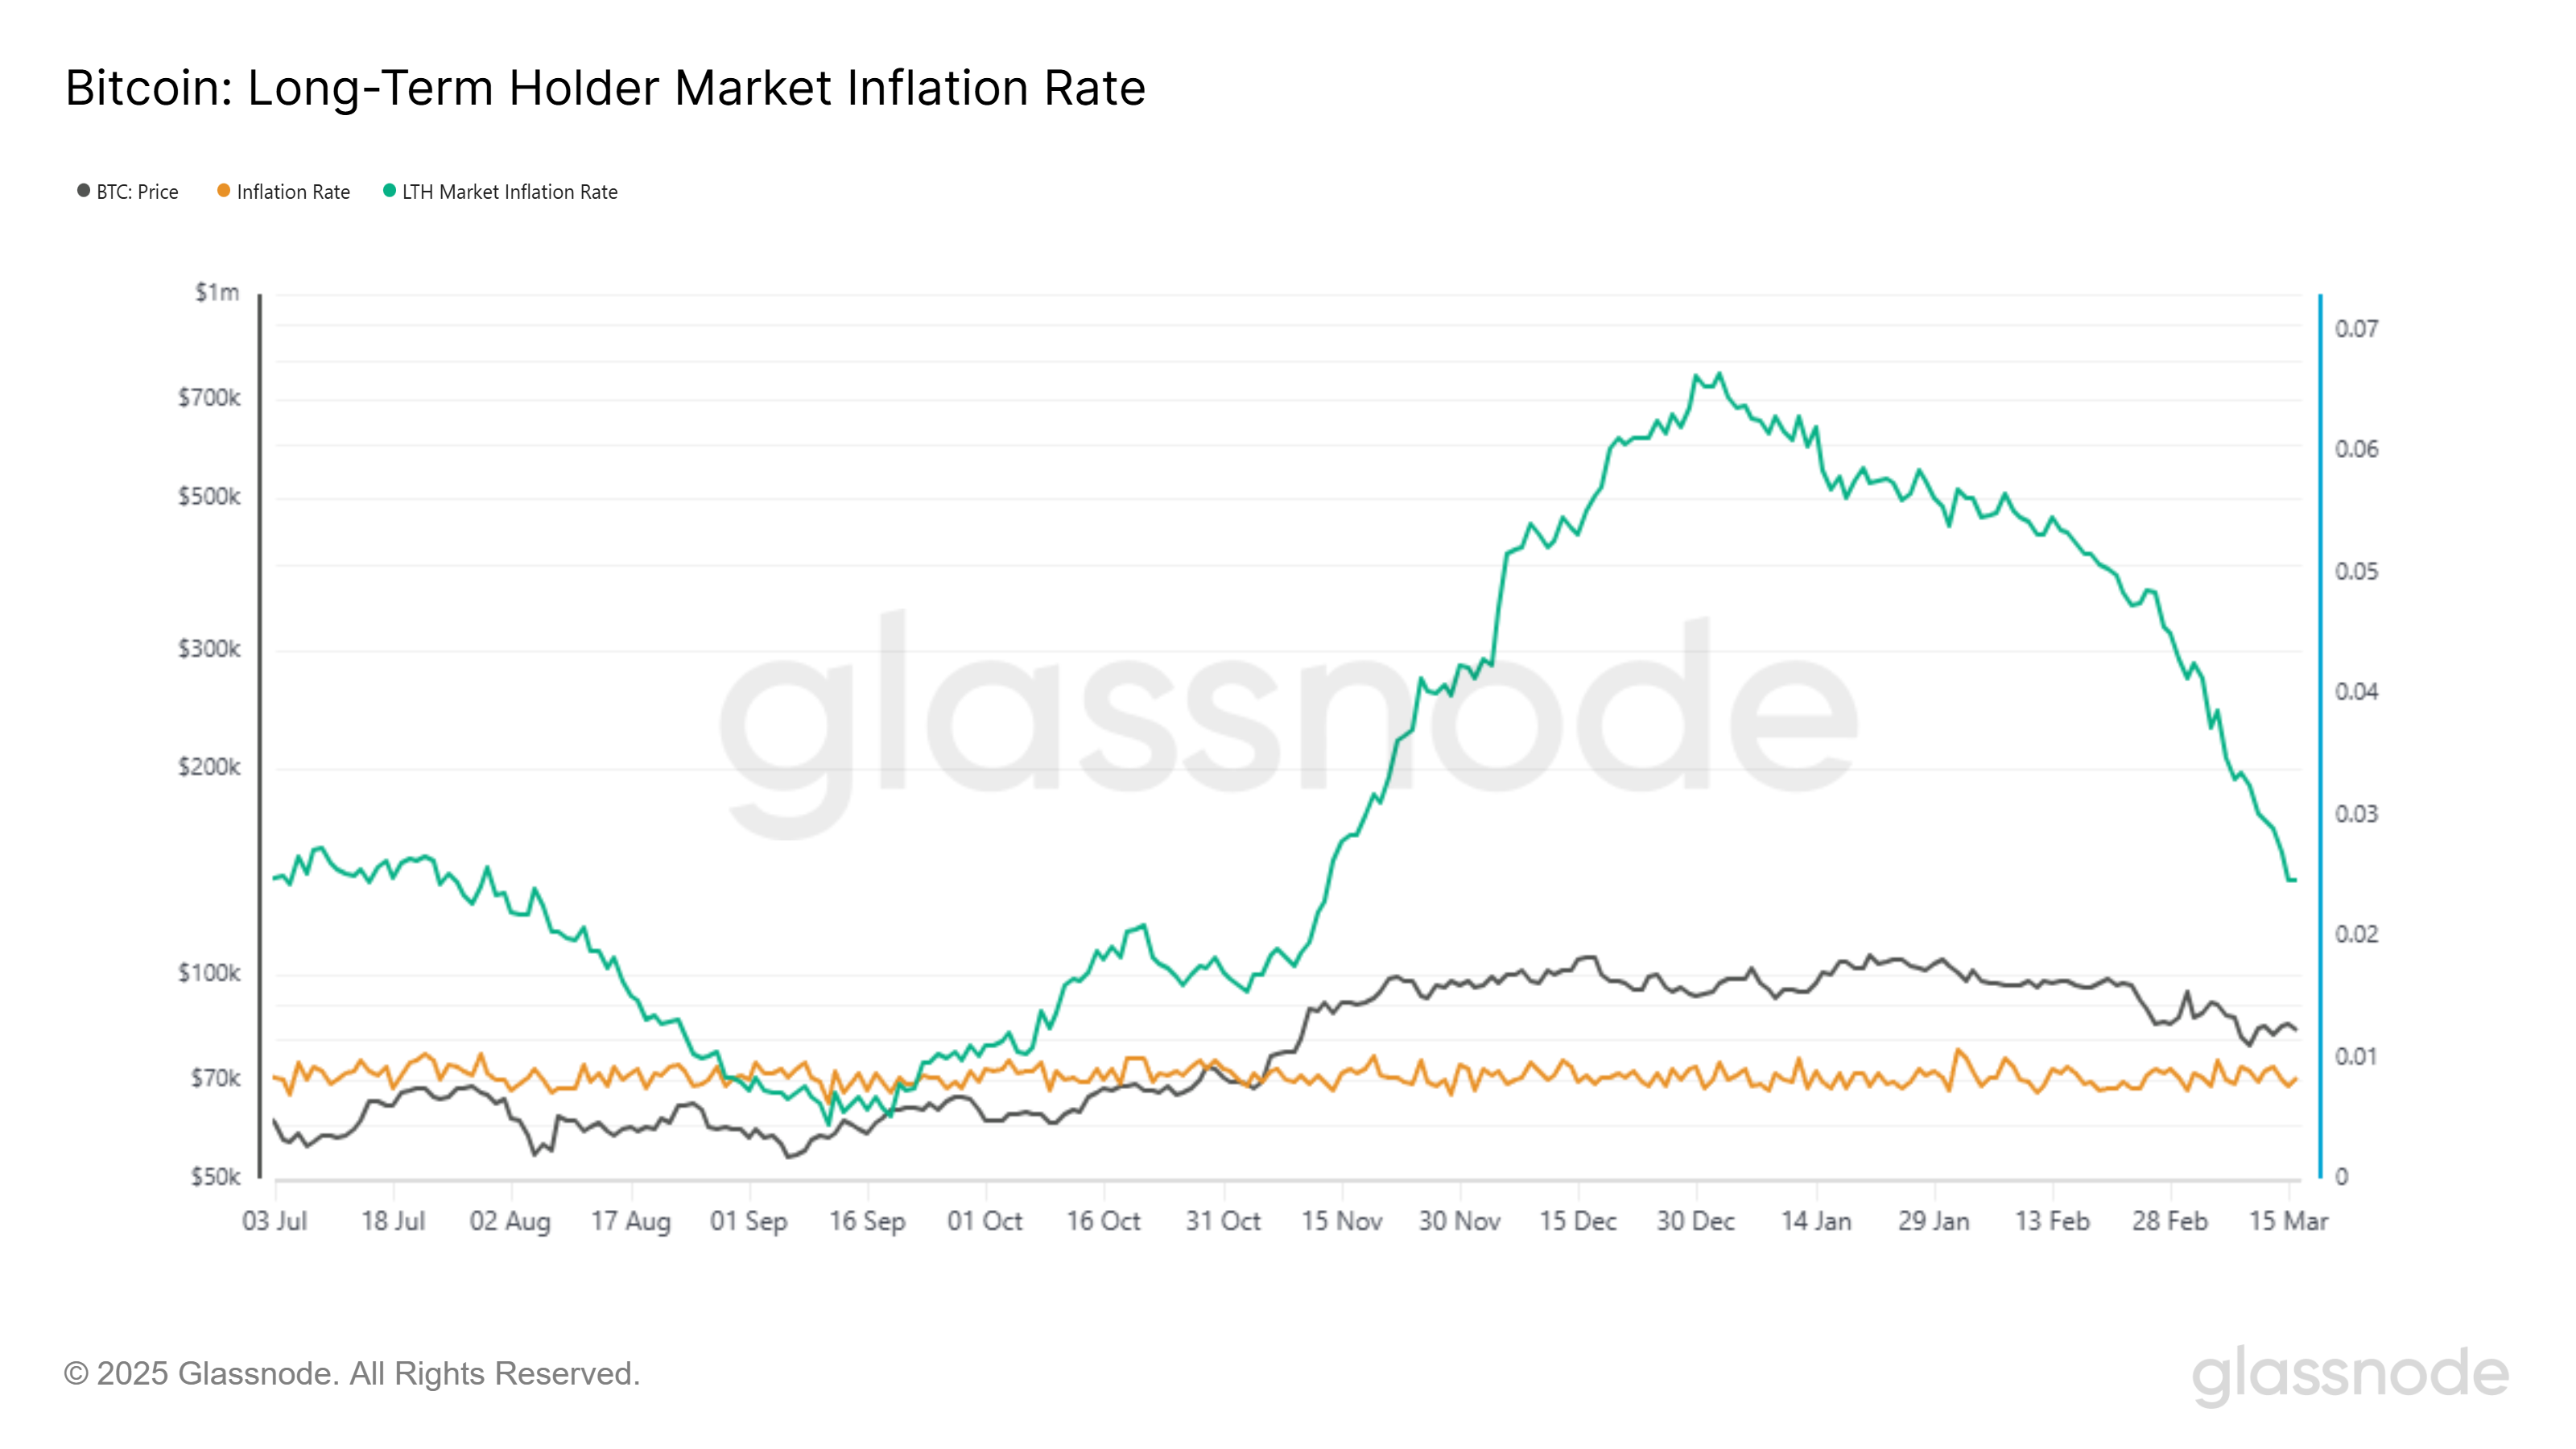
Bitcoin LTH Market Inflation RateBitcoin LTH Market Inflation Rate. Source: Glassnode

BTC Price Breakout Ahead

Bitcoin is currently trading at $83,336, holding above the crucial $82,761 support level. The symmetrical triangle pattern suggests a potential 8.8% breakout, indicating a price move that could send BTC higher in the coming days.  

The breakout target of $91,521 will only become viable once Bitcoin breaches $85,000 and establishes $87,041 as a support level. Achieving this milestone would bring Bitcoin closer to recovering its recent losses, reinforcing a bullish outlook for the cryptocurrency.  
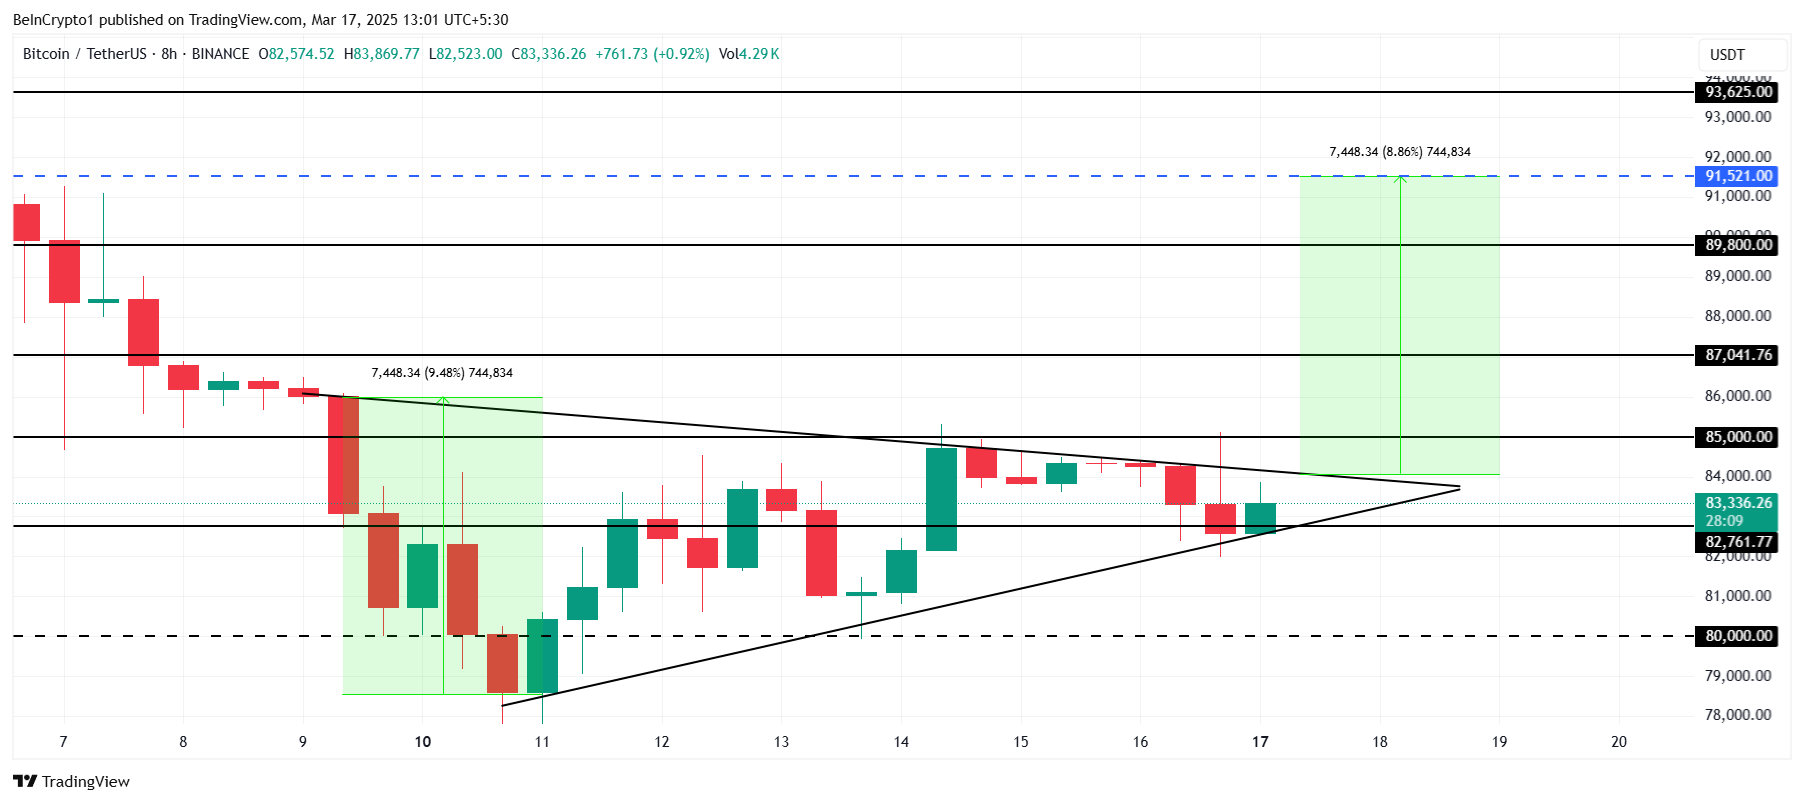
Bitcoin Price Analysis. Bitcoin Price Analysis. Source: TradingView

However, failure to break past $85,000 could result in Bitcoin sliding back to $82,761 or even dropping further to $80,000. This scenario would invalidate the bullish pattern and introduce additional downside risk, delaying any potential recovery in the short term.

Disclaimer: For information purposes only. Past performance is not indicative of future results.
placeholder
Gold Price Analysis Today | Forex Gold Analysis | XAU/USD Analysis - November 11, 2026Get the latest gold price analysis, forex gold insights, and XAU/USD analysis for November 11, 2026. Read on for the details.
Author  Mitrade
Nov 11, Wed
Get the latest gold price analysis, forex gold insights, and XAU/USD analysis for November 11, 2026. Read on for the details.
placeholder
Nvidia slid 7.7% after hours while AMD and Broadcom rose — the AI trade changed hands, it didn't breakNvidia closed Wednesday at 173.73, up 2.87%, then fell as much as 8.1% to 159.44 after reports that its board was preparing for a possible leadership change. The same session, the Philadelphia Semiconductor Index rose 5.7% with all 30 components higher, CoreWeave jumped 24.7% on 168% revenue growth, and Micron added 11.9%. If AI demand were being repriced, AMD and Broadcom would not be bid. This is a governance discount on one name, and 204.54 — the 200-day average — is the level that settles it.
Author  Irene Q.
Nov 12, Thu
Nvidia closed Wednesday at 173.73, up 2.87%, then fell as much as 8.1% to 159.44 after reports that its board was preparing for a possible leadership change. The same session, the Philadelphia Semiconductor Index rose 5.7% with all 30 components higher, CoreWeave jumped 24.7% on 168% revenue growth, and Micron added 11.9%. If AI demand were being repriced, AMD and Broadcom would not be bid. This is a governance discount on one name, and 204.54 — the 200-day average — is the level that settles it.
placeholder
US October PPI Preview: Fed Rate Hike Expectations Rise, PPI May Be Key Variable; How Will US Stocks, Dollar, and Gold Move?On Friday (Nov. 13) Eastern Time, the U.S. will release the October Producer Price Index (PPI). Following the October CPI once again exceeding expectations, the market will look to the PP
Author  TradingKey
Nov 12, Thu
On Friday (Nov. 13) Eastern Time, the U.S. will release the October Producer Price Index (PPI). Following the October CPI once again exceeding expectations, the market will look to the PP
placeholder
Gold hit a one-year low while central banks bought 321 tonnes — the sellers were never the ones you thinkSpot gold closed at 3,876 on Thursday, down 2.8% and its lowest close in more than a year, with an intraday low near 3,852. The dollar is at a 19-month high of 103.21 and the 10-year yield is at 5.10%, so the price move is easy to explain. What is harder to explain is who sold: central banks bought 321 tonnes in Q3, the PBoC added for a 24th straight month, ETF holdings are near a record 4,256 tonnes, and roughly 95% of the futures selling came from non-reportable and sovereign-type accounts rather than hedge funds. This piece separates the two books that have to balance.
Author  Irene Q.
Yesterday 02: 40
Spot gold closed at 3,876 on Thursday, down 2.8% and its lowest close in more than a year, with an intraday low near 3,852. The dollar is at a 19-month high of 103.21 and the 10-year yield is at 5.10%, so the price move is easy to explain. What is harder to explain is who sold: central banks bought 321 tonnes in Q3, the PBoC added for a 24th straight month, ETF holdings are near a record 4,256 tonnes, and roughly 95% of the futures selling came from non-reportable and sovereign-type accounts rather than hedge funds. This piece separates the two books that have to balance.
placeholder
Brent rose 3.3% and US crude stocks built 4.66 million barrels in the same weekBrent January settled at 95.82, up 3.3%, and WTI at 88.74, up 2.55%, after the US signalled it would not pursue a deal with Iran and attacks on Gulf shipping continued. In the same week, EIA data showed US crude inventories rising 4.657 million barrels against expectations of a 1.1 million draw, with gasoline up another 1.799 million. OPEC output also rebounded 1.96 million barrels a day to 27.16 million in October, led by Saudi Arabia at 10.56 million. This piece separates the geopolitical premium from the physical balance and lays out where each side of the trade is anchored.
Author  Irene Q.
23 hours ago
Brent January settled at 95.82, up 3.3%, and WTI at 88.74, up 2.55%, after the US signalled it would not pursue a deal with Iran and attacks on Gulf shipping continued. In the same week, EIA data showed US crude inventories rising 4.657 million barrels against expectations of a 1.1 million draw, with gasoline up another 1.799 million. OPEC output also rebounded 1.96 million barrels a day to 27.16 million in October, led by Saudi Arabia at 10.56 million. This piece separates the geopolitical premium from the physical balance and lays out where each side of the trade is anchored.
goTop
quote