Stellar (XLM) Chart Signals Major Rally —Is A 330% Surge Coming?

Source Newsbtc

The Stellar (XLM) market has registered a price boost in the past day gaining by 10.77% according to data from CoinMarketCap. This price bounce comes after a rather bearish week marked by significant losses across the general crypto market. Interestingly, as these digital assets show some minor recovery, renowned market analyst Ali Martinez has postulated that XLM may be preparing for a major bullish swing.

XLM’s Bullish Flag Could Propel Prices To $1.20 – Analyst

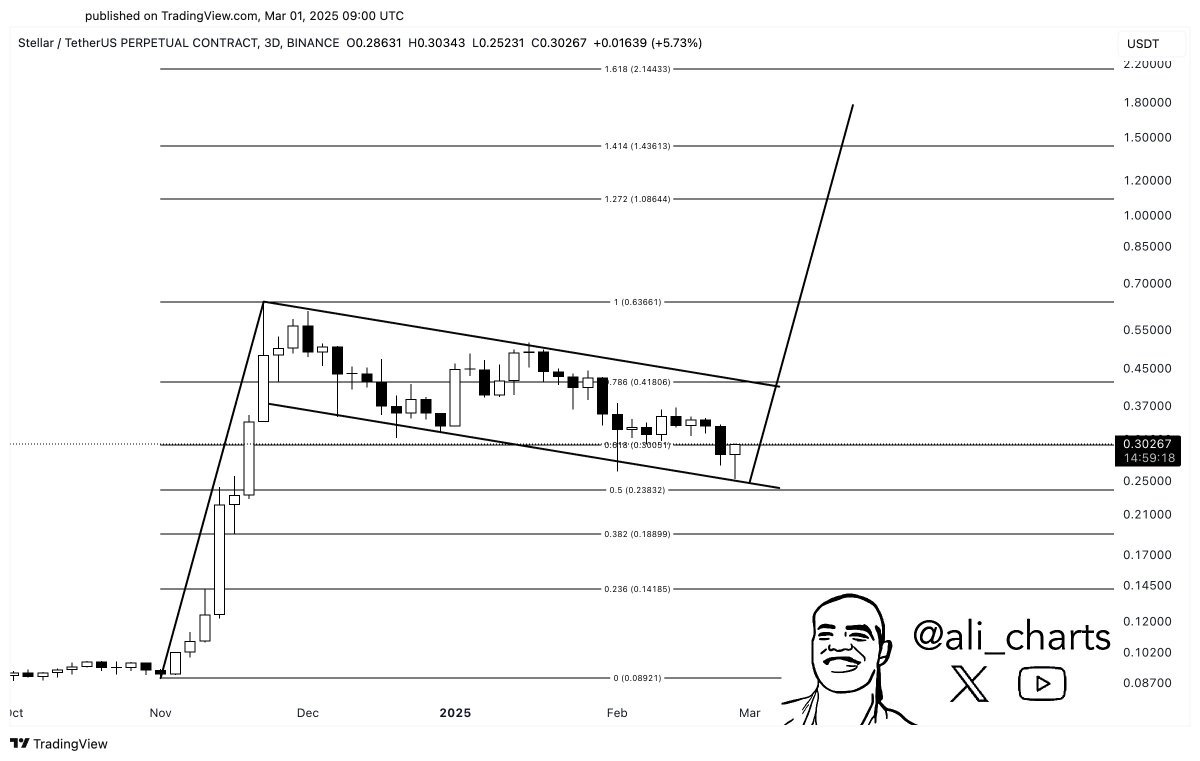
In an X post on March 1, Martinez shared an interesting technical analysis of the XLM market.  According to the market expert, there is a bullish flag formation on the XLM/USDT 3-day trading chart signaling an incoming price surge.

For context, the bullish flag pattern occurs when an asset experiences a steep rise in price representing the flagpole followed by a consolidation period with a declining price movement representing the flag. On the XLM/USDT chart, the bullish flag is formed following a price rally in November 2024 which is trailed by a price correction phase to date.
XLM

However, while the bullish flag might signal a potential upward momentum ready to explode, Stellar must break beyond the upper boundary of the flag currently at $0.41 to confirm any price surge. Looking beyond this level, the altcoin will also face significant resistance to its upward movement at $1.00, $1.21, and $1.41 price levels respectively.

However, in the presence of sufficient buying pressure, XLM could surge by at least 330% upon confirmation of bullish intent suggesting a minimum price of around $1.20. This projected rise of Stellar stems from historical data from which a bullish flag is expected to produce market gains similar to the length of its flagpole.

Interestingly, the Relative Strength Index (RSI) on the XLM/USDT daily chart also supports the bullish potential of the altcoin. According to data from Tradingview, this RSI is currently at 4.59 headed in the upward direction, signaling more room for XLM price gains following its recent recovery.

XLM Price Overview

At the time of writing, XLM trades at $0.3141 after its 10% price increase in the last 24 hours as earlier stated. Meanwhile, there is a slight reduction in market engagement as indicated by a 1.12% decline in daily trading volume.

It is worth noting that XLM still remains in the red zone on its weekly and monthly timeframes with losses of 5.94% and 27.28%, respectively suggesting larger bearish market control in recent times. For a bullish flag breakout to materialize, XLM traders must increase the current buying pressure and induce a higher trading volume.

XLM
Disclaimer: For information purposes only. Past performance is not indicative of future results.
placeholder
AUD/USD: Current price action is likely the early stages of a recovery – UOB GroupAustralian Dollar (AUD) is likely to trade in a sideways range between 0.6220 and 0.6290. In the longer run, current price action is likely the early stages of a recovery phase that could potentially reach 0.6350, UOB Group’s FX analysts Quek Ser Leang and Lee Sue Ann note.
Author  FXStreet
Jan 22, Wed
Australian Dollar (AUD) is likely to trade in a sideways range between 0.6220 and 0.6290. In the longer run, current price action is likely the early stages of a recovery phase that could potentially reach 0.6350, UOB Group’s FX analysts Quek Ser Leang and Lee Sue Ann note.
placeholder
Five bullish Shiba Inu (SHIB) Price Predictions for April 2025SHIB price targets diverge as investors weigh Shibarium L3 upgrades, burn-rate surges, and altcoin market sentiment. Forecasts range from a conservative $0.000012 to a parabolic $0.00030.
Author  FXStreet
Apr 16, Wed
SHIB price targets diverge as investors weigh Shibarium L3 upgrades, burn-rate surges, and altcoin market sentiment. Forecasts range from a conservative $0.000012 to a parabolic $0.00030.
placeholder
Ethereum Price Stays Resilient — Upside Break May Be AheadEthereum price started a downside correction below the $1,780 level. ETH is now consolidating near the $1,800 zone and might aim for a move above $1,820.
Author  NewsBTC
23 hours ago
Ethereum price started a downside correction below the $1,780 level. ETH is now consolidating near the $1,800 zone and might aim for a move above $1,820.
placeholder
Gold price slides back closer to $3,300 amid tariff deals optimismGold price (XAU/USD) struggles to capitalize on the previous day's bounce from the vicinity of the $3,265-3,260 pivotal support and attracts fresh sellers during the Asian session on Tuesday.
Author  FXStreet
19 hours ago
Gold price (XAU/USD) struggles to capitalize on the previous day's bounce from the vicinity of the $3,265-3,260 pivotal support and attracts fresh sellers during the Asian session on Tuesday.
placeholder
EUR/USD ticks lower despite uncertainty over US-China tradeEUR/USD edges lower to near 1.1400 during European trading hours on Tuesday. The major currency pair ticks lower as the US Dollar (USD) steadies, but remains broadly on edge amid escalating uncertainty about the trade outlook between the United States (US) and China.
Author  FXStreet
17 hours ago
EUR/USD edges lower to near 1.1400 during European trading hours on Tuesday. The major currency pair ticks lower as the US Dollar (USD) steadies, but remains broadly on edge amid escalating uncertainty about the trade outlook between the United States (US) and China.
goTop
quote