
Bitcoin Dawdles at $96,000 as Coin Celebrates Trillion Dollar Day
Bitcoin’s price movement remained sideways today, showing little reaction as the crypto community commemorates the day BTC’s market capitalization first crossed the $1 trillion mark in 2021.
It has traded below $100,000 for over two weeks, and technical and on-chain data hint at the likelihood of an extended stay below this critical price point.
Bitcoin Marks Trillion Dollar Anniversary But Stalls Below $100,000
On this day in 2021, Bitcoin’s market capitalization surpassed $1 trillion for the first time. Since then, it has nearly doubled, with the leading coin’s market cap now valued at $1.9 trillion.
Interestingly, as the market commemorates this milestone today, Bitcoin’s price performance remains lackluster, still trapped below $100,000. A relative balance between bullish and bearish pressure has kept the coin trading within a tight range since the beginning of February.
However, BeInCrypto’s assessment of the BTC/USD one-day chart reveals that the bearish bias against the king coin seems to be gaining momentum. Technical indicators like the coin’s Relative Strength Index (RSI) reflect the bearish pressure. At press time, RSI rests below the 50-neutral line at 44.29.
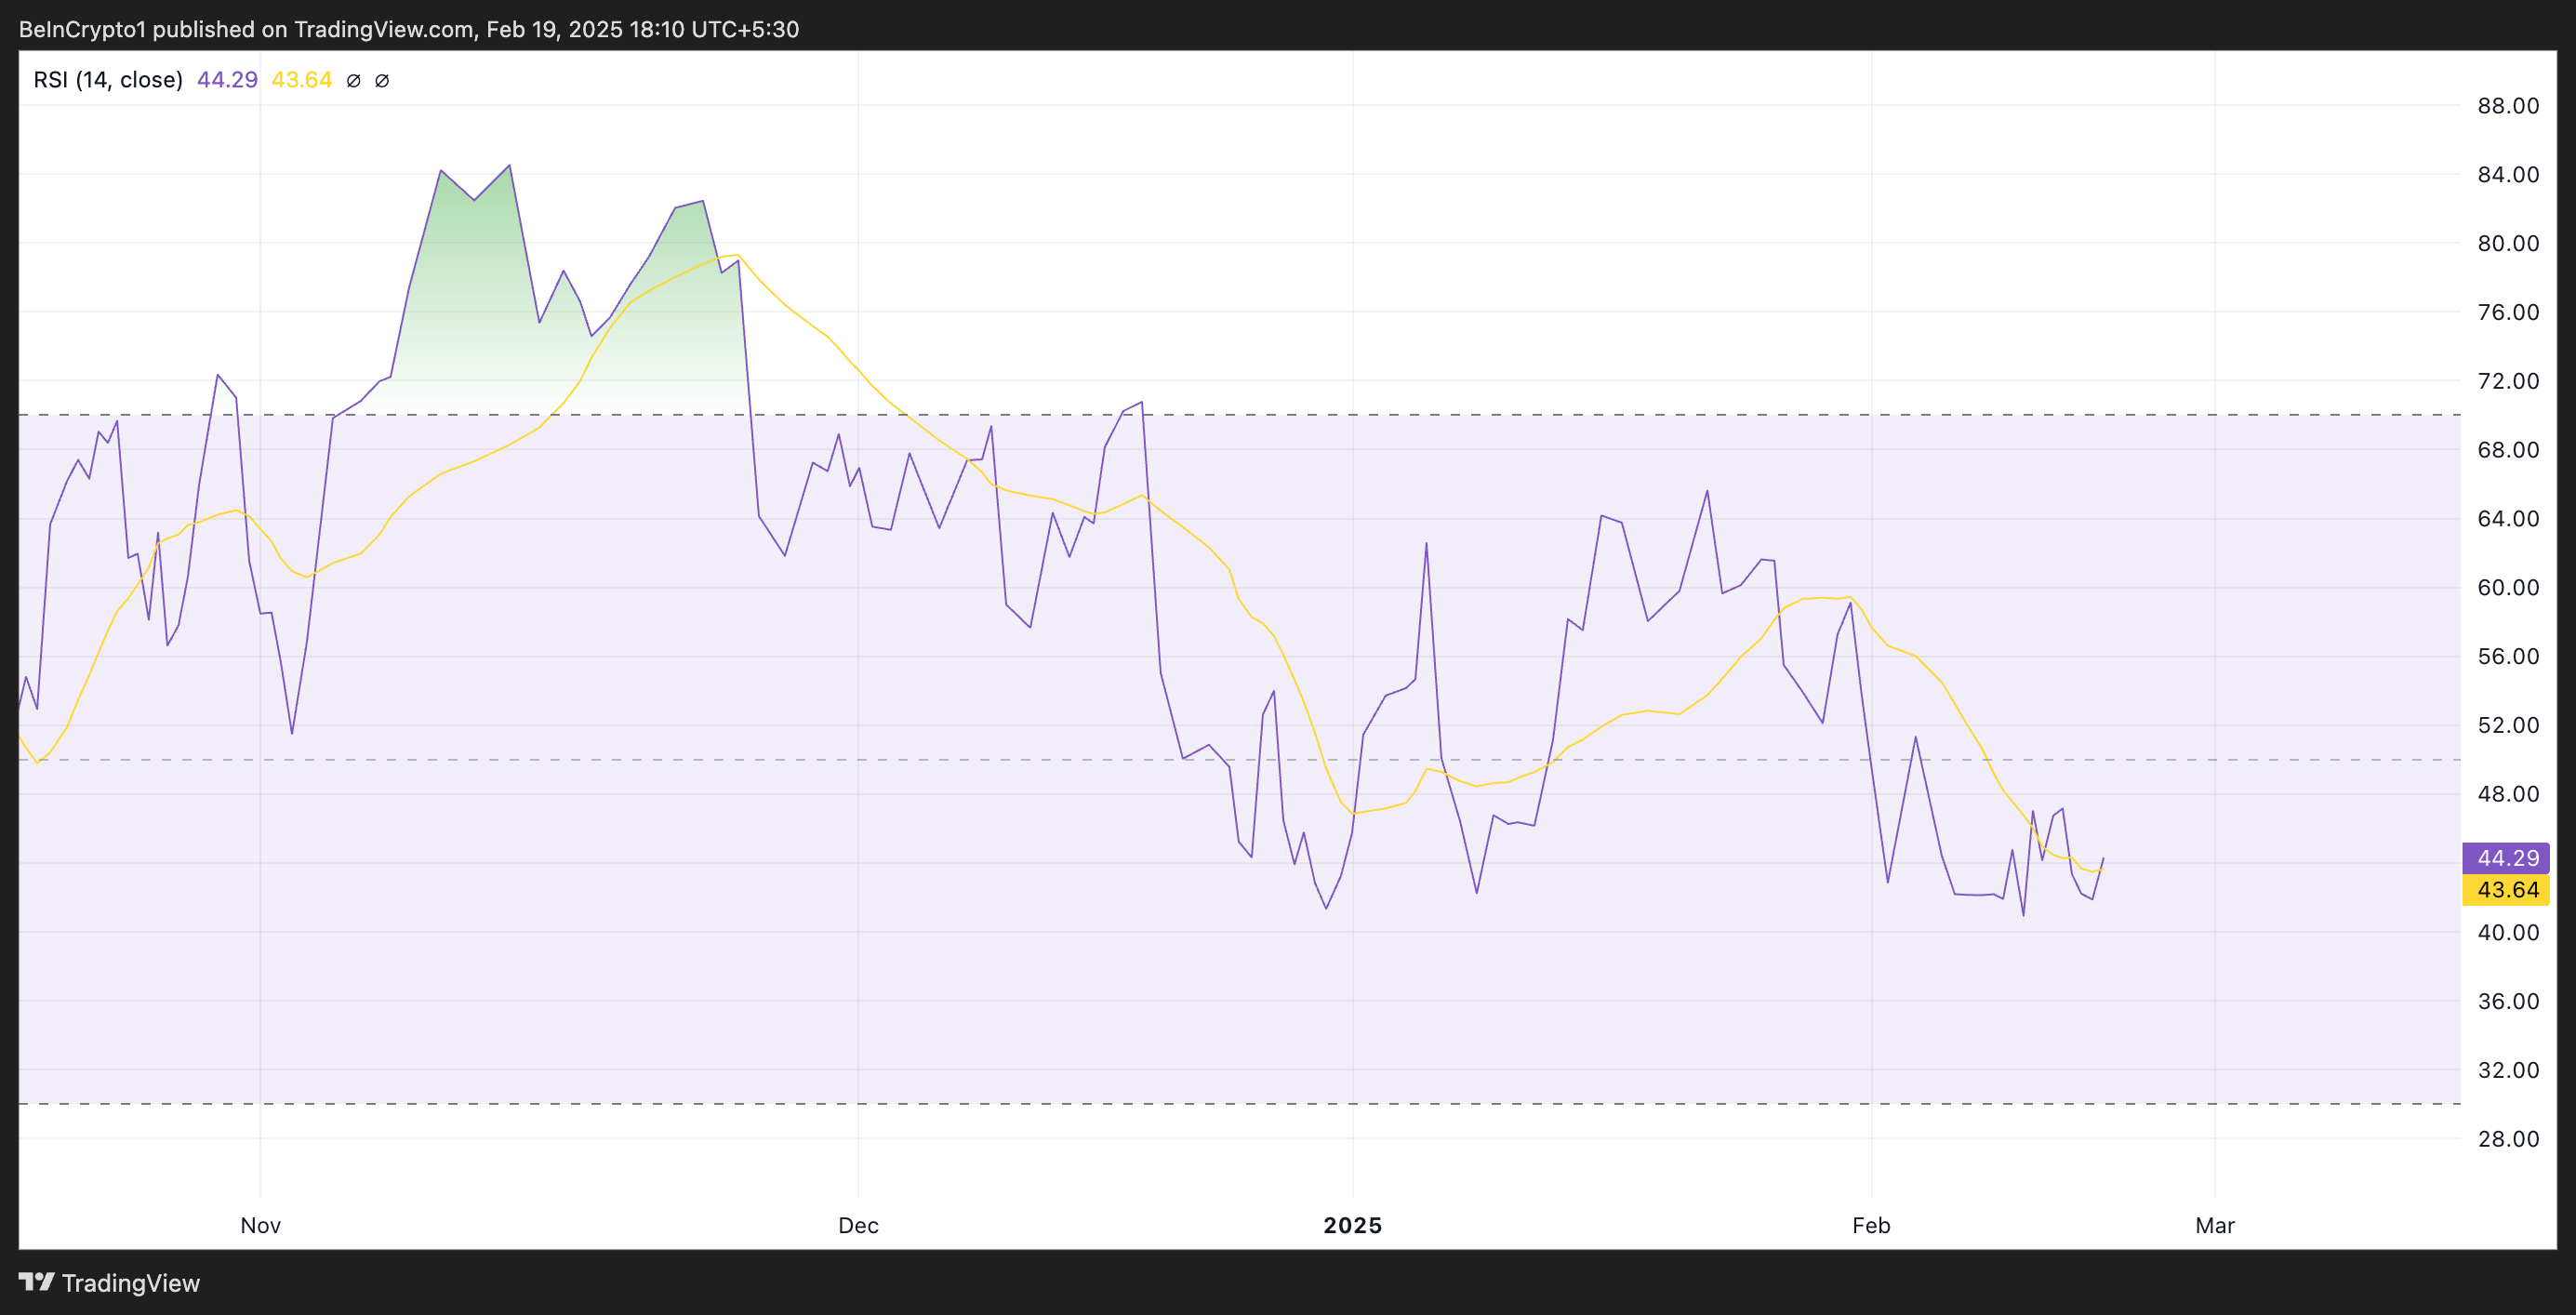 BTC RSI. Source: TradingView
The RSI indicator measures an asset’s oversold and overbought market conditions. It ranges between 0 and 100, with values above 70 suggesting that the asset is overbought and due for a decline. On the other hand, values under 30 indicate that the asset is overbought and may witness a rebound.
At 44.29, BTC’s RSI suggests that selling pressure is stronger than buying momentum but not yet at oversold levels. This means there is room for further downside or potential consolidation before a trend shift.
In addition, the setup of the coin’s Moving Average Convergence Divergence (MACD) supports this bearish outlook. As of this writing, BTC’s MACD line (blue) rests under its signal line (orange).
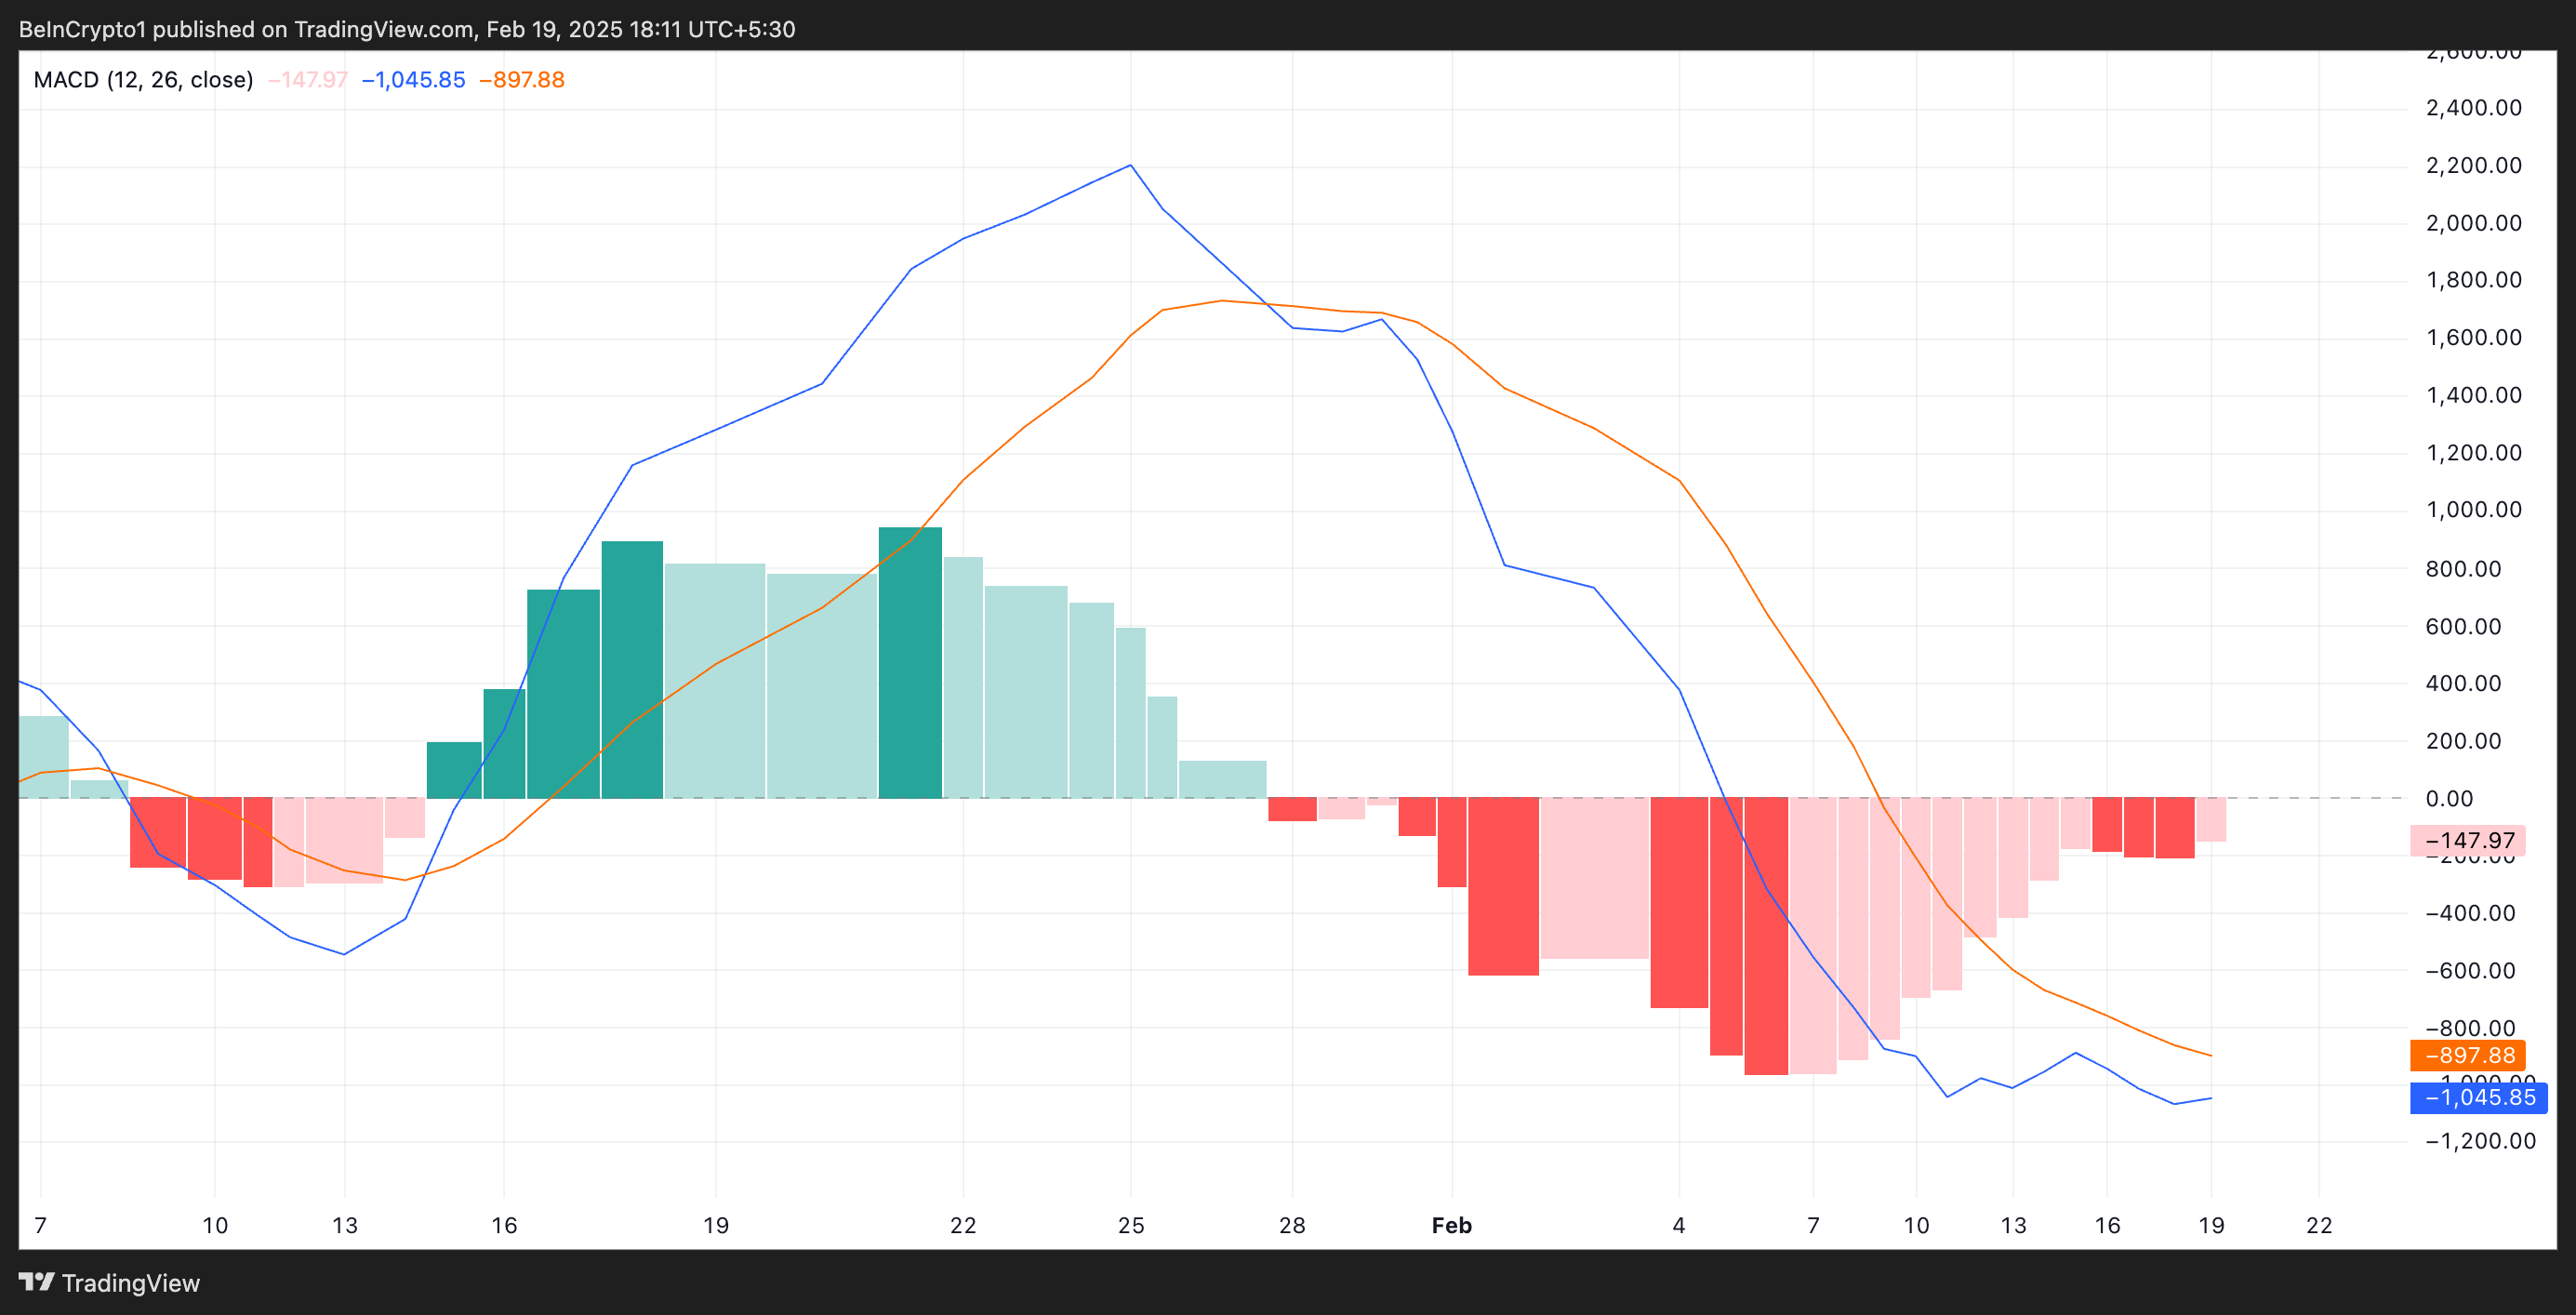 BTC MACD. Source: TradingView
An asset’s MACD indicator identifies trends and momentum in its price movement. It helps traders spot potential buy or sell signals through crossovers between the MACD and signal lines.
As in BTC’s case, when the MACD line is below the signal line, it indicates bearish momentum, suggesting that the asset’s price decline may continue. Traders see this as a potential sell signal, adding to the downward pressure in the market.
BTC at a Crossroads: $90K Breakdown or $100K Breakthrough?
At press time, BTC trades at $96,248, slightly below the strong resistance formed at $99,805. As selloffs strengthen, BTC risks breaking out of its narrow range in a downward trend. In that scenario, the coin’s price could fall below $90,000 to exchange hands at $89,434.
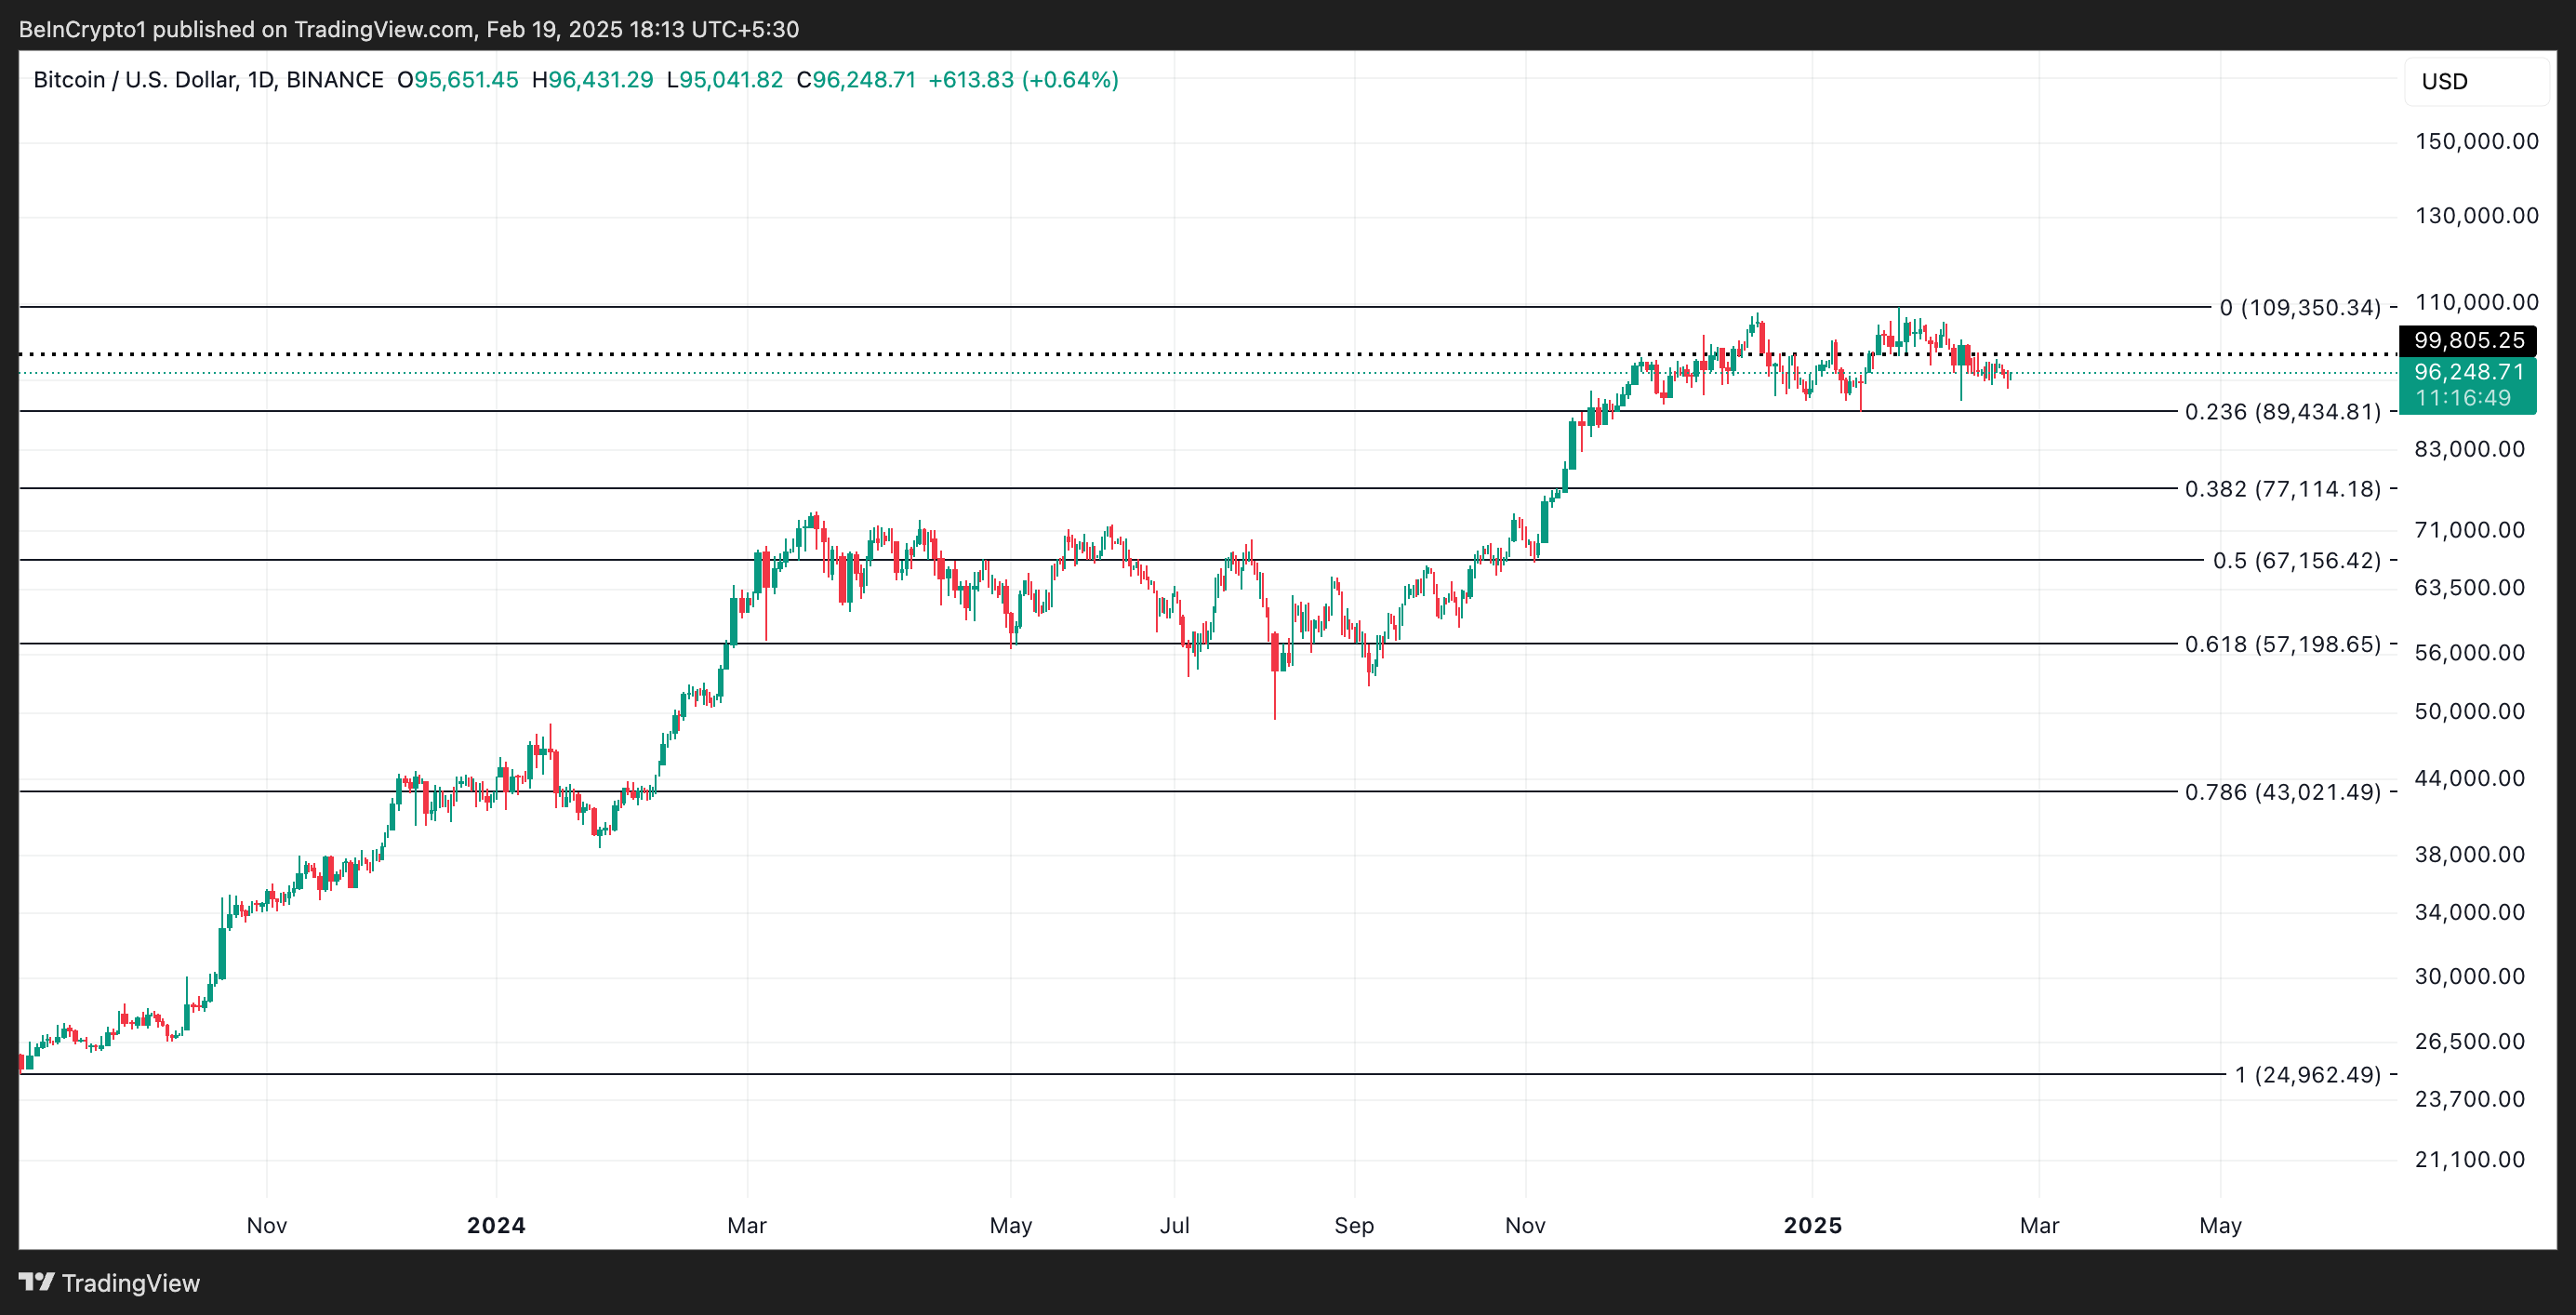 BTC Price Analysis. Source: TradingView
On the other hand, a resurgence in the market’s bullish pressure could invalidate this bearish projection. In that case, the coin’s price could break above the resistance at $99,805, cross the $100,000 threshold, and attempt to revisit its all-time high of $109,350.
Recommended Articles


