

Hedera (HBAR) Price Attempts Rebound After 40% Correction
Hedera (HBAR) price is attempting to recover after a steep 40% correction in the last 30 days. While the downtrend remains intact, indicators suggest that selling pressure may be easing.
The Ichimoku Cloud and EMA lines still show bearish signals, but key resistance levels could trigger a breakout if buying momentum strengthens. If HBAR can reclaim lost ground, it may test $0.248 soon, while further downside remains possible if support at $0.21 is lost.
HBAR DMI Shows the Downtrend Could Be Easing
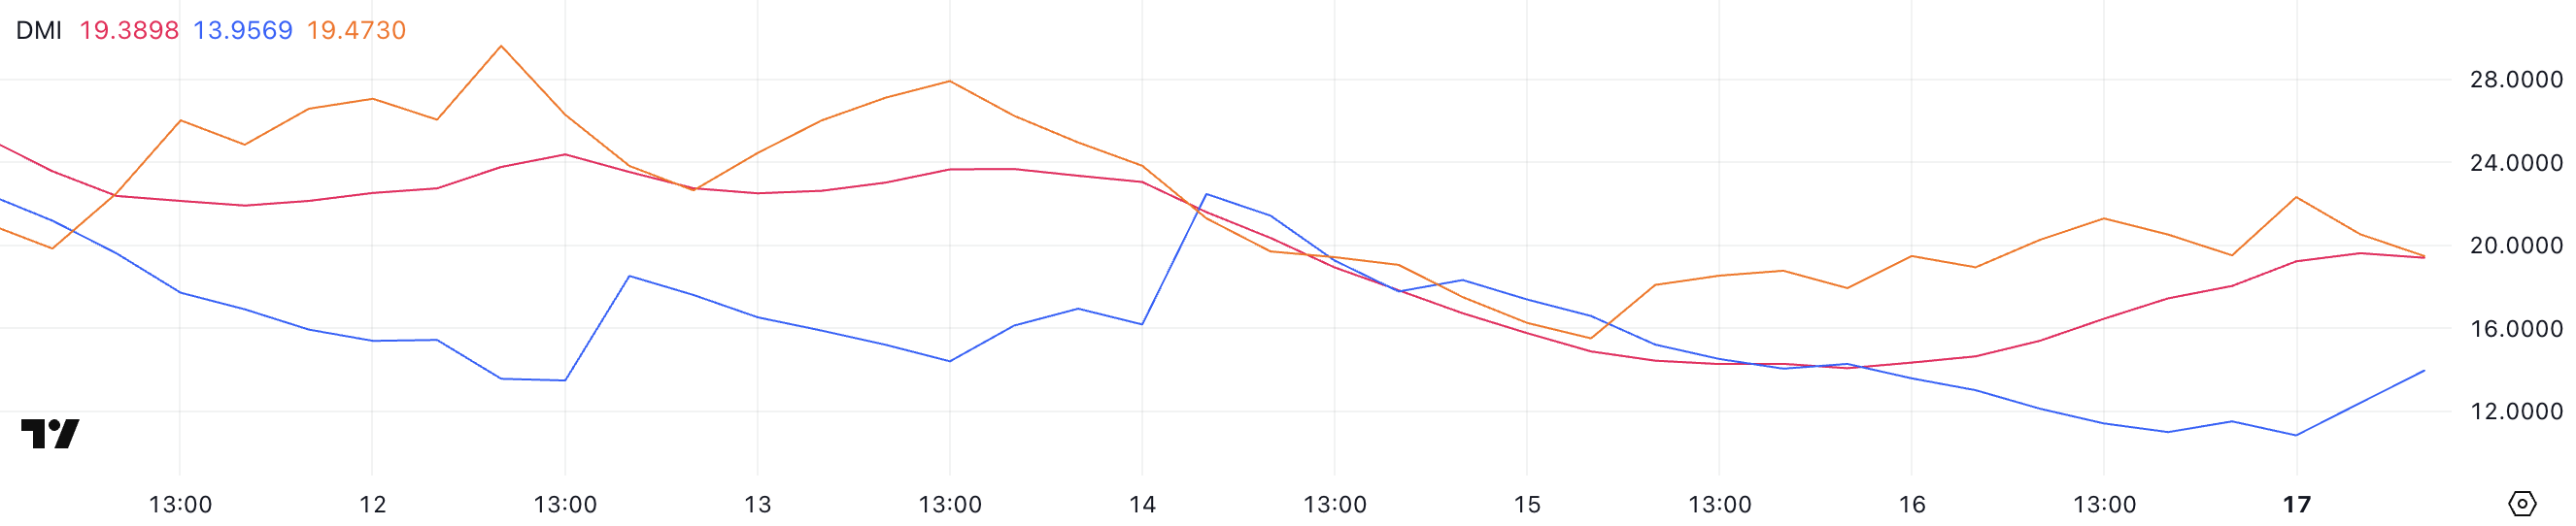
HBAR DMI chart shows its ADX has risen to 19.3 from 14.2 in the last two days, indicating a strengthening trend. The ADX (Average Directional Index) measures trend strength on a scale from 0 to 100, with values below 20 signaling a weak trend and above 25 indicating a stronger one.
Since ADX is still below 20 but rising, it suggests that Hedera downtrend could be stabilizing, though it hasn’t confirmed a strong directional move yet.
 HBAR DMI. Source: TradingView.
Looking at the directional indicators, +DI has risen to 13.9 from 10.9 after falling from 22.4 three days ago, while -DI has declined to 19.4 from 22.3. This suggests that selling pressure is easing while buying momentum is slowly recovering.
However, with -DI still above +DI, the downtrend remains intact. If +DI continues rising and crosses above -DI, it could signal a trend reversal, but for now, HBAR needs stronger buying momentum to shift out of its bearish phase.
Hedera Ichimoku Cloud Shows an Ongoing Bearish Setup
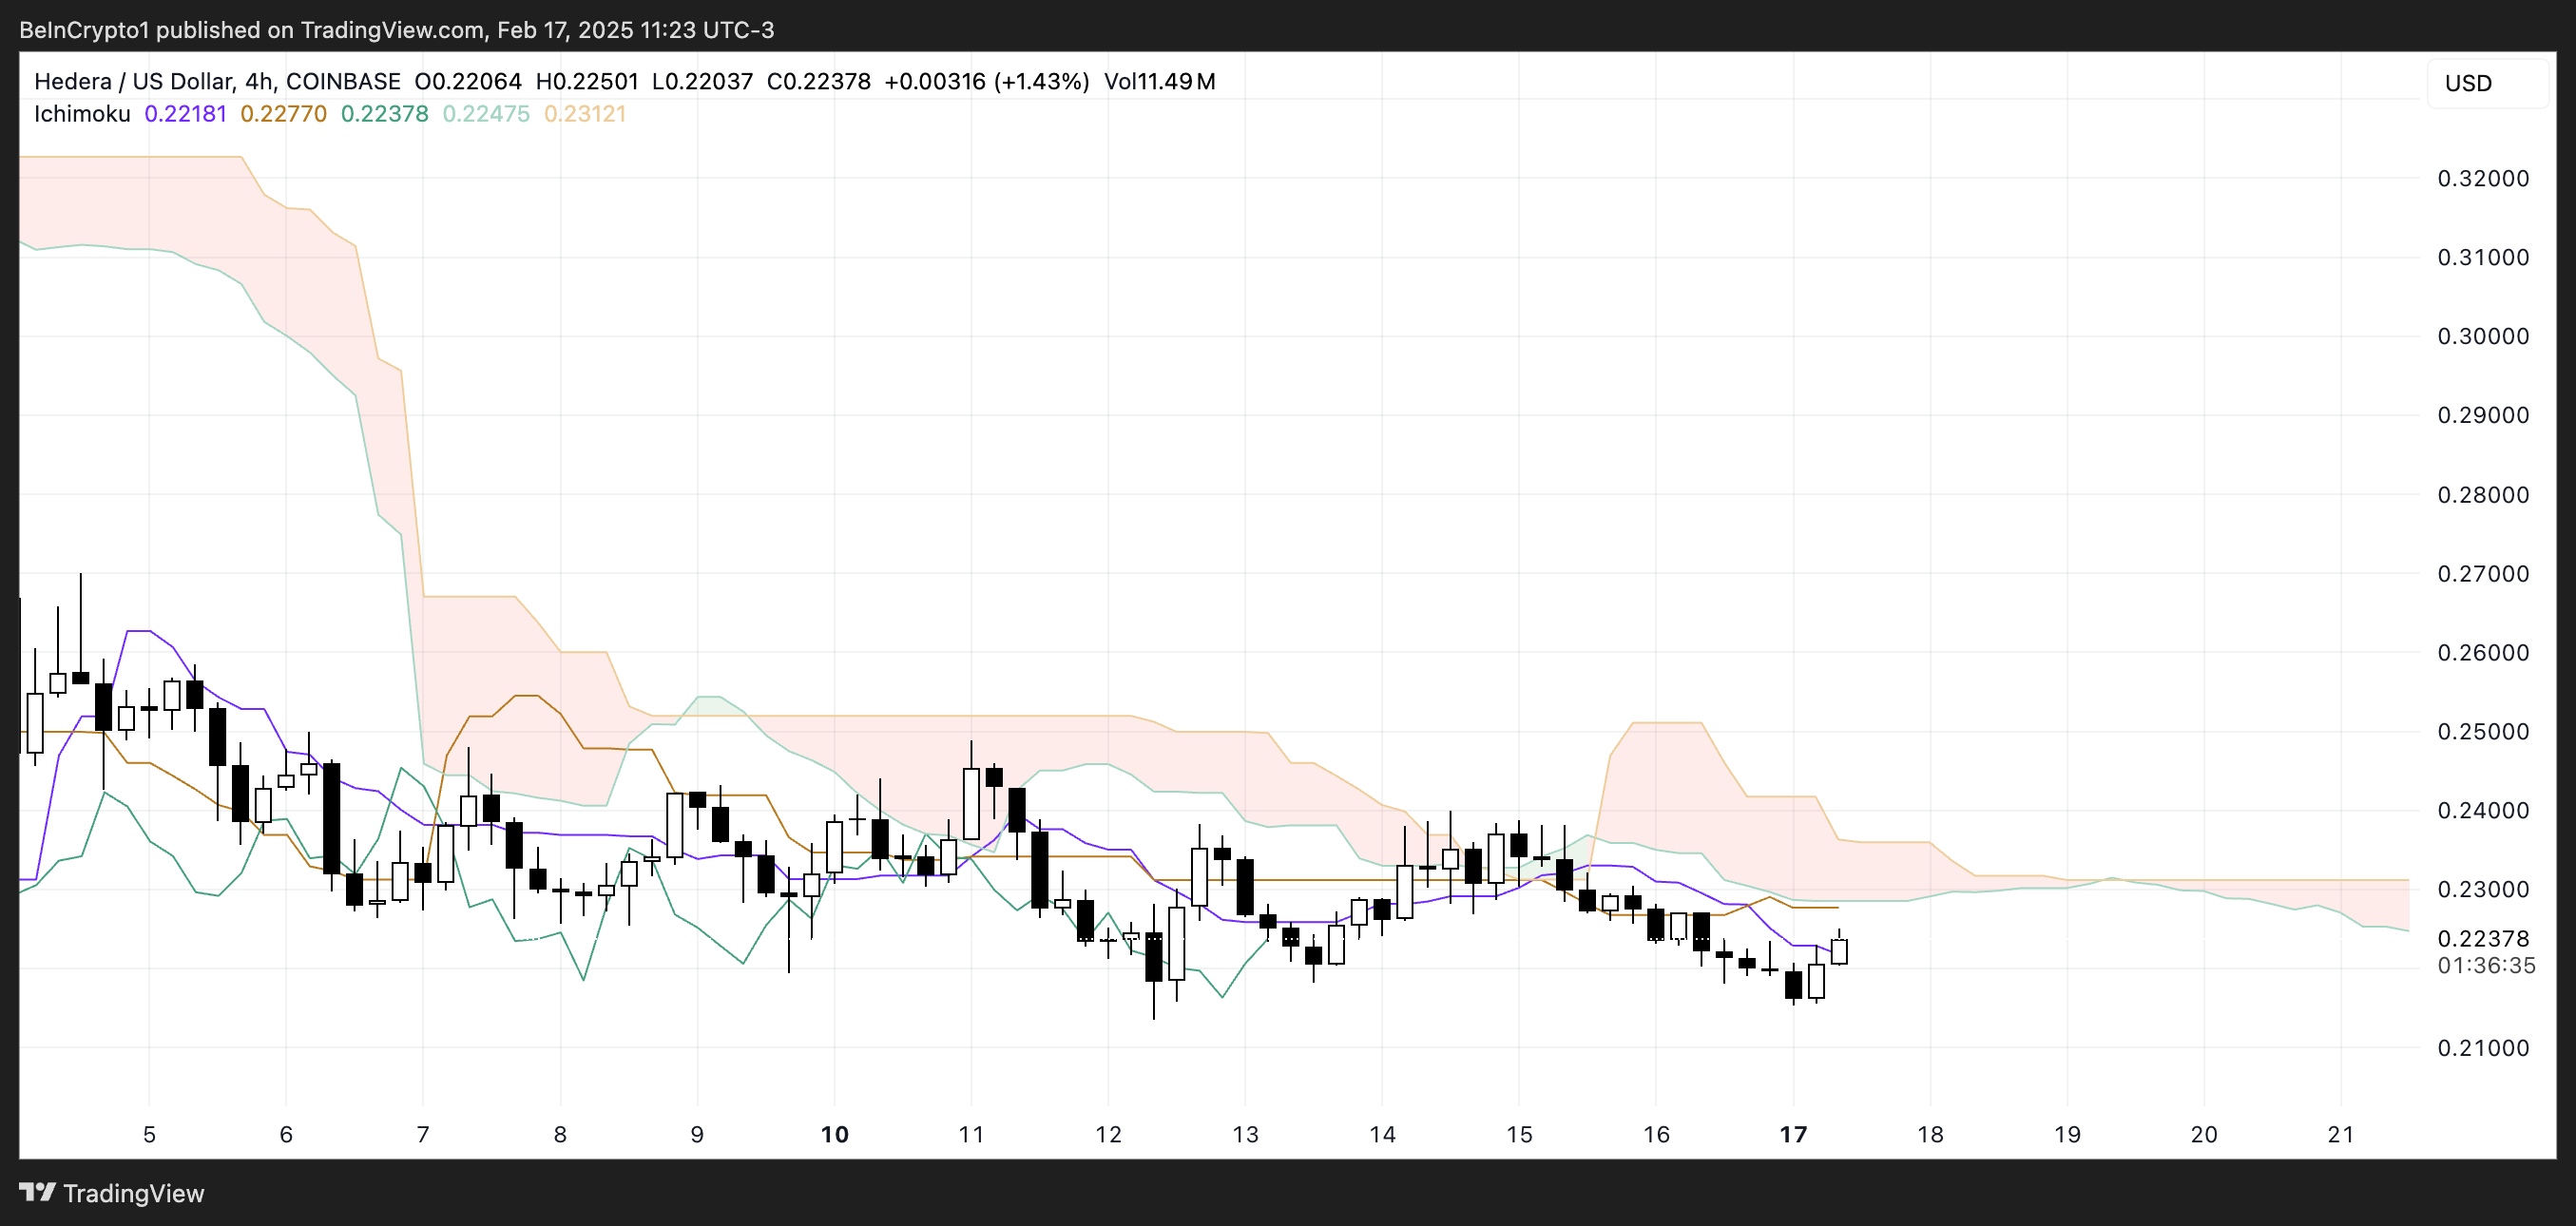
The Ichimoku Cloud for HBAR shows the price currently trading below the cloud, indicating a bearish trend. The cloud itself is red and projected forward, signaling potential resistance ahead.
The baseline (Kijun-sen) and conversion line (Tenkan-sen) are both flat, suggesting weak momentum. For a trend reversal, the price would need to break above the cloud, which currently sits around $0.23.
 HBAR Ichimoku Cloud. Source: TradingView.
The lagging span (Chikou Span) is still below the price action, confirming that bearish momentum is intact. However, a slight price rebound suggests an attempt to regain strength.
If Hedera breaks above the Tenkan-sen and Kijun-sen, it could challenge the lower edge of the cloud. A rejection at this level could lead to further downside, while a successful breakout above the cloud would be a strong bullish signal.
HBAR Price Prediction: Will Hedera Fall Below $0.2?
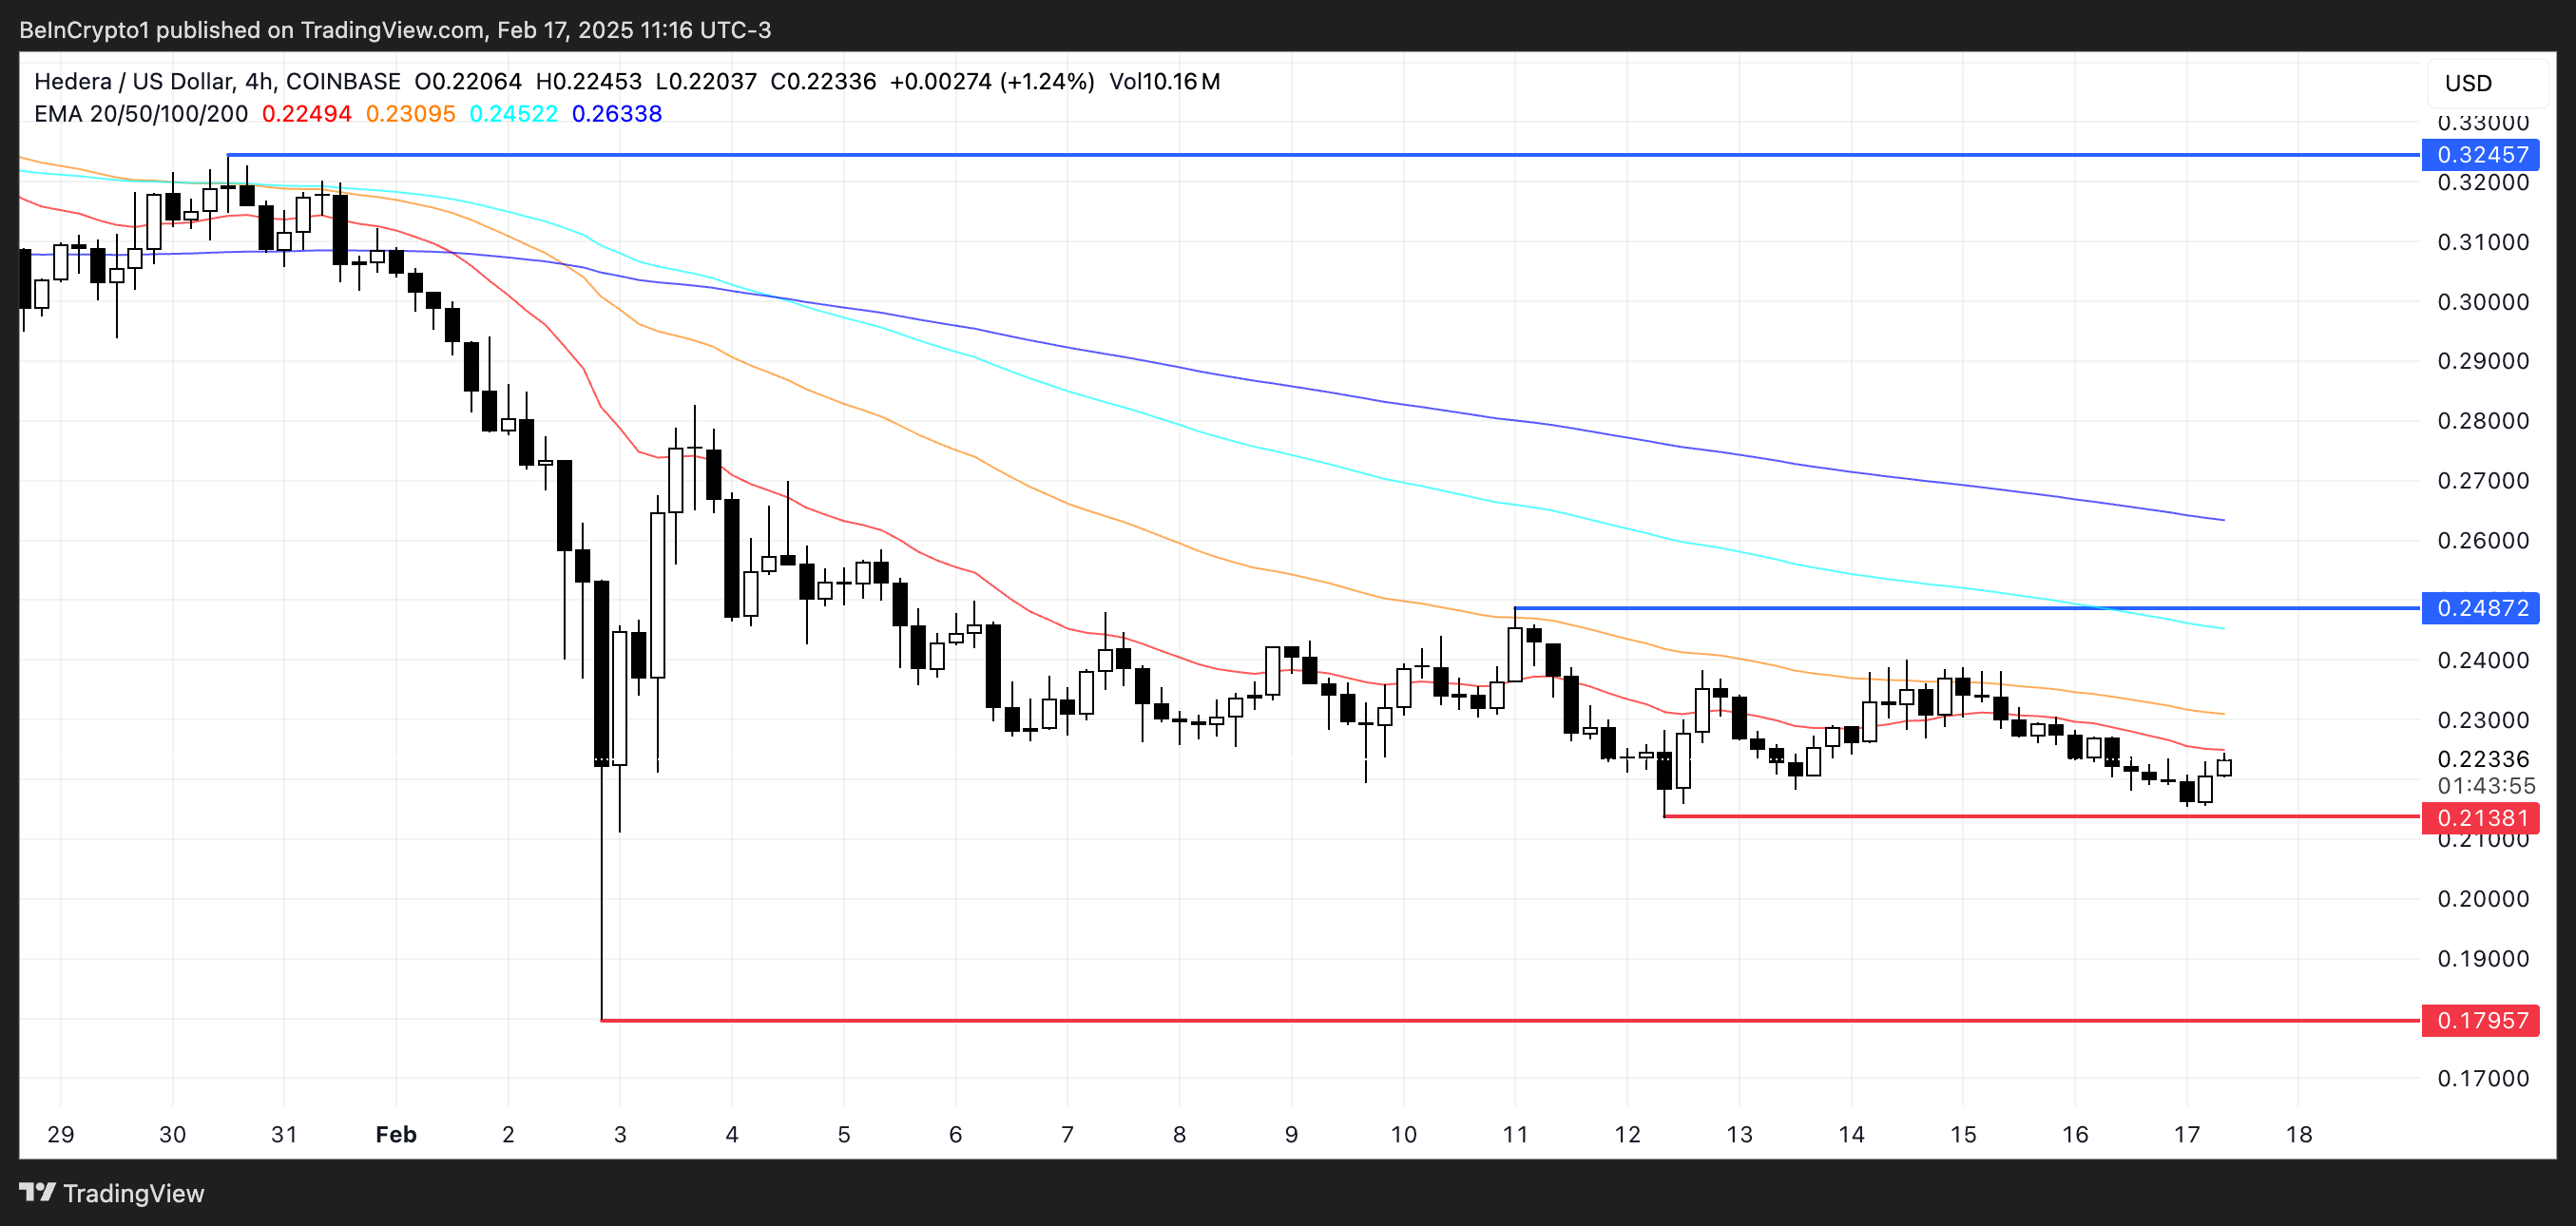
Hedera price chart shows its short-term EMA lines trading below the long-term ones, confirming a bearish trend. If the downtrend continues, HBAR could test the $0.21 support level, and losing that could push it further down to $0.179.
Selling pressure remains dominant, making these levels critical for bulls to defend.
 HBAR Price Analysis. Source: TradingView.
On the upside, if HBAR price can reverse its trend, the next resistance to watch is $0.248. A breakout above this level could strengthen bullish momentum, potentially sending the price toward $0.32, its highest level since late January.
However, for this to happen, HBAR needs a strong shift in momentum and increased buying pressure.
Recommended Articles


