

Will Litecoin Bounce Back? $113 Becomes Key After Recent Rejection

Source Newsbtc

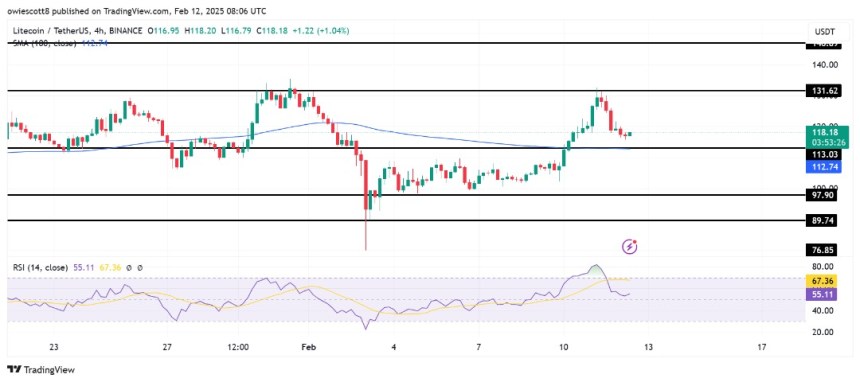
Litecoin recent price action has left traders at a crossroads as the cryptocurrency struggles to recover from a sharp rejection at $131. After an attempt to push higher, LTC failed to hold its momentum, turning $113 into a critical level that could shape its next move. With bullish hopes now hinging on this key support, can Litecoin bounce back, or is further downside inevitable?

The market is closely watching for signs of strength from buyers, as holding above this level will probably reignite upside momentum and set the stage for another rally. On the other hand, a breakdown could expose Litecoin to deeper losses, putting sellers in control.

With uncertainty looming, traders are bracing for LTC’s next big move. Let’s dive into the key technical levels and what they mean for LTC’s future.

LTC’s Rejection: What It Means For The Short-Term Trend

Following the rejection that halted bullish momentum at $131, Litecoin has continued to exhibit bearish tendencies, struggling to regain upward traction. The failure to break through this key resistance level has reinforced the dominance of sellers, leading to a pullback that now threatens the short-term optimistic outlook. 

With $131 acting as a formidable barrier, buyers were unable to sustain the rally, ultimately giving way to increased selling pressure. Its rejection suggests that many traders are choosing to lock in profits, reducing demand and weakening bullish momentum. A decline in buying interest at higher levels indicates hesitation among investors, possibly due to broader market uncertainties or a lack of confidence in future performances.
Litecoin

Additionally, key technical indicators are flashing caution signals. The Relative Strength Index (RSI), which measures momentum, is trending lower and approaching the 50% threshold, a critical level that often determines whether bullish or bearish sentiment prevails. 

A sustained drop below this level would reflect weakening buying strength and increasing selling pressure, reinforcing the potential for further downside movement.

What’s Next? Possible Scenarios For Litecoin Price

If the $113 support level holds strong, Litecoin may attract renewed buying interest, leading to a possible bounce. A surge in bullish momentum might allow LTC to reclaim lost ground and retest the $131 resistance level. Breaking above this barrier, supported by strong volume, might open the door for a rally toward $146.8 and beyond, signaling a continuation of the uptrend.

On the downside, if selling pressure intensifies and Litecoin falls below $113, the next major support levels to watch would be $97.9 and $89.7. Falling below these levels could trigger a deeper correction, putting LTC at risk of revisiting lower price zones.

Litecoin
Disclaimer: For information purposes only. Past performance is not indicative of future results.
placeholder
US dollar clings to nine-week lows near 98.4 as Brent nears $100 and the yen hits a seven-month high — five events to watch todayThe dollar is pinned near nine-week lows even after a blockbuster jobs report, as an oil spike toward $100, a surging yen and China's reflation data crowd the driver's seat. Five key events to watch today: Brent at $99.46, USD/JPY at 154, China CPI/PPI, PBOC gold buying, and Thursday's PPI / Friday's CPI ahead of the September 15-16 FOMC.
Author  Eric Nkando
Sep 09, Wed
The dollar is pinned near nine-week lows even after a blockbuster jobs report, as an oil spike toward $100, a surging yen and China's reflation data crowd the driver's seat. Five key events to watch today: Brent at $99.46, USD/JPY at 154, China CPI/PPI, PBOC gold buying, and Thursday's PPI / Friday's CPI ahead of the September 15-16 FOMC.
placeholder
US August CPI lands tonight: after a 5.4% PPI shock, will the Fed hike on September 16?US August PPI came in at 5.4% year-on-year, above the 5.3% consensus, with core PPI at 4.6%. Traders have pushed the odds of a 25bp Fed hike on September 15-16 to around 70%. Tonight's CPI is the last major inflation print before the decision — here is the full calendar, the consensus numbers, and what a hot versus cool reading would mean for the dollar, yields, gold and stocks.
Author  Irene Q.
Sep 11, Fri
US August PPI came in at 5.4% year-on-year, above the 5.3% consensus, with core PPI at 4.6%. Traders have pushed the odds of a 25bp Fed hike on September 15-16 to around 70%. Tonight's CPI is the last major inflation print before the decision — here is the full calendar, the consensus numbers, and what a hot versus cool reading would mean for the dollar, yields, gold and stocks.
placeholder
Brent tests $108 as a key export pipeline stays shut — can the rally clear $110?Brent crude rose 2.55% to $106.97 and WTI 2.32% to $102.30 as a major regional export pipeline remained offline with no restart timeline. Front-month backwardation has widened to $5.53 from $3.84 a week ago, European gas is at its highest since December 2022, and one analyst sees $119.48 if talks stall.
Author  Irene Q.
17 hours ago
Brent crude rose 2.55% to $106.97 and WTI 2.32% to $102.30 as a major regional export pipeline remained offline with no restart timeline. Front-month backwardation has widened to $5.53 from $3.84 a week ago, European gas is at its highest since December 2022, and one analyst sees $119.48 if talks stall.
placeholder
Fed hike odds near 90% into Wednesday's decision — how to trade the dollar, gold and the S&P 500A 0.3% monthly core CPI print has lifted the market-implied probability of a 25bp Fed hike on 16 September to roughly 86.5% ~ 90%, which would be the first increase since July 2023. Here is the decision timeline, the pricing versus the forecasts, both scenarios, and the key levels for the dollar, gold and the S&P 500.
Author  Suzie
16 hours ago
A 0.3% monthly core CPI print has lifted the market-implied probability of a 25bp Fed hike on 16 September to roughly 86.5% ~ 90%, which would be the first increase since July 2023. Here is the decision timeline, the pricing versus the forecasts, both scenarios, and the key levels for the dollar, gold and the S&P 500.
placeholder
Silver Price Forecast: XAG/USD falls to near $63.50 amid Fed hike bets, higher oil pricesSilver price (XAG/USD) loses its gains from the previous day, trading around $63.50 per troy ounce during Asian hours on Monday. Non-yielding Silver is currently facing significant headwinds driven by rising Federal Reserve (Fed) rate-hike expectations for the upcoming September decision.
Author  FXStreet
13 hours ago
Silver price (XAG/USD) loses its gains from the previous day, trading around $63.50 per troy ounce during Asian hours on Monday. Non-yielding Silver is currently facing significant headwinds driven by rising Federal Reserve (Fed) rate-hike expectations for the upcoming September decision.
goTop
quote