

Week Ahead: AI Coins take center stage ahead of Nvidia earnings
This week is going to be extremely interesting as Bitcoin price could form a local top, but AI-related altcoins are likely to explode due to up-coming market events.
Major events this week
February 19
- Pixel (PIXEL) - Binance Listing
- Pyth Network (PYTH) Paradex Open Beta launch
February 20
- Stellar (XLM) - Protocol 20 Upgrade Vote
February 21
- Nvidia (NVDA) Earnings just cover the news bit and implications on crypto,
- FOMC Minutes at 19:00 GMT
February 22
- Avalanche (AVAX) - $400M Token Unlock
- Pyth Network (PYTH) Council Elections
February 23
- Coinbase - Delisting $SNT
- Polygon (MATIC) - Aggregated Layer v1 Mainnet
February 25
- AltLayer (ALT) - $45M Token Unlock
As seen in the title, this week’s focus is going to be Artificial Intelligence (AI). To be specific, February 21 is when the Nvidia Corporation’s earnings are going to be announced. This stock-market event, as mentioned in previous publications, has been a major market mover for AI-related altcoins.
Read more
Why AI cryptocurrencies are rallying?
Fetch.AI breaks into massive rally alongside AI tokens, FET price hits two-year high
Crypto AI tokens outperform several altcoins with price rally: TAO, AKT, PRIME, AGIX
Here are five AI tokens showing strength this week.
- Arkham (ARKM)
- SingularityNET (AGIX)
- Ocean Protocol (OCEAN)
- iExecRLC (RLC)
- Numeraire (NMR)
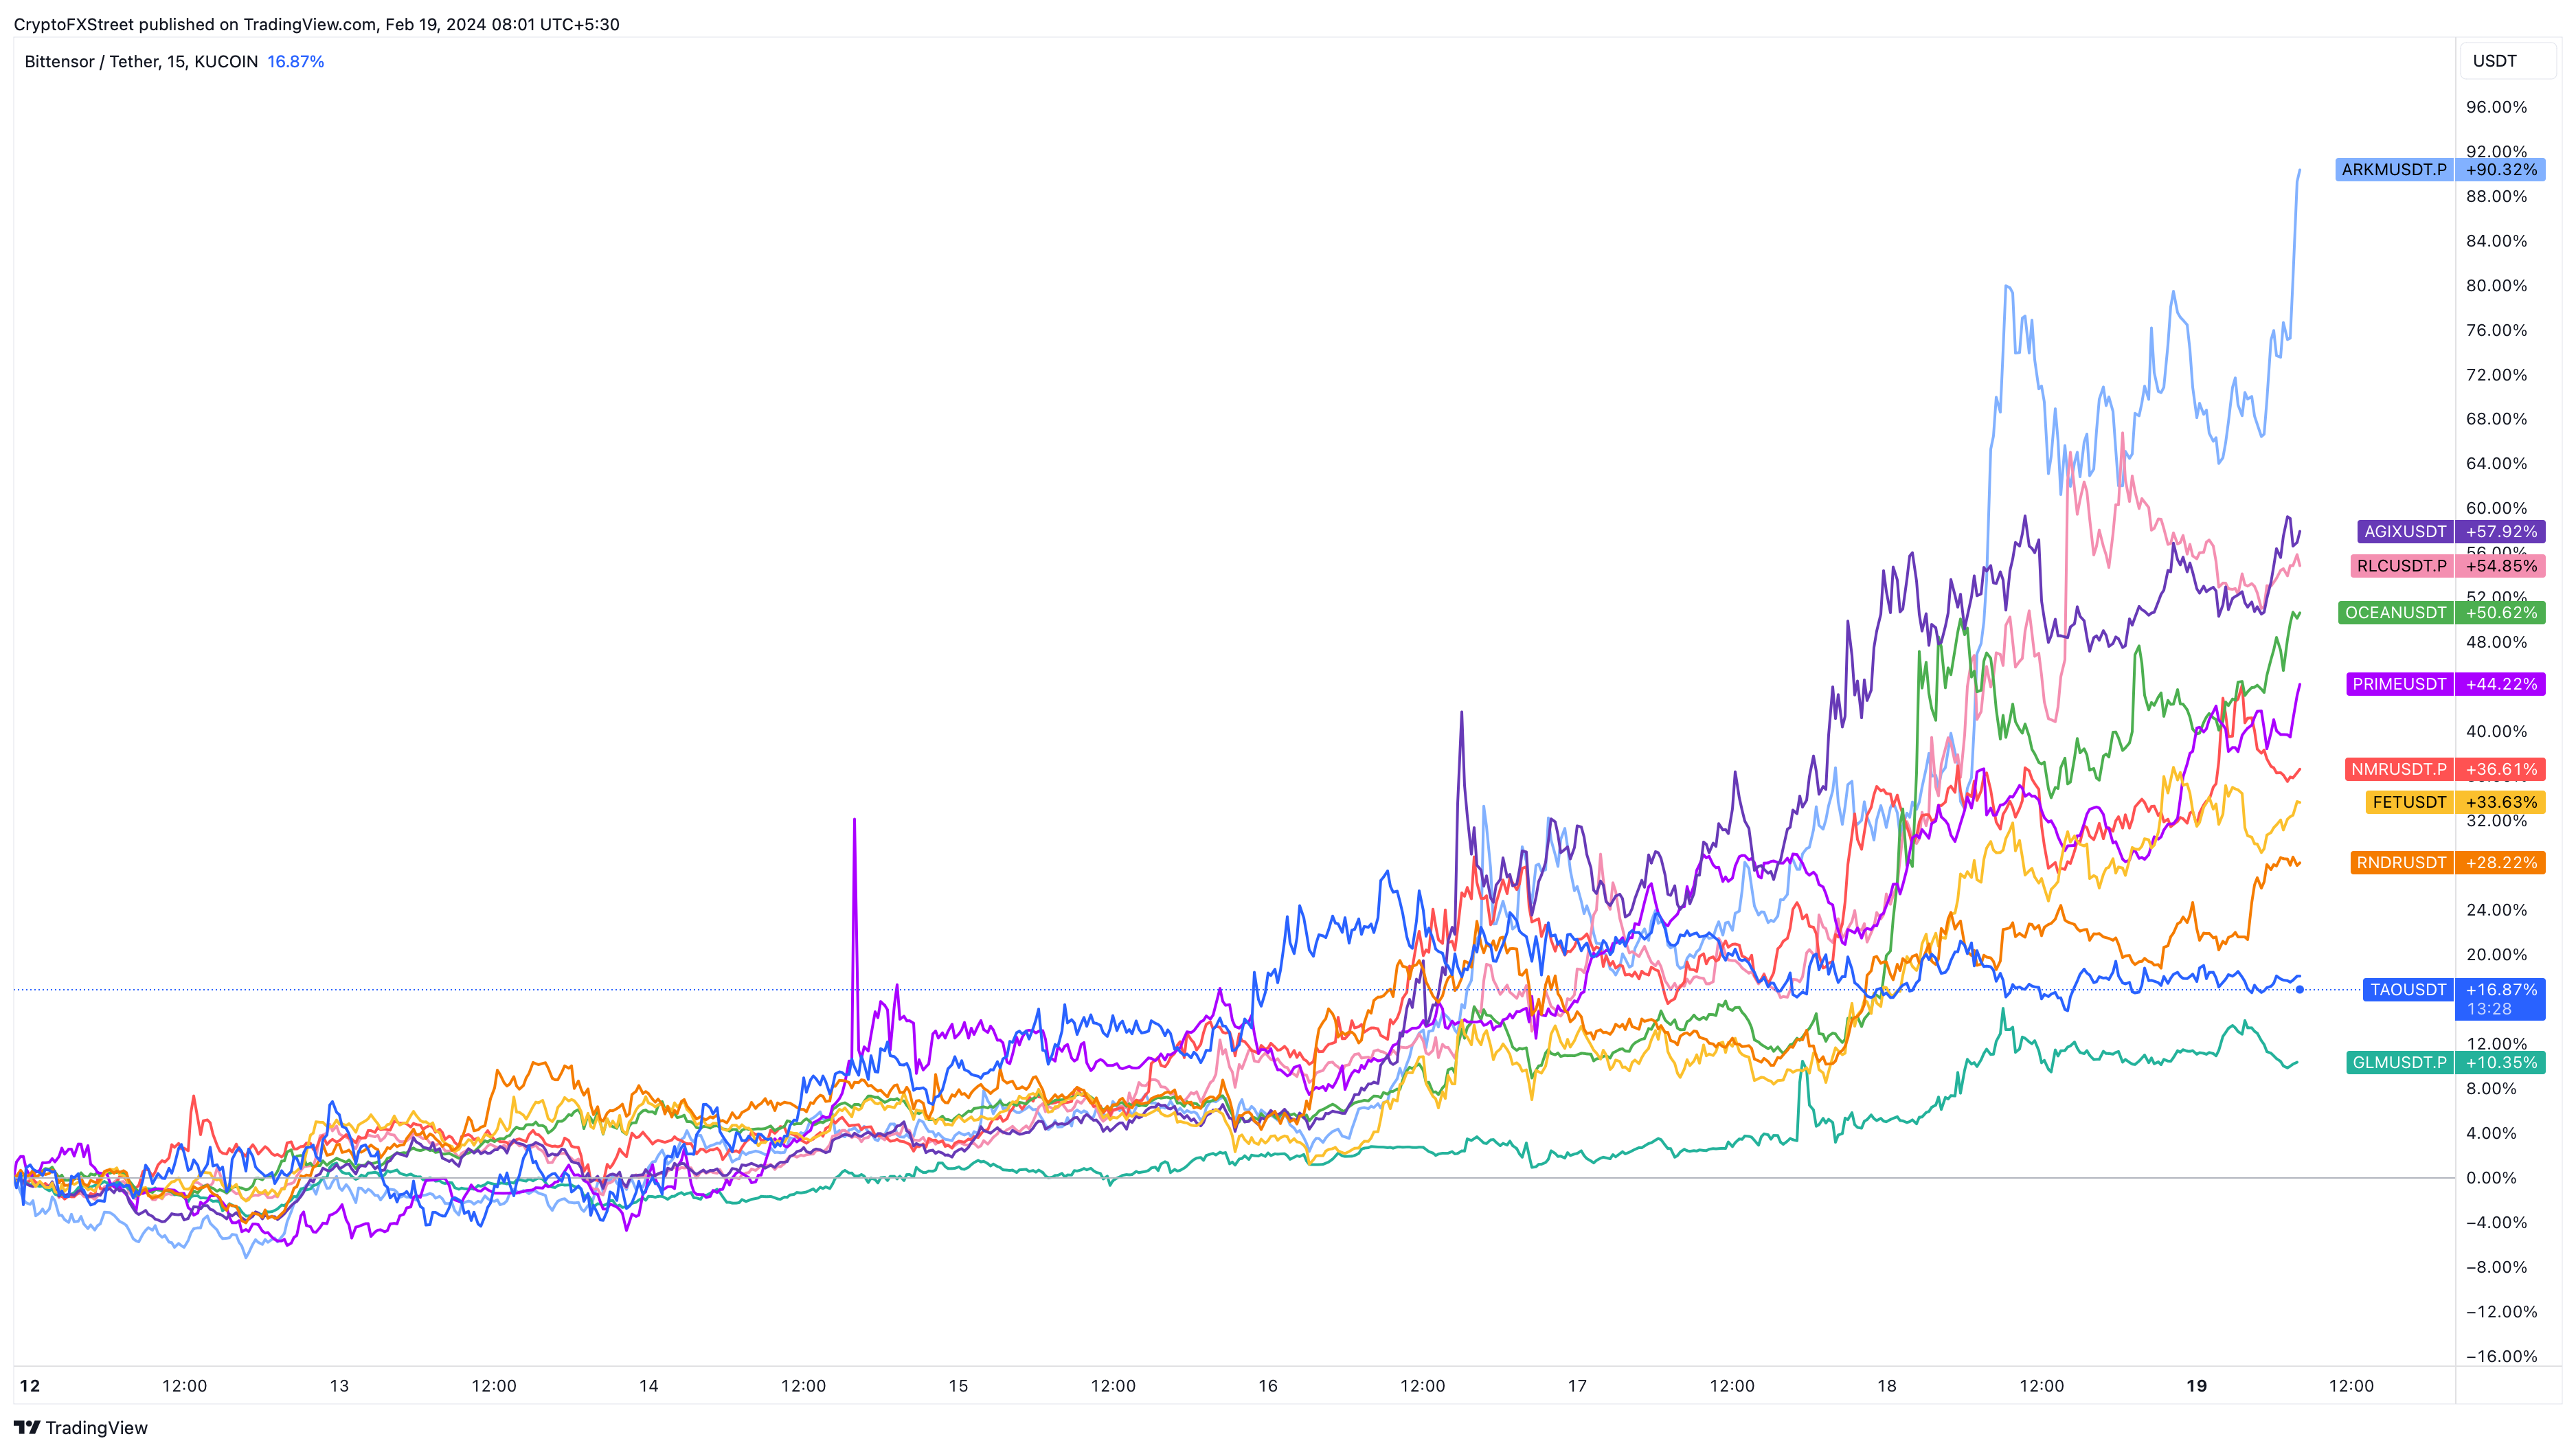
AI tokens
Bitcoin fractal hints at short-term correction
Bitcoin’s price action in September 2023 and January 2024 were similar as pointed out on February 7. Following the September 2023 moves, BTC rallied from roughly $42,000 to $52,000 in a week.
The price action that occurred between January 30 and February 1 seems to be repeating.
Here’s what the price fractal looks like now. If history were to repeat itself, Bitcoin price could slide to $49,556. Hence, investors need to be cautious as this drop could cause altcoins to nosedive as well.
AI-related altcoins that show strength, however, might not draw down as much as other tokens, but still, caution is advised. Coupling this fractal’s potential bearish outlook with the Federal Open Market Committee (FOMC) meeting on February 21, markets could get volatile.
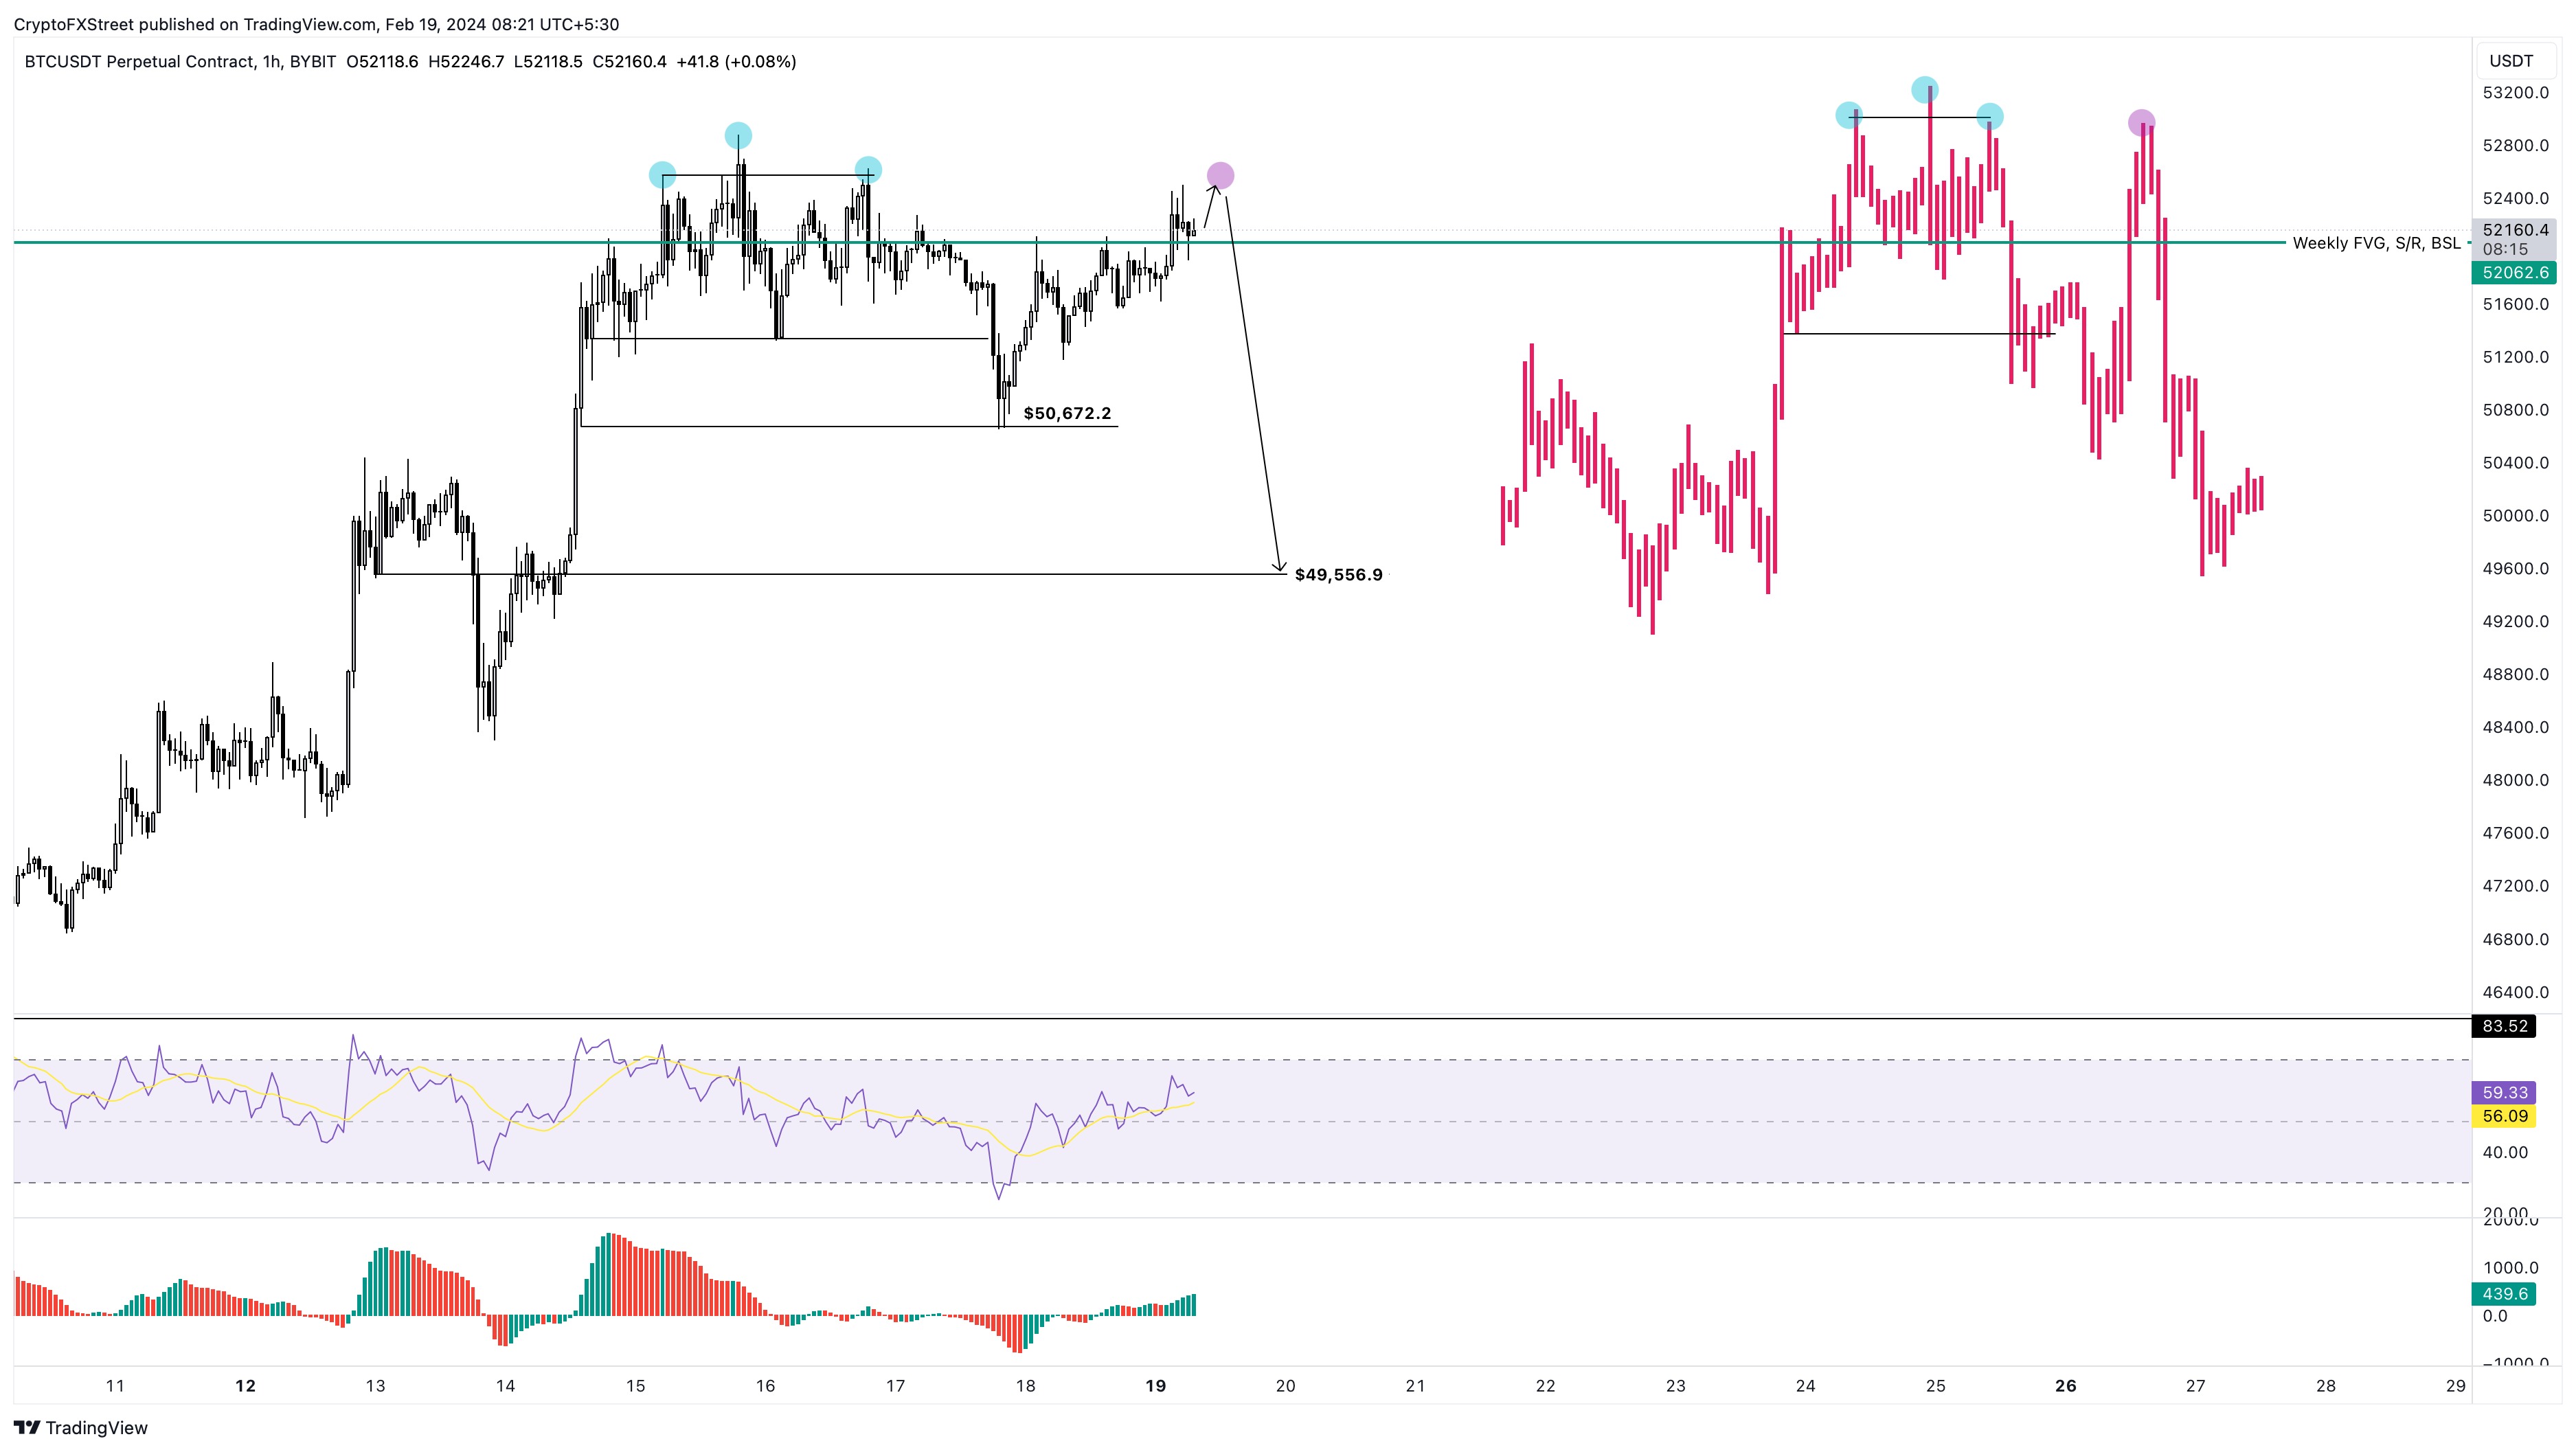
BTC/USDT 1-hour chart
Read more:
MANTA, DYDX, AVAX, ID, IMX: Five token unlocks to look out for next week
Chainlink’s large wallet holders pull $216 million worth of LINK out of exchanges, fuel gains
Arbitrum captures lion share of derivatives transaction volume, ARB price likely to revisit 2024 peak
SEI ventures into decentralized AI with Nimble, SEI price poised for rally
Recommended Articles


