

Dogecoin Starts Out February with 23% Crash, What Does Historical Data Point To?

Source Newsbtc

The Dogecoin price has started out this month with a crash, sparking a bearish sentiment among DOGE investors. This bearish sentiment is further strengthened by historical data, which suggests that these investors shouldn’t be too optimistic about the foremost meme coin recording significant gains this month. 

Dogecoin Starts February With 23% As Historical Data Paints Bearish Picture

CryptoRank data shows that the Dogecoin price has suffered a 23% crash since the start of February. This follows the monthly green close, which the foremost meme coin enjoyed in January, with a 4% gain in the first month of the year. Amid this price crash since the start of this month, historical data also points to a bearish outlook for DOGE throughout this month. 

Further data from CryptoRank shows that February is historically a bearish month for Dogecoin. The foremost meme coin has suffered a monthly average loss of 1% in February since it launched in 2013. DOGE has had only four monthly green closes in February over the last twelve years. 

However, it is worth mentioning that Dogecoin has only once closed out February with a loss of over 20%, which was in 2014, when its price crashed by over 30%. As such, the meme coin could still witness a relief bounce, which could lessen the severity of the 23% price crash suffered since the start of this month. 

Meanwhile, despite the historical data painting a bearish outlook for Dogecoin, crypto analysts have provided a bullish outlook for the meme coin. Crypto analyst Master Kenobi recently highlighted a similarity between DOGE’s current price action and that of the 2017 bull run. Based on the similarities, he predicted that Dogecoin could soon begin the next leg of its bull run, rallying above $1 and reaching a market peak sometime in April. 

DOGE Can Still Reach $10 In This Cycle

In an X post, crypto analyst Ali Martinez predicted that Dogecoin could still reach $10 in this market cycle. He stated that as long as DOGE holds above $0.19, the setup for a parabolic rally toward $10 remains strong. The analyst added that momentum is building for the foremost meme coin, indicating that it could soon begin the next leg of its bull run. 
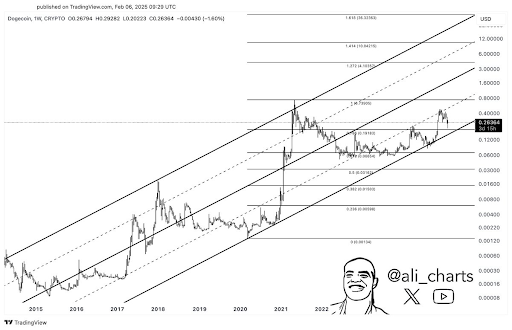
Dogecoin

Crypto analyst Trader Tardigrade predicted that Dogecoin could at least reach $4.5. He stated that DOGE’s Average Directional Index (ADX) signals a potentially massive bull run on the horizon. The ADX measures trend strength by quantifying the degree of directional movement in price. Analyzing the weekly chart, the analyst asserted that a “super strong trend” could happen soon and will reach its peak in the coming weeks as the meme coin reaches $4.5. 

At the time of writing, the Dogecoin price is trading at around $0.25, down over 4% in the last 24 hours, according to data from CoinMarketCap.

Dogecoin
Disclaimer: For information purposes only. Past performance is not indicative of future results.
placeholder
Crude Oil Price Forecast: Escalating US-Iran Tanker Attacks and Strait of Hormuz Risks Push Brent to $120? International oil prices continued to climb on Monday, extending their strong performance from the previous week.As military confrontations between the U.S. and Iran heat up again in and
Author  TradingKey
7 hours ago
International oil prices continued to climb on Monday, extending their strong performance from the previous week.As military confrontations between the U.S. and Iran heat up again in and
placeholder
Hot August jobs report reignites Fed-hike bets; S&P 500 slips below 7,700 — what to watch before the September FOMCAugust nonfarm payrolls surged to 162,000, three times the consensus, pushing CME FedWatch odds of a September 25-bp hike to 58.4% and dragging the S&P 500 below 7,700. CPI, PPI and the Sept 15-16 FOMC decision now set the tone for US stocks.
Author  Irene Q.
11 hours ago
August nonfarm payrolls surged to 162,000, three times the consensus, pushing CME FedWatch odds of a September 25-bp hike to 58.4% and dragging the S&P 500 below 7,700. CPI, PPI and the Sept 15-16 FOMC decision now set the tone for US stocks.
placeholder
Today’s Market Recap: Nonfarm Payrolls Far Exceed Expectations, Fed Rate Hike Expectations Heat Up, Micron Surges 6% Against the Trend, SanDisk Jumps Over 10%Tracking Market TrendsTradingKey - On September 4, Eastern Time, the three major US stock indices closed lower across the board. US August non-farm payrolls data far exceeded market expectations, rein
Author  TradingKey
16 hours ago
Tracking Market TrendsTradingKey - On September 4, Eastern Time, the three major US stock indices closed lower across the board. US August non-farm payrolls data far exceeded market expectations, rein
placeholder
Top 3 Price Prediction: Bitcoin, Ethereum, Ripple – BTC, ETH and XRP await US NFP for next directional moveBitcoin (BTC), Ethereum (ETH) and Ripple (XRP) extend their weekly gains on Friday as traders await the US Nonfarm Payrolls (NFP) report for the next directional catalyst.
Author  FXStreet
Sep 04, Fri
Bitcoin (BTC), Ethereum (ETH) and Ripple (XRP) extend their weekly gains on Friday as traders await the US Nonfarm Payrolls (NFP) report for the next directional catalyst.
placeholder
Yen hits one-month high on BOJ September-hike bets; AUD/JPY cracks support as carry unwindsUSD/JPY has tumbled from the 160 area to a one-month low near 155.2 in two sessions as Bank of Japan hike bets for the Sept 17-18 meeting intensify. AUD/JPY has broken below 112.7, flagging carry-trade stress. A test of 155.21 - and then 153 - is now in focus.
Author  Suzie
Sep 04, Fri
USD/JPY has tumbled from the 160 area to a one-month low near 155.2 in two sessions as Bank of Japan hike bets for the Sept 17-18 meeting intensify. AUD/JPY has broken below 112.7, flagging carry-trade stress. A test of 155.21 - and then 153 - is now in focus.
goTop
quote