


XRP price hits $0.5590 riding on Bitcoin’s recent gains, sees spike in on-chain activity
- XRP price hit a high of $0.5590 on Thursday as Bitcoin’s price rally fueled gains in top altcoins.
- XRP trade volume nearly doubled this week, climbing to 1.46 billion on February 15.
- Pro-Ripple attorney condemns the SEC’s lawsuit against Ripple in response to Chair Gary Gensler’s comments on crypto.
XRP price hit a peak of $0.5590, early on Thursday. Altcoins like XRP noted gains as Bitcoin price rallied past the resistance to $52,500. Bitcoin bull run ushered a marketwide recovery in altcoin prices.
XRP on-chain activity likely catalyzed the recent gains alongside other developments in the Ripple ecosystem.
Also read: Bitcoin inches closer to $52,000, liquidates over $72 million in short positions
Daily Digest Market Movers: XRP on-chain metrics show surge in activity
- According to data from crypto intelligence tracker, Santiment, the Volume in XRP nearly doubled from 578.41 million on February 10 to 1.48 billion on February 15. The surge in Volume implies demand and relevance of XRP has increased, among market participants.
%20[11.00.13,%2015%20Feb,%202024]-638435743135462047.png)
XRP Volume. Source: Santiment
- Ripple recently revealed its plans to expand into the custody business with its acquisition of Standard Custody. As the payment giant pivots from its cross-border payment remittance business and expands to related infrastructure services for financial firms, it is likely to boost the demand for XRPLedger’s services. Find out more about it here.
- Bitcoin price rallied to a peak of $52,500 on Thursday, catalyzing a rally in altcoins in the ecosystem. XRP price climbed to a peak of $0.5590, alongside BTC.
Technical Analysis: XRP price rallies towards its $0.60 target
XRP price is currently in an uptrend. The altcoin is rallying towards its $0.60 target, a psychologically important level for the asset. XRP price faces resistance at its 50% Fibonacci Retracement level of decline from 2024 peak of $0.6405 to its January low, at $0.5629.
XRP price rally to $0.60 represents a climb of over 10%. The green bars on the Moving Average Convergence/ Divergence (MACD) and Awesome Oscillator (AO) indicators, suggest that XRP price uptrend is intact and there is positive momentum.
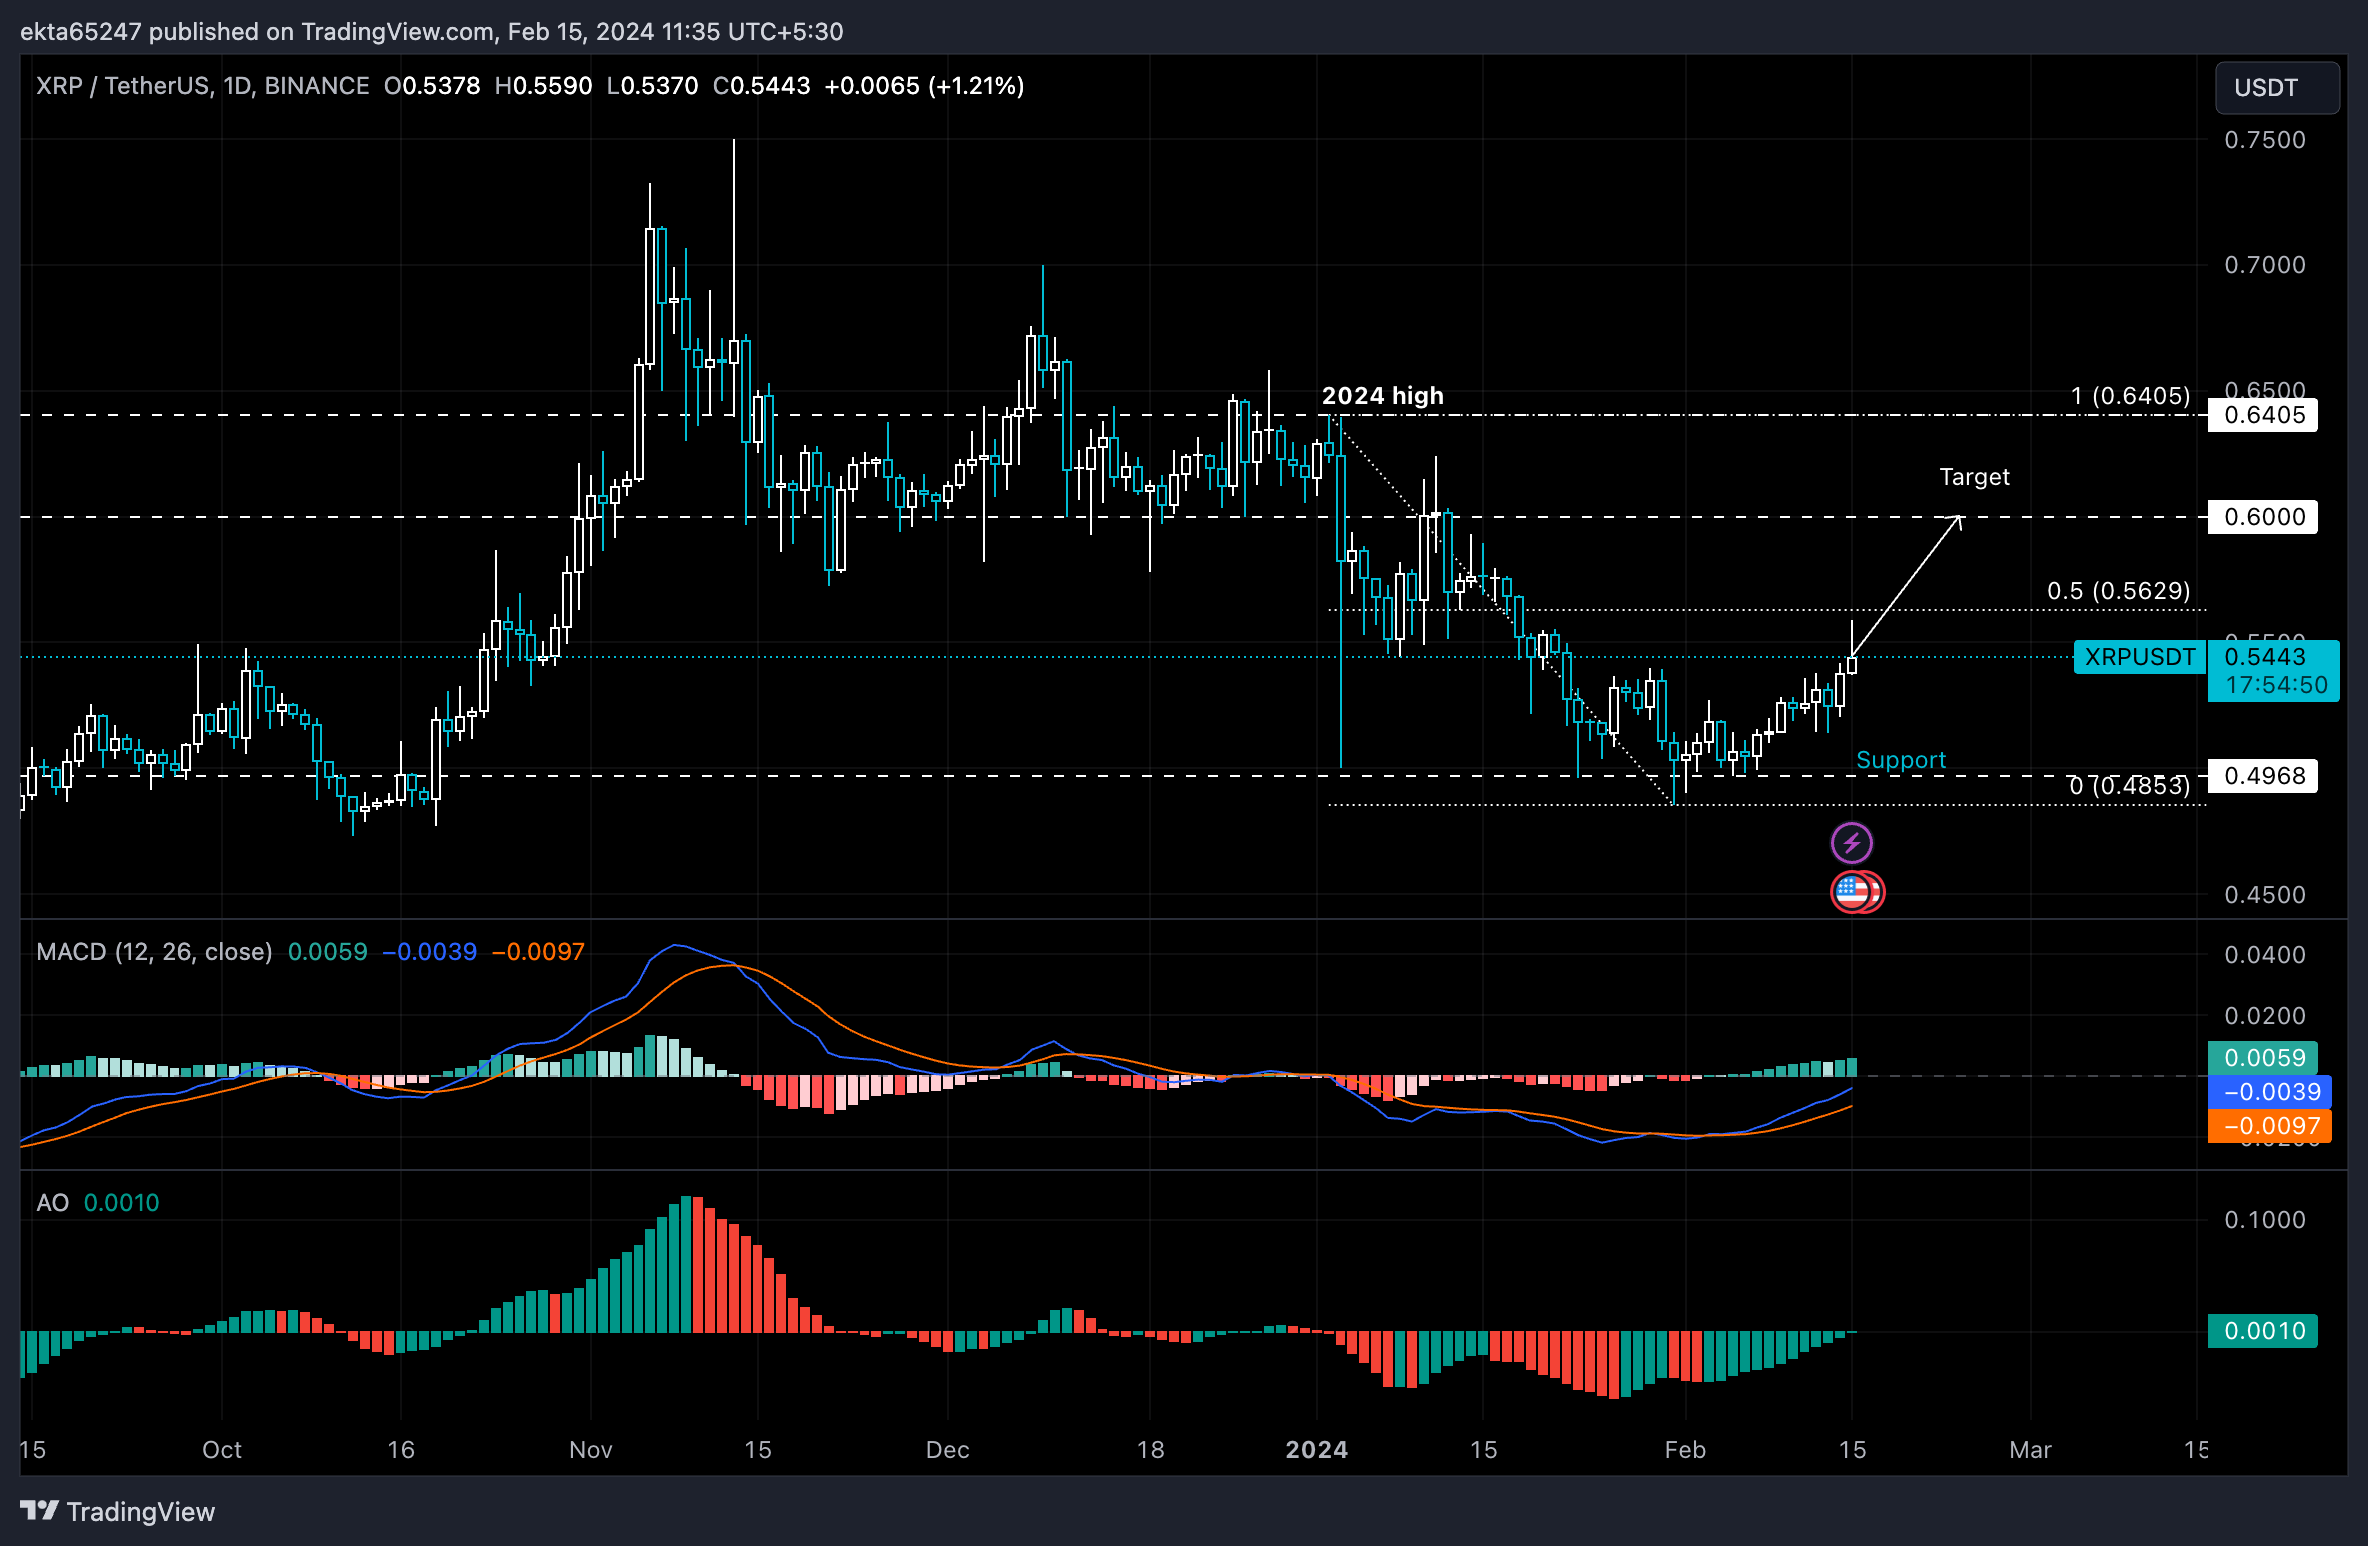
XRP/USDT 1-day chart
A daily candlestick close below the $0.50 level could invalidate the bullish thesis and signal a sweep of the January low at $0.4853 before XRP price recovery.
Bitcoin, altcoins, stablecoins FAQs
What is Bitcoin?
Bitcoin is the largest cryptocurrency by market capitalization, a virtual currency designed to serve as money. This form of payment cannot be controlled by any one person, group, or entity, which eliminates the need for third-party participation during financial transactions.
What are altcoins?
Altcoins are any cryptocurrency apart from Bitcoin, but some also regard Ethereum as a non-altcoin because it is from these two cryptocurrencies that forking happens. If this is true, then Litecoin is the first altcoin, forked from the Bitcoin protocol and, therefore, an “improved” version of it.
What are stablecoins?
Stablecoins are cryptocurrencies designed to have a stable price, with their value backed by a reserve of the asset it represents. To achieve this, the value of any one stablecoin is pegged to a commodity or financial instrument, such as the US Dollar (USD), with its supply regulated by an algorithm or demand. The main goal of stablecoins is to provide an on/off-ramp for investors willing to trade and invest in cryptocurrencies. Stablecoins also allow investors to store value since cryptocurrencies, in general, are subject to volatility.
What is Bitcoin Dominance?
Bitcoin dominance is the ratio of Bitcoin's market capitalization to the total market capitalization of all cryptocurrencies combined. It provides a clear picture of Bitcoin’s interest among investors. A high BTC dominance typically happens before and during a bull run, in which investors resort to investing in relatively stable and high market capitalization cryptocurrency like Bitcoin. A drop in BTC dominance usually means that investors are moving their capital and/or profits to altcoins in a quest for higher returns, which usually triggers an explosion of altcoin rallies.
Recommended Articles


