

Ethereum is underperforming, while Ripple and Solana take the lead
- Ethereum market capitalization fell 4.7%; Ripple and Solana surged by 36.9% and 32.2%, respectively, in one month.
- Alexander Pack explains how Ethereum’s modular approach has hurt the ETH price due to reduced fees and less token burn.
- Santiment data suggest the growing negativity in social media surrounding ETH could serve as a bullish signal for contrarian investors.
Ethereum (ETH) price trades around $3,200 while Ripple (XRP) and Solana (SOL) hovers around $3.13 and $250, respectively, on Thursday. Santiment data shows that ETH market capitalization fell 4.7%, while XRP and SOL surged 36.9% and 32.2% in one month. Alexander Pack explains how Ethereum’s modular approach has hurt the ETH price due to reduced fees and less token burn. Santiment data suggest the growing negativity in social media surrounding ETH could serve as a bullish signal for contrarian investors.
Ethereum’s market cap dips while Ripple and Solana rise
According to Santiment’s data, Ethereum’s market capitalization fell while Ripple and Solana market capitalization rose in one month.
As shown in the graph below, from December 21 to January 21, ETH market capitalization fell 4.7%, while XRP and SOL surged by 36.9% and 32.2%. This indicates that the crowd has been slowly but surely turning against ETH (crypto’s second market cap) in favor of more exciting and outperforming assets like XRP (crypto’s third market cap) and SOL (crypto’s fourth market cap).
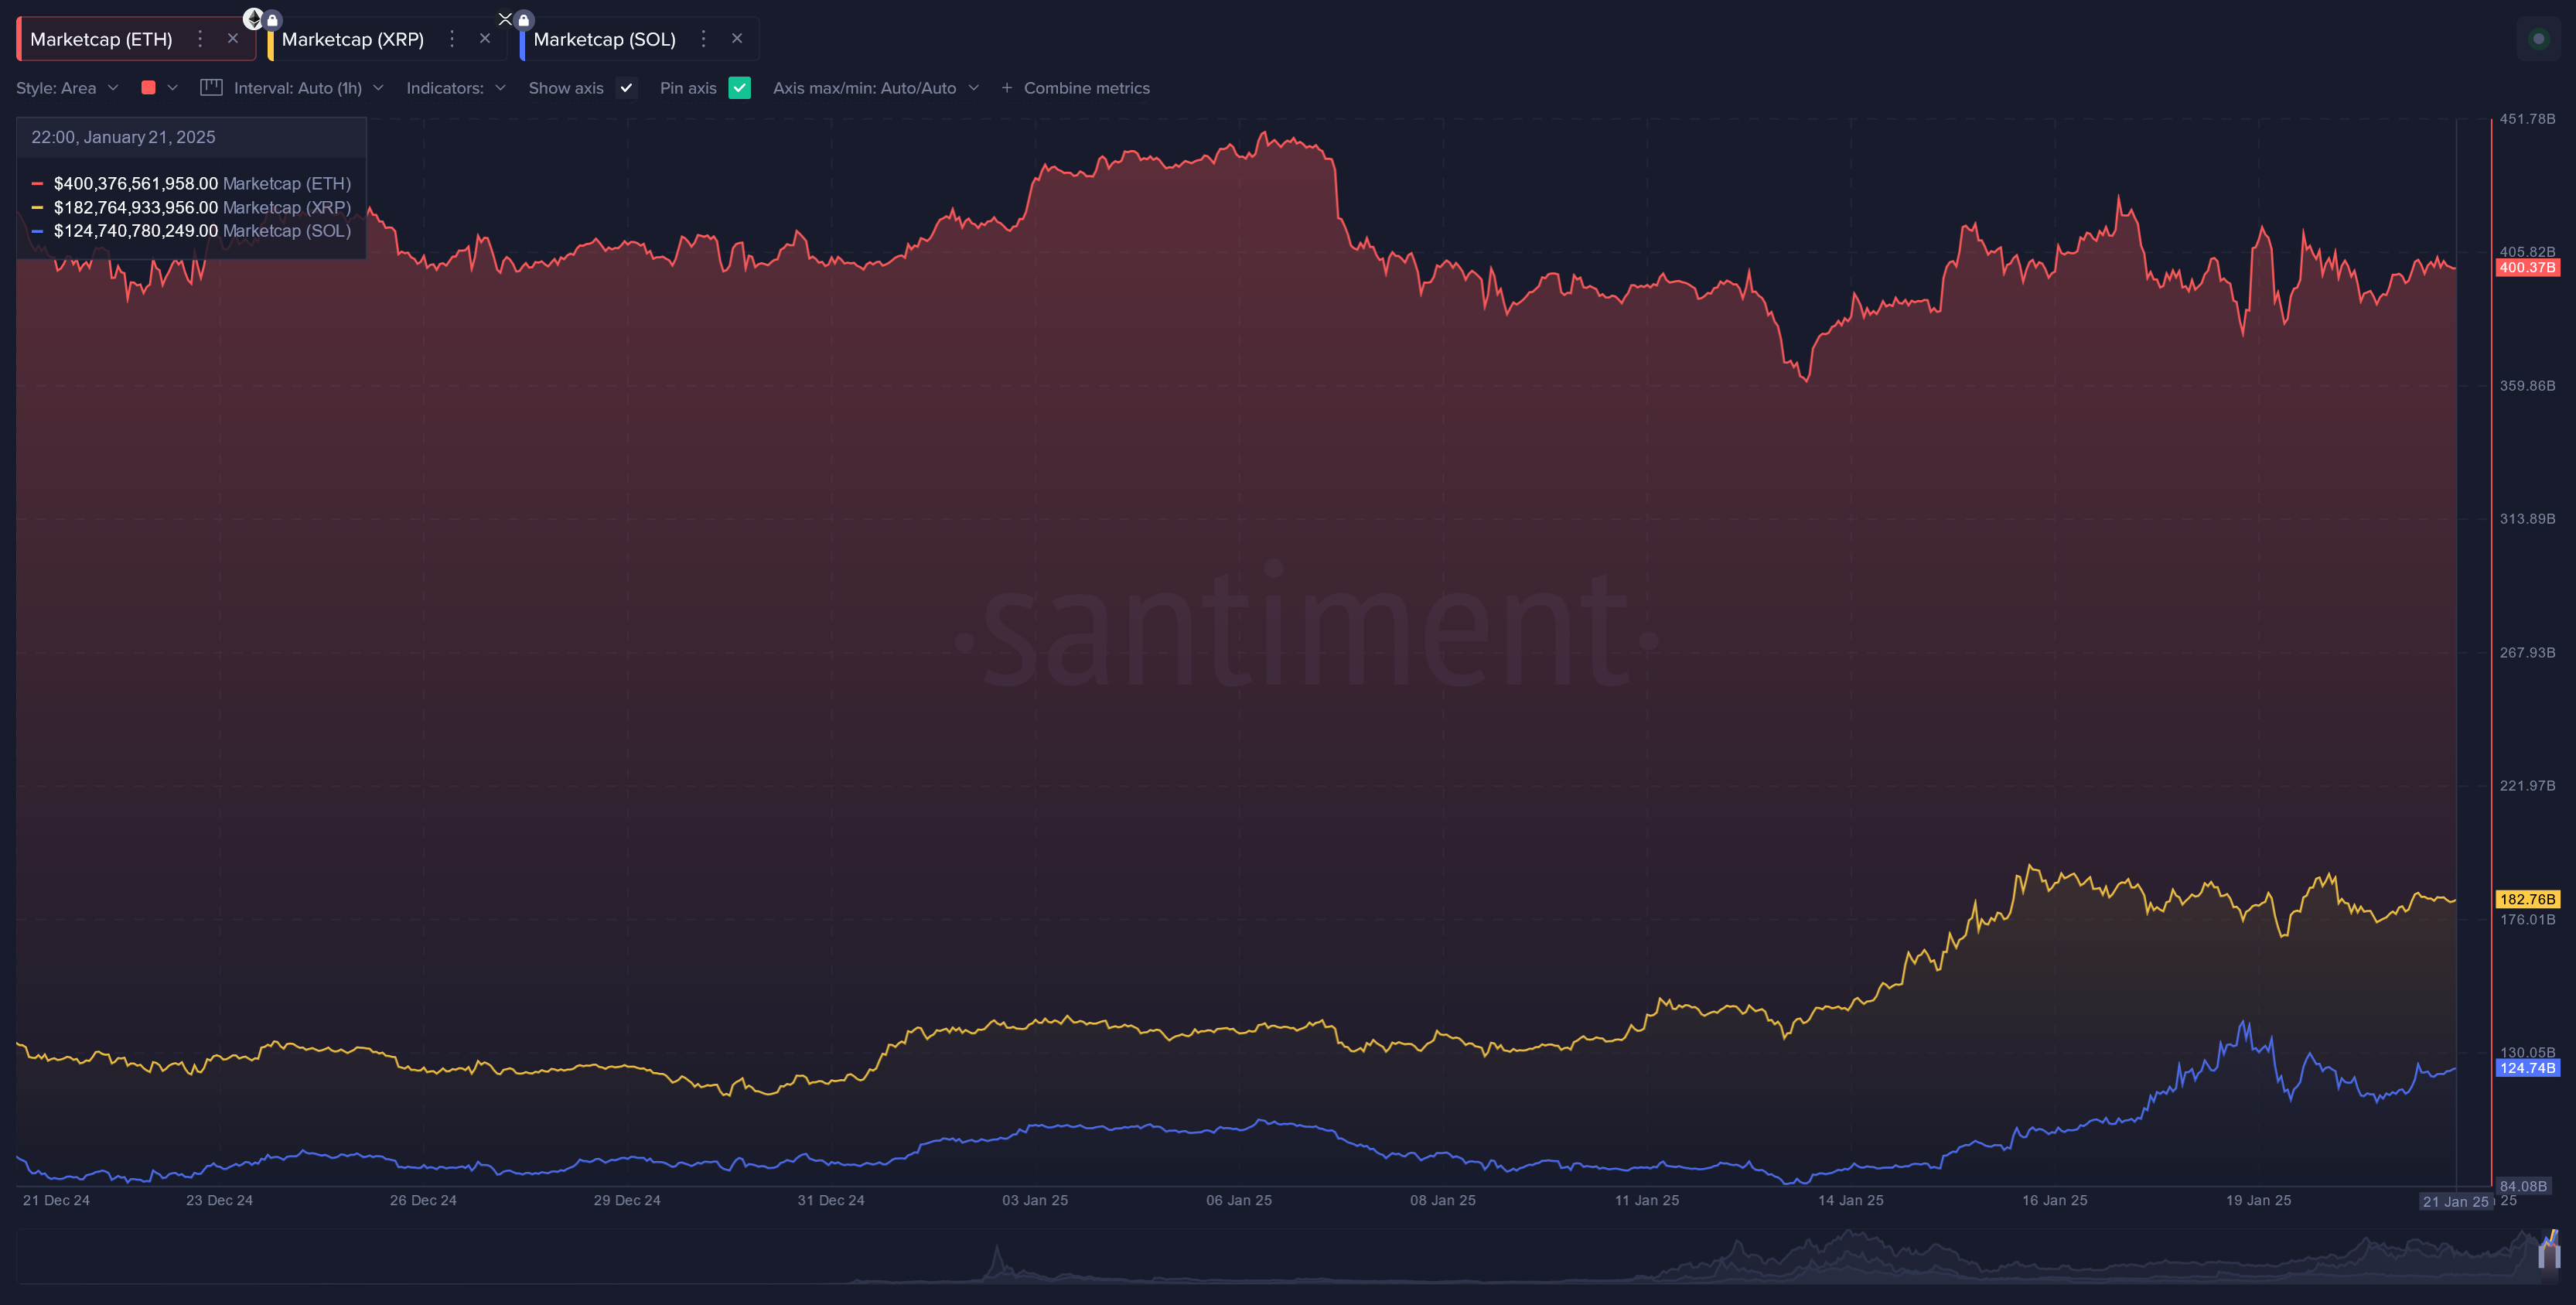
Market Capitalization of ETH, XRP and SOL. Source: Santiment
Apart from the decreasing market capitalization of Ethereum, the crowd has gone after Vitalik Buterin, founder of ETH, for periodically selling off large amounts of ETH, sparking reactions from the cryptocurrency community. Buterin sold around 90,000 ETH (worth over $100 million) in May 2021 and $12 million worth of ETH in March 2023.
He explained that some of these sales were to fund personal expenses or support projects related to Ethereum. However, these actions often lead to concerns among traders and multi-week-long selloffs. Moreover, traders see it as a signal that Buterin might not have full confidence in Ethereum’s future, which can cause the price of ETH to drop as others follow suit and send mixed signals to the market.
Ethereum’s modular approach has hurt its price
According to Alexander Pack, co-founder of Hack VC, a web3 venture capital firm, X post highlights how Ethereum’s shift towards a modular architecture has hurt its price.
“The main culprit of ETH underperformance has been a very intentional, strategic decision that Ethereum made almost five years ago,” says Alexander Pack.
Instead of Ethereum handling all aspects of the platform (execution, settlement, data availability, sequencing, etc.), they intentionally let other projects offer those services in a composable way. This approach, called modularization, means Ethereum relies on separate projects to handle tasks like processing transactions and ensuring security. While this has helped Ethereum grow its ecosystem, it has hurt the value of its main token, ETH, in the short term. Fees on the network have gone down, so less ETH gets burned (removed from circulation), which lowers its price. Additionally, new modular projects with their tokens are taking away some of the attention and investment that used to go to ETH.
1/ ETH is underperforming BTC and SOL big time this cycle. The reason? Many think that it’s Ethereum’s choice to go modular. Was this a strategic misstep? We pulled a bunch of data and have some answers. pic.twitter.com/eAgqpLX5a2
— Alexander Pack (@alpackaP) November 12, 2024
“The decision to modularize, however, is part of a bigger plan to prepare Ethereum for the future. By working with these smaller, specialized projects (called Layer 2 solutions), Ethereum can grow and keep up with new technology that improves how blockchains work. Even though Ethereum now shares the spotlight with other blockchains, it has still managed to keep about 75% of its market share over the last nine years—a much smaller drop than similar tech companies like Amazon Web Services, which fell to about 35%. This modular strategy ensures that Ethereum can stay relevant and adapt to changes, even if it means making sacrifices today.” according to the Santiment report.
The report concluded that Ethereum’s modularization choice could help it stay ahead. By supporting innovation and creating a larger, more advanced ecosystem, Ethereum can continue to attract developers and users. This forward-thinking approach gives Ethereum the tools to remain one of the leading platforms in the blockchain world, even as the industry evolves.
Some optimistic signs for Ethereum
The Santiment report highlights some optimistic signs for Ethereum in the long term. The report explains that Ethereum’s utility looks better than average, with rising daily active addresses, particularly as January 2025 progresses.
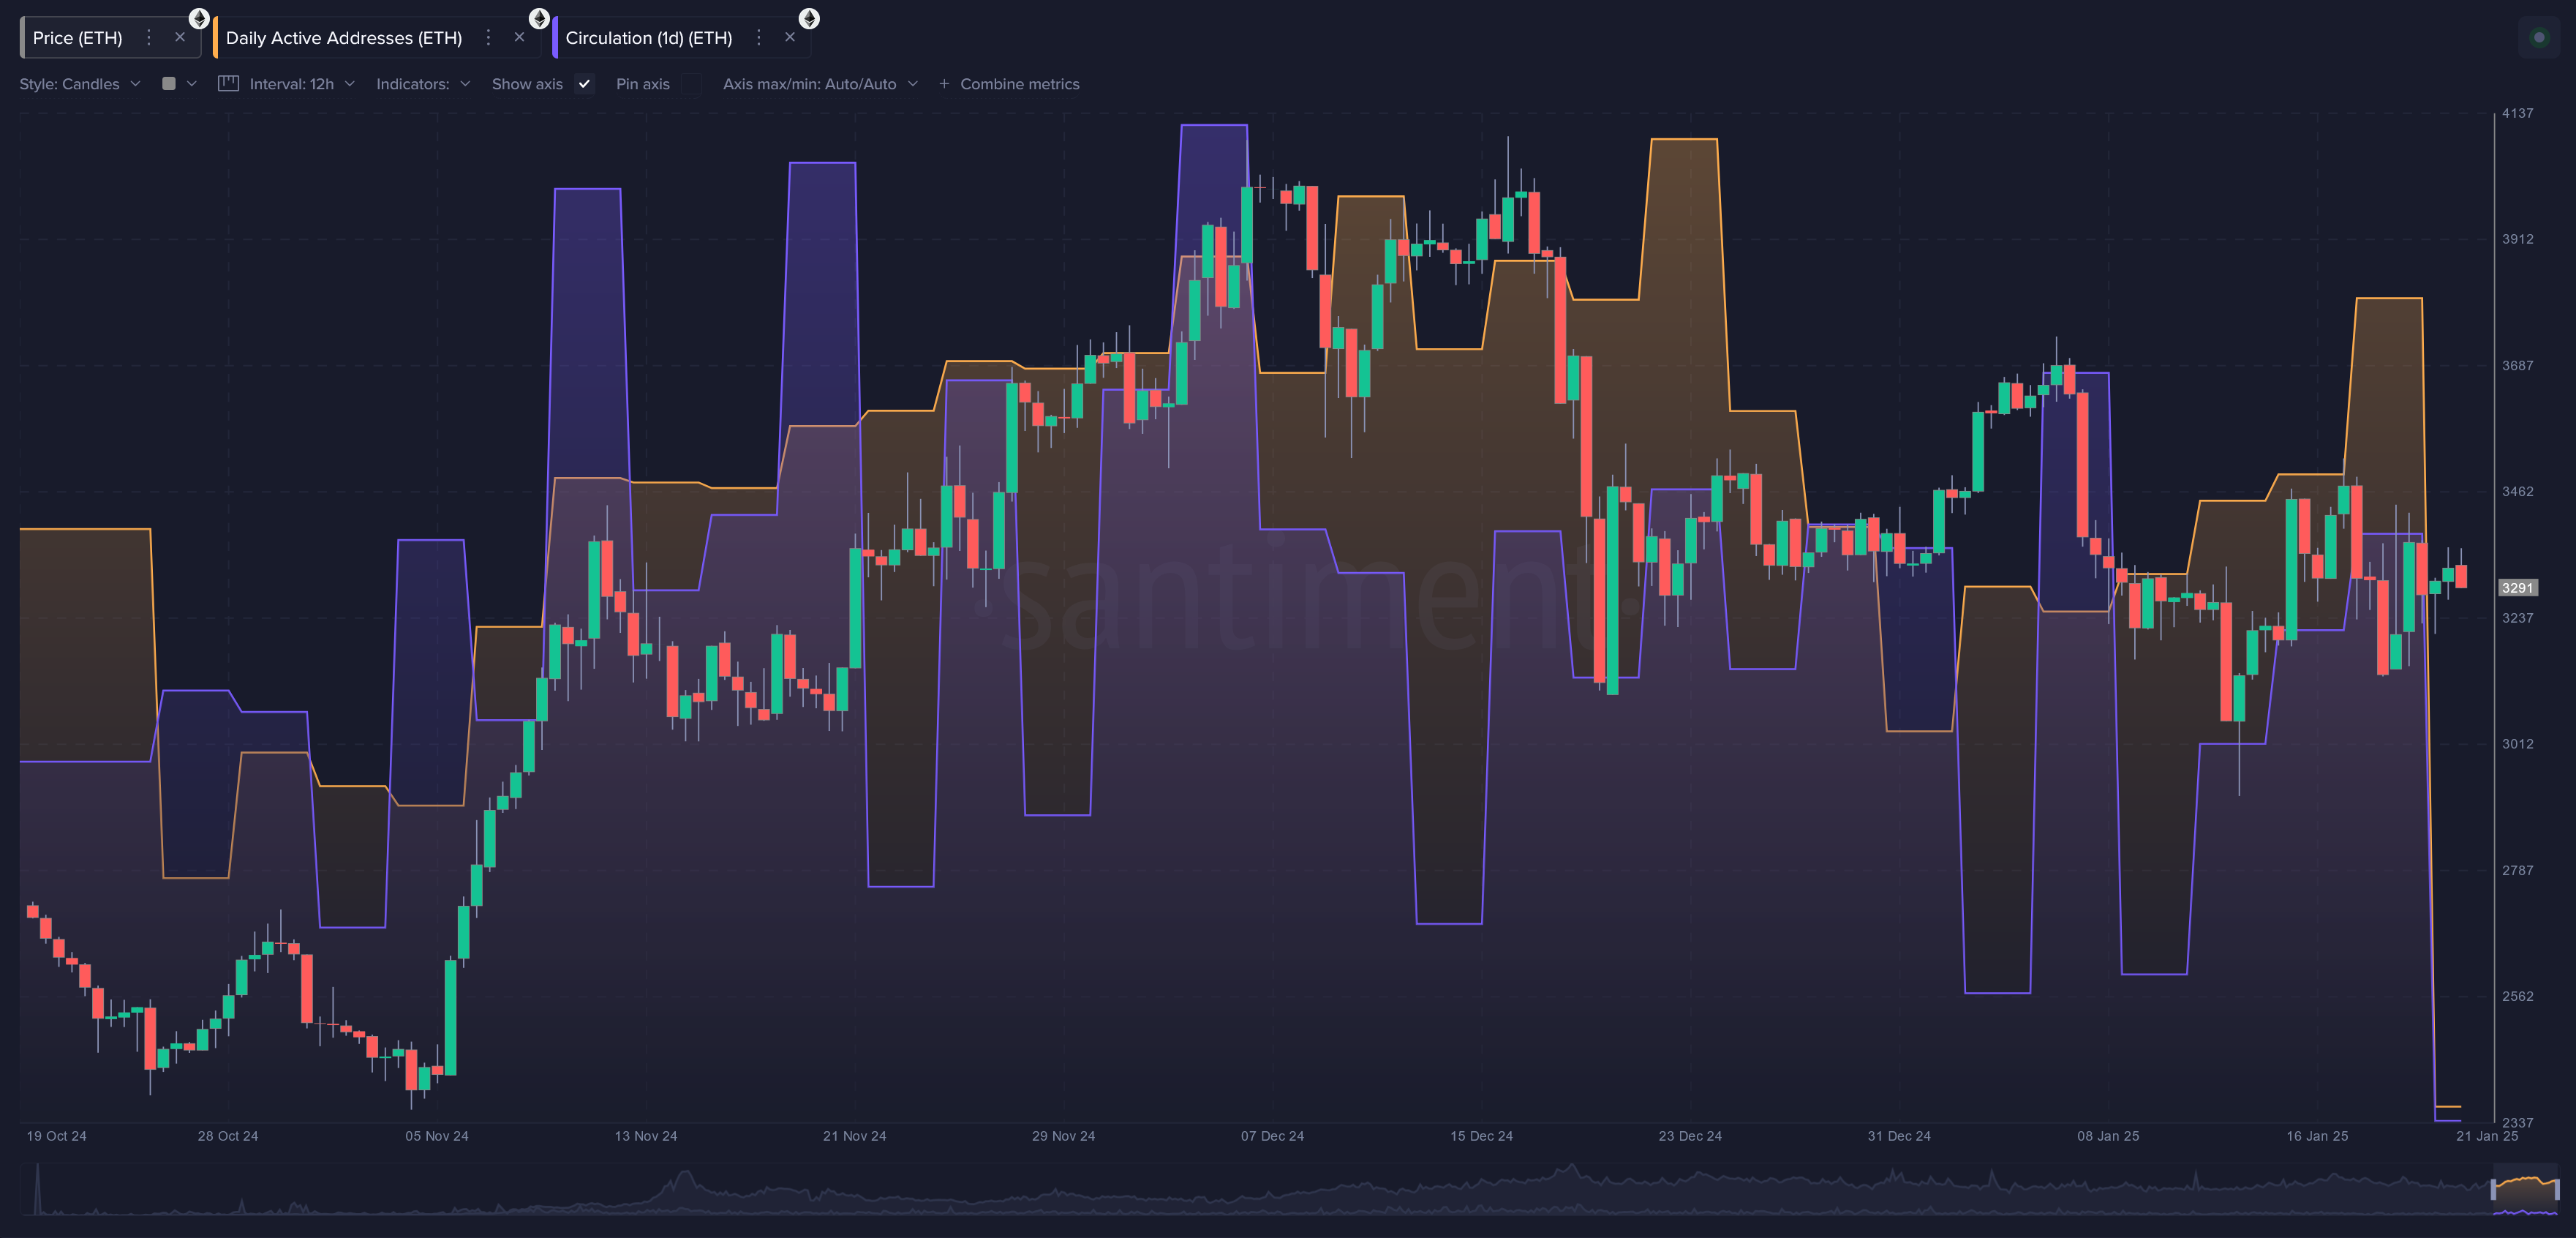
ETH daily active addresses and Circulation chart. Source: Santiment
The report further explains that unlike most of Ethereum’s top-cap peers, the asset shows that short-term traders (wallets active on the network in the past 30 days) are trading at an average loss. This means that buying or adding to a position would be doing so at a less risky spot than average during ETH’s existence.
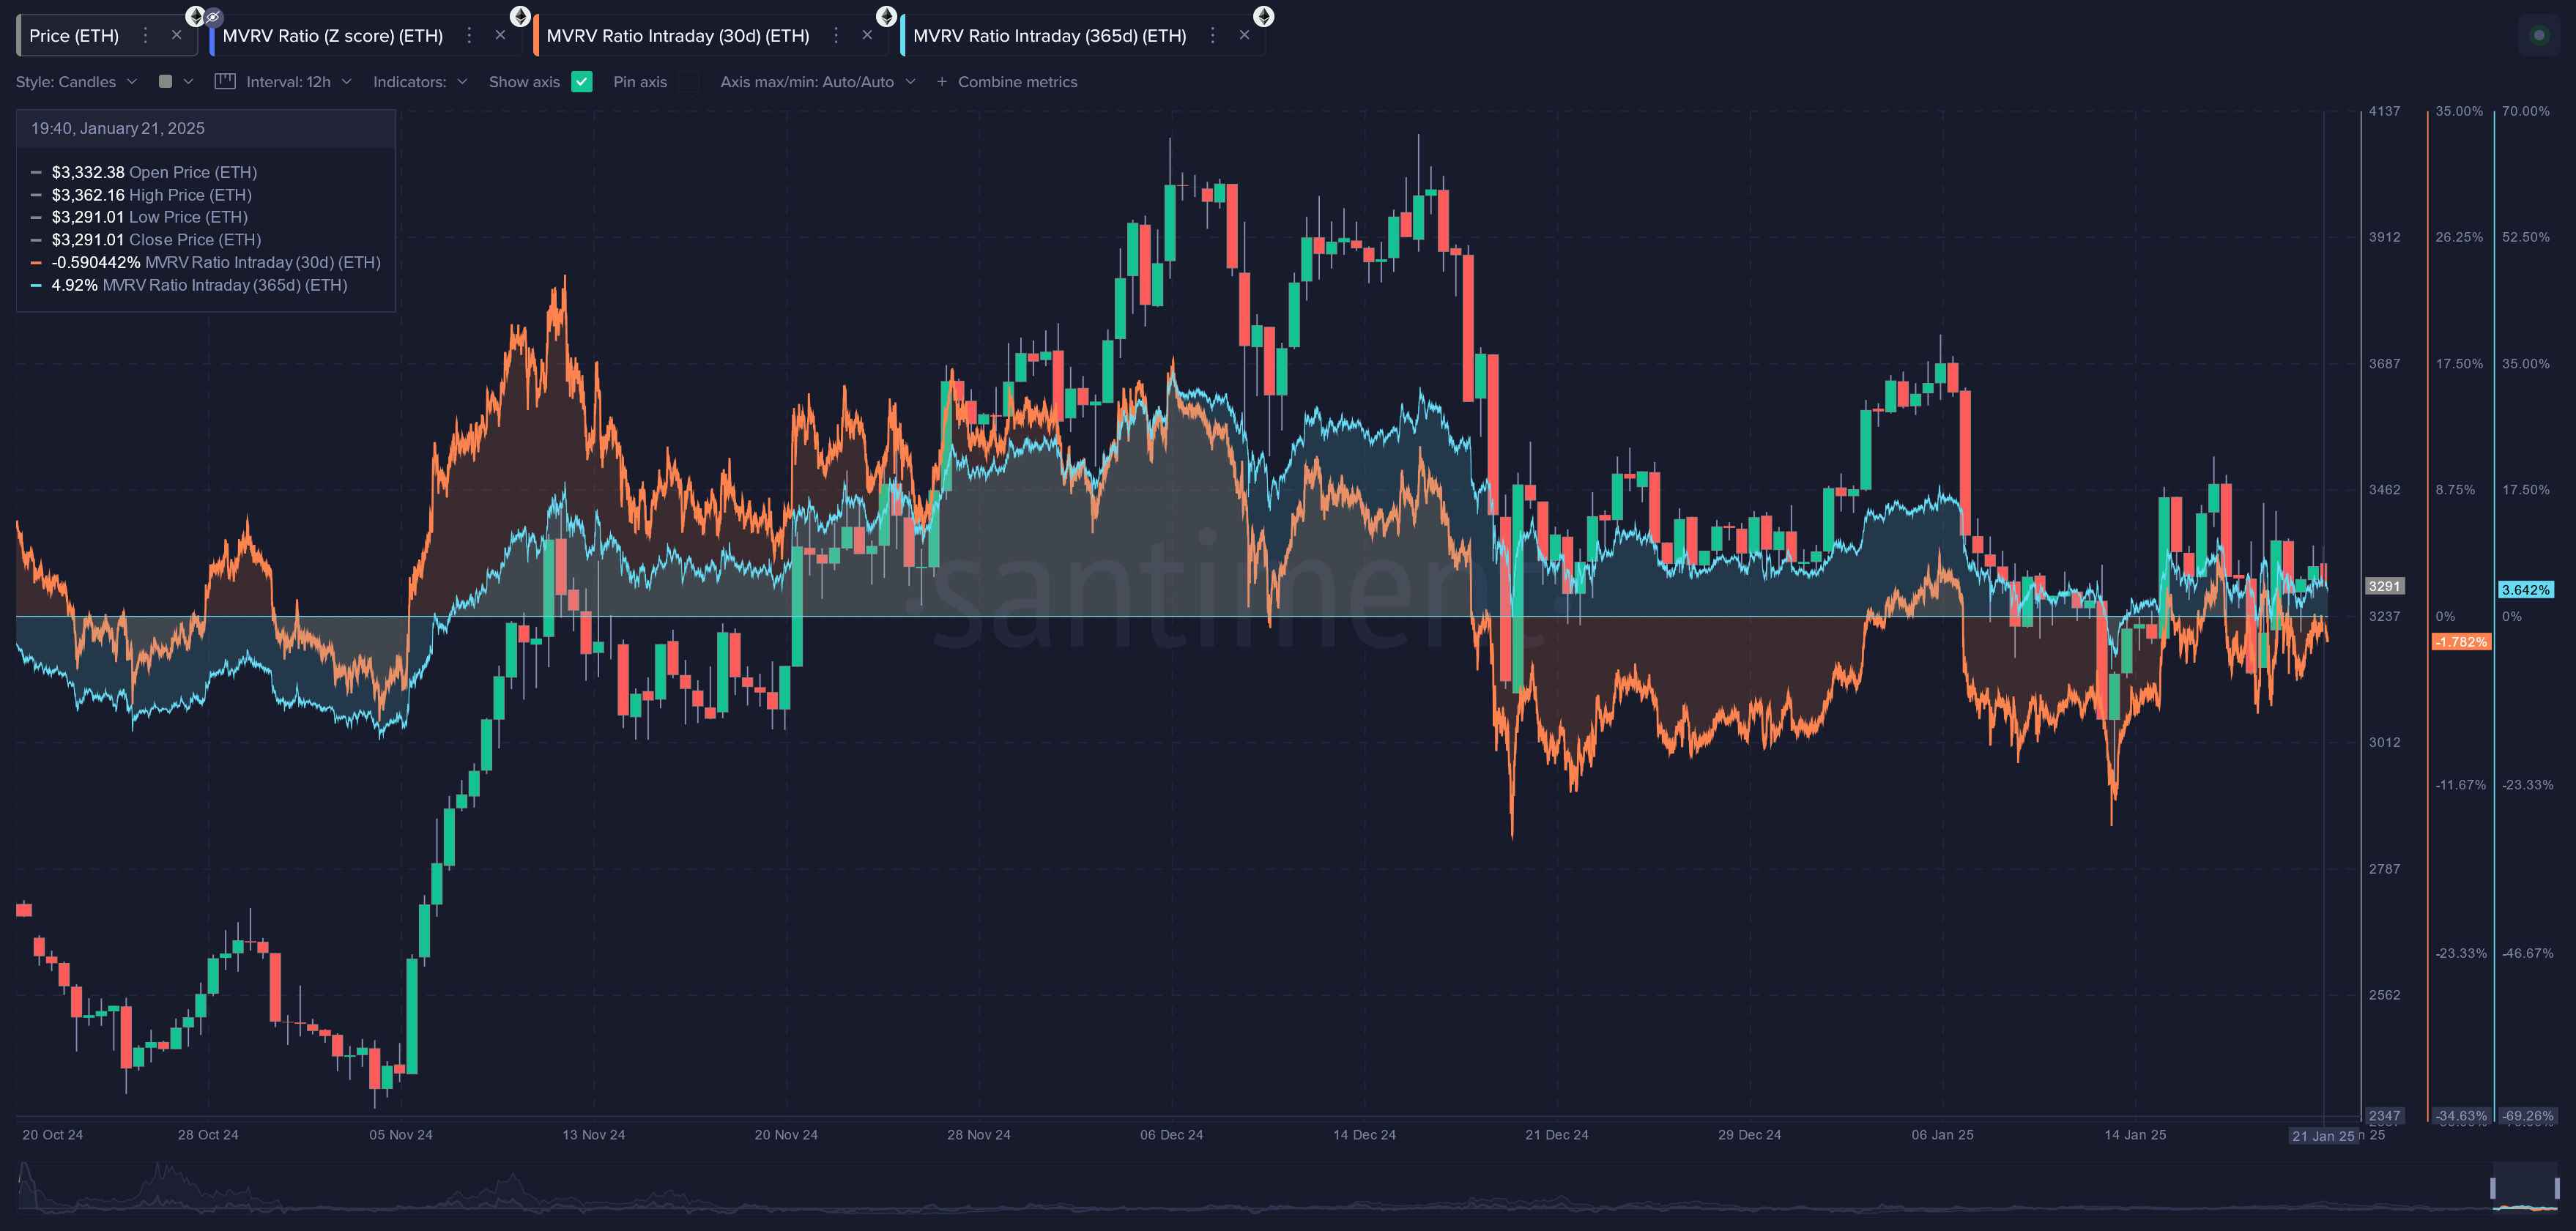
ETH MVRV chart. Source: Santiment
Lastly, the report concluded that on the social side of Ethereum. It’s important to note that the ratio of positive vs. negative comments across social media has veered toward extreme negativity, with traders becoming increasingly frustrated. This bodes well for ETH’s short-term future, as markets typically move in the opposite direction of the crowd’s expectations.
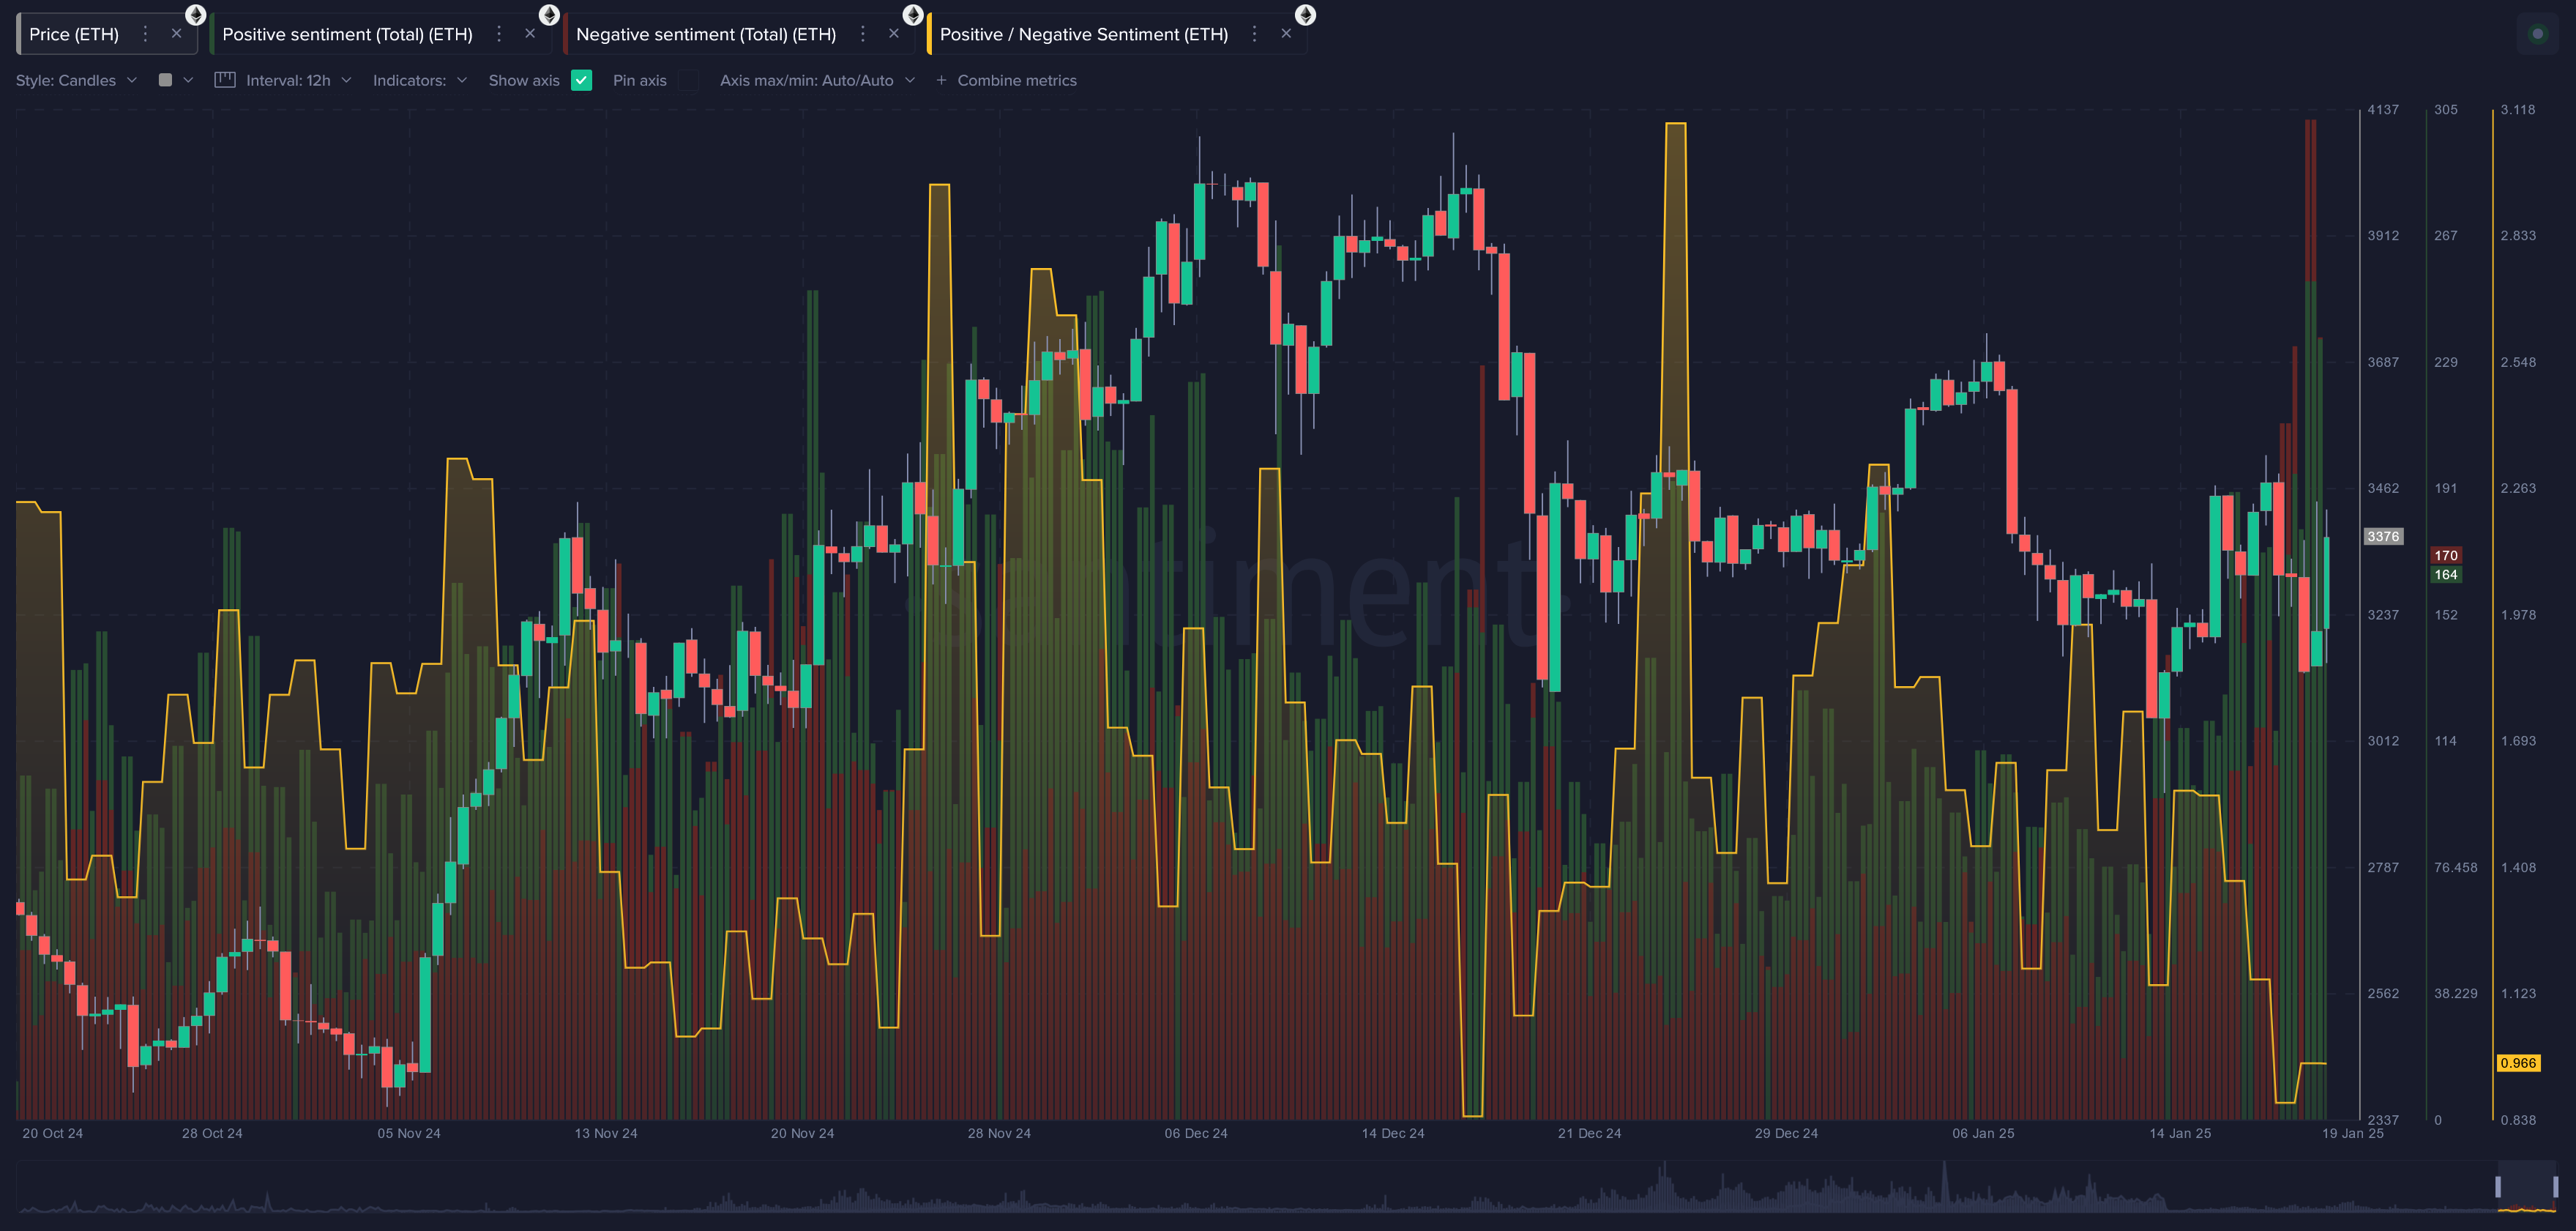
ETH Positive/ Negative sentiment chart. Source: Santiment
Ethereum FAQs
Ethereum is a decentralized open-source blockchain with smart contracts functionality. Its native currency Ether (ETH), is the second-largest cryptocurrency and number one altcoin by market capitalization. The Ethereum network is tailored for building crypto solutions like decentralized finance (DeFi), GameFi, non-fungible tokens (NFTs), decentralized autonomous organizations (DAOs), etc.
Ethereum is a public decentralized blockchain technology, where developers can build and deploy applications that function without the need for a central authority. To make this easier, the network leverages the Solidity programming language and Ethereum virtual machine which helps developers create and launch applications with smart contract functionality.
Smart contracts are publicly verifiable codes that automates agreements between two or more parties. Basically, these codes self-execute encoded actions when predetermined conditions are met.
Staking is a process of earning yield on your idle crypto assets by locking them in a crypto protocol for a specified duration as a means of contributing to its security. Ethereum transitioned from a Proof-of-Work (PoW) to a Proof-of-Stake (PoS) consensus mechanism on September 15, 2022, in an event christened “The Merge.” The Merge was a key part of Ethereum's roadmap to achieve high-level scalability, decentralization and security while remaining sustainable. Unlike PoW, which requires the use of expensive hardware, PoS reduces the barrier of entry for validators by leveraging the use of crypto tokens as the core foundation of its consensus process.
Gas is the unit for measuring transaction fees that users pay for conducting transactions on Ethereum. During periods of network congestion, gas can be extremely high, causing validators to prioritize transactions based on their fees.
Recommended Articles


