
Top 3 Price Prediction Bitcoin, Ethereum, Ripple: BTC, ETH and XRP rallies as MicroStrategy adds 11,000 BTC
- Bitcoin price holds above the $105K mark on Wednesday after rallying more than 4% so far this week.
- Ethereum price rebounds after retesting its 200-day EMA at $3,130, eyeing a recovery ahead.
- Ripple price continues its rally on Wednesday and could aim for the symmetrical triangle target at $3.63.
Bitcoin (BTC) and Ethereum (ETH) prices remain strong, eyeing further rally ahead. At the same time, Ripple (XRP) continued its rally on Wednesday and could aim for the symmetrical triangle target at $3.63.
Michael Saylor posted on X on Tuesday highlighting that MicroStrategy (MSTR) has acquired 11,000 BTC worth $1.1 billion at an average price of $101,191 per Bitcoin and currently holds 461,000 BTC acquired for $29.3 billion, an average price of $63,610 per BTC.
MicroStrategy has acquired 11,000 BTC for ~$1.1 billion at ~$101,191 per bitcoin and has achieved BTC Yield of 1.69% YTD 2025. As of 1/20/2025, we hodl 461,000 $BTC acquired for ~$29.3 billion at ~$63,610 per bitcoin. $MSTR https://t.co/SOgvMscghy
— Michael Saylor⚡️ (@saylor) January 21, 2025
Bitcoin bulls remain strong, eyeing for levels above $109K
Bitcoin price reached a new all-time high (ATH) of $109,588 on Monday but quickly slipped 6.68% from that level, closing at $102,260. However, the next day, it found support around its key $100K level and rose 3.8%. At the time of writing on Wednesday, it hovers around $105,600.
If BTC continues its upward momentum and breaks above its all-time-high, it could extend the rally above the $125K mark, calculated by the 141.40% Fibonacci extension level (drawn from the November 4 low of $66,835 to Monday’s ATH of $109,588) at $127,287.
The Relative Strength Index (RSI) indicator on the daily chart reads 63, above its neutral level of 50, indicating a rise in bullish momentum. Additionally, the Moving Average Convergence Divergence (MACD) indicator flipped a bullish crossover on January 15, giving a buy signal and suggesting a continuation of an uptrend.
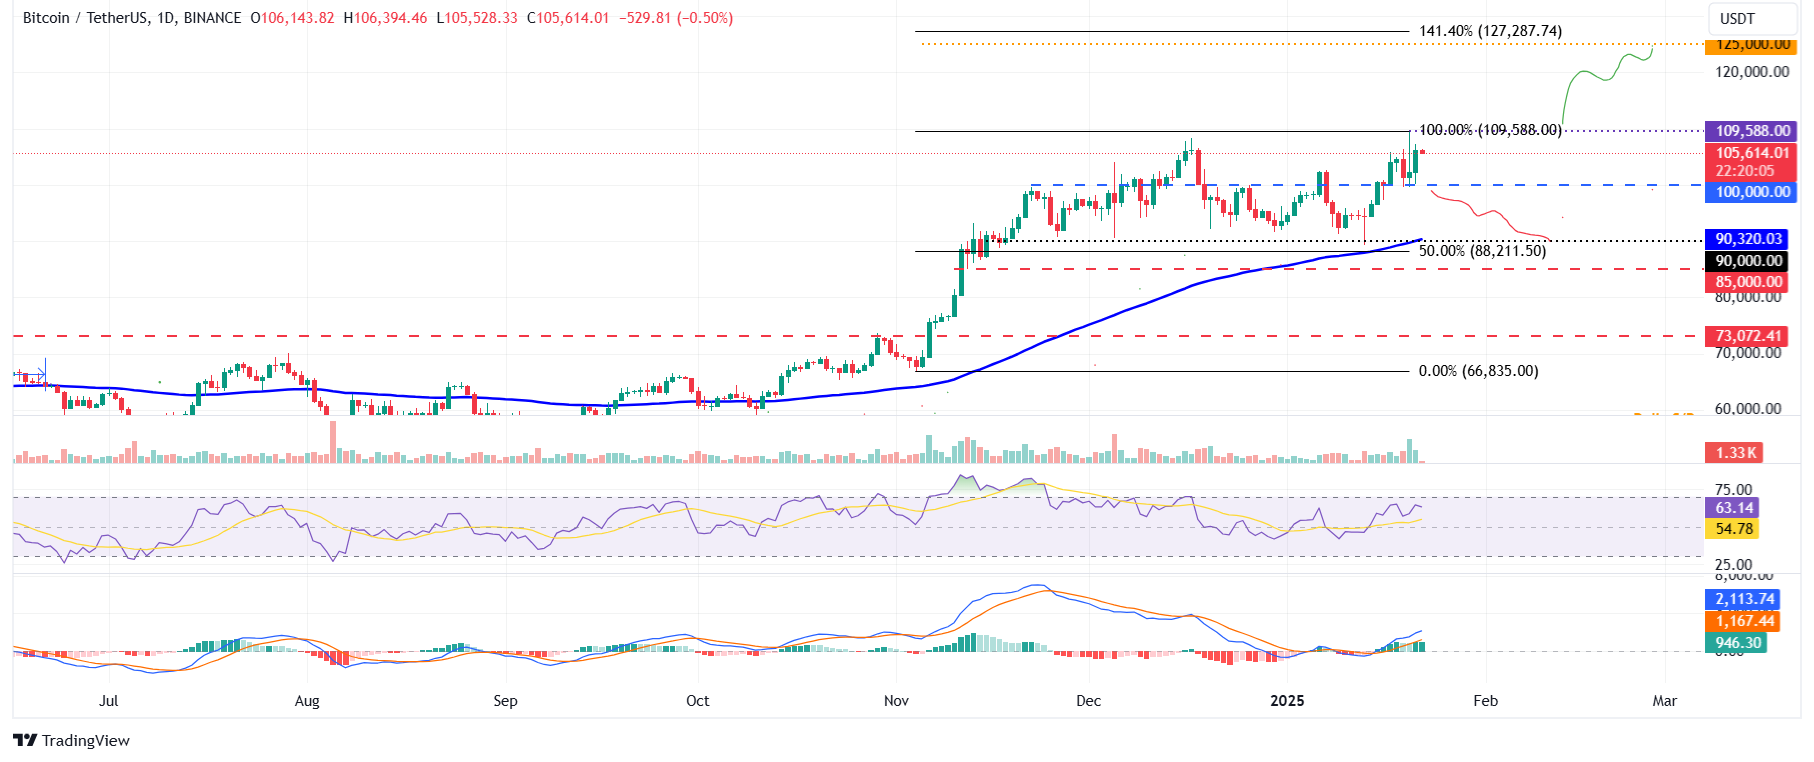
BTC/USDT daily chart
However, if BTC faces a pullback and closes below $100,000, it could extend the decline to retest its next support level at $90,000.
Ethereum price is poised for a rally after finding support around $200-day EMA
Ethereum bulls were retested, and support was found around its 200-day Exponential Moving Average (EMA) at $3,130 on Sunday, and it recovered 3.49% in the next two days. At the time of writing on Wednesday, it hovers around $3,328.
If the $3,130 EMA level holds, ETH could extend the recovery to test its daily resistance level at $3,730.
However, the RSI indicator on the daily chart reads 48, below its neutral level of 50, but points upwards, indicating weakness in bearish momentum. The MACD indicator flipped a bullish crossover on Tuesday, giving a buy signal and suggesting an uptrend.
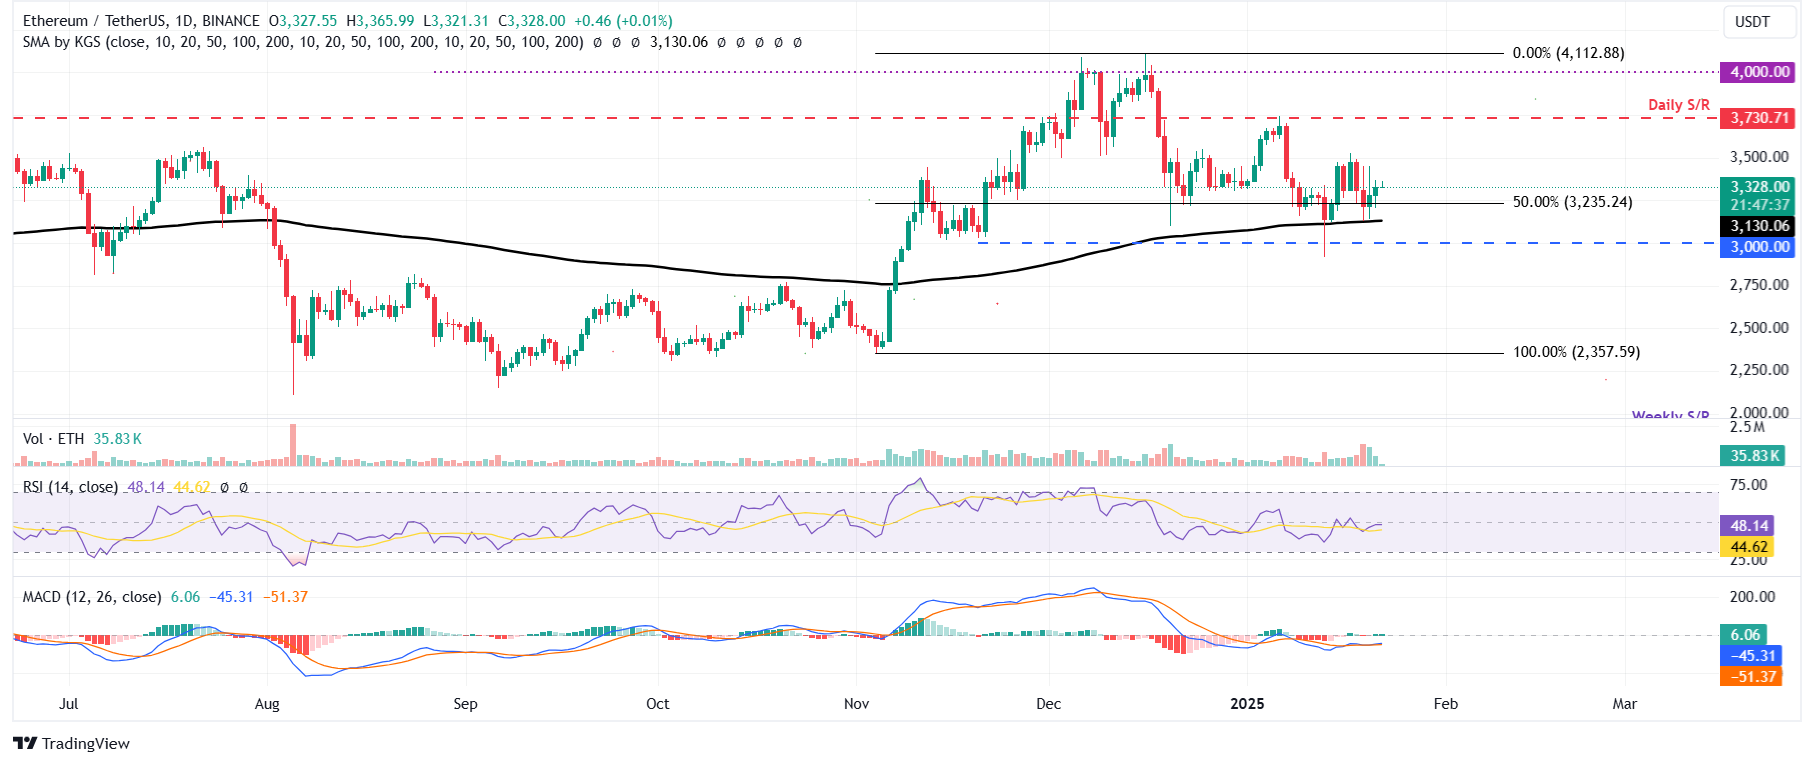
ETH/USDT daily chart
Conversely, if ETH closes below the 200-day EMA at $3,130, it could extend the decline to test its psychological importance level of $3,000.
Ripple bulls could aim for the symmetrical triangle target at $3.63
Ripple price retested its upper symmetrical triangle boundary at the start of the previous week and rallied 30.48% until Friday. However, it faced rejection around the $3.30 level on Saturday and declined 10.14% until Sunday. On Monday, it recovered by 6.95% until the next day. At the time of writing on Wednesday, it hovers around $3.18.
If XRP continues its upward momentum, it could extend the rally to test its technical target obtained by this pattern, which would be $3.63.
The RSI indicator reads 66, above its neutral value of 50 and points upwards, indicating bullish momentum. Additionally, the MACD shows a bullish crossover, suggesting a continuation of an upward trend.
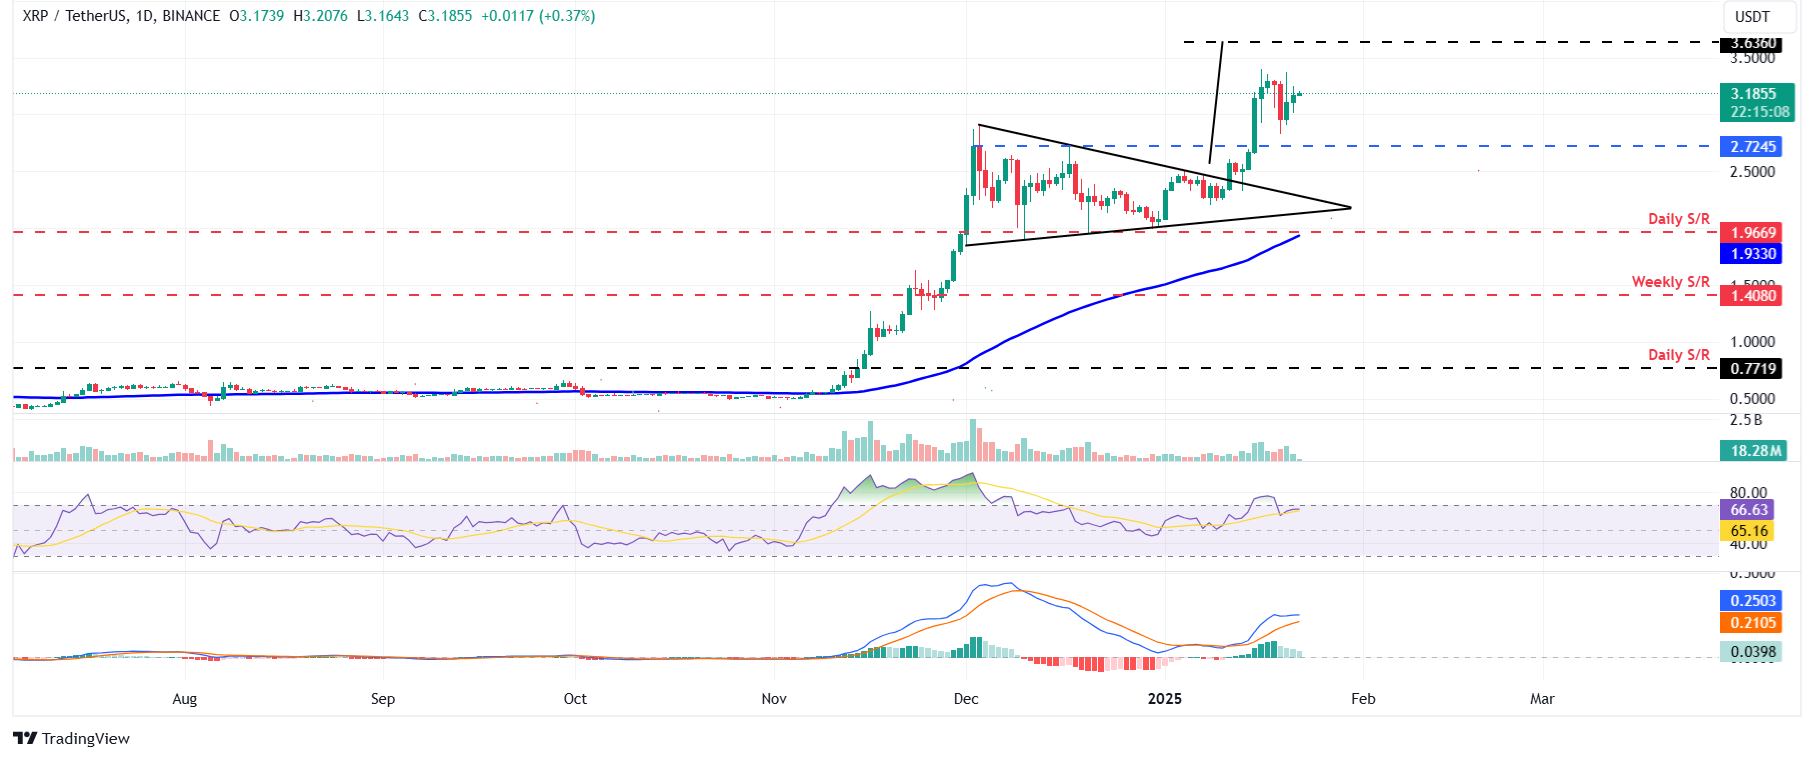
XRP/USDT daily chart
On the other hand, if XRP closes below the $1.96 daily support level, it would extend the decline to retest its next support level at $1.40.
Bitcoin, altcoins, stablecoins FAQs
Bitcoin is the largest cryptocurrency by market capitalization, a virtual currency designed to serve as money. This form of payment cannot be controlled by any one person, group, or entity, which eliminates the need for third-party participation during financial transactions.
Altcoins are any cryptocurrency apart from Bitcoin, but some also regard Ethereum as a non-altcoin because it is from these two cryptocurrencies that forking happens. If this is true, then Litecoin is the first altcoin, forked from the Bitcoin protocol and, therefore, an “improved” version of it.
Stablecoins are cryptocurrencies designed to have a stable price, with their value backed by a reserve of the asset it represents. To achieve this, the value of any one stablecoin is pegged to a commodity or financial instrument, such as the US Dollar (USD), with its supply regulated by an algorithm or demand. The main goal of stablecoins is to provide an on/off-ramp for investors willing to trade and invest in cryptocurrencies. Stablecoins also allow investors to store value since cryptocurrencies, in general, are subject to volatility.
Bitcoin dominance is the ratio of Bitcoin's market capitalization to the total market capitalization of all cryptocurrencies combined. It provides a clear picture of Bitcoin’s interest among investors. A high BTC dominance typically happens before and during a bull run, in which investors resort to investing in relatively stable and high market capitalization cryptocurrency like Bitcoin. A drop in BTC dominance usually means that investors are moving their capital and/or profits to altcoins in a quest for higher returns, which usually triggers an explosion of altcoin rallies.
Recommended Articles


