

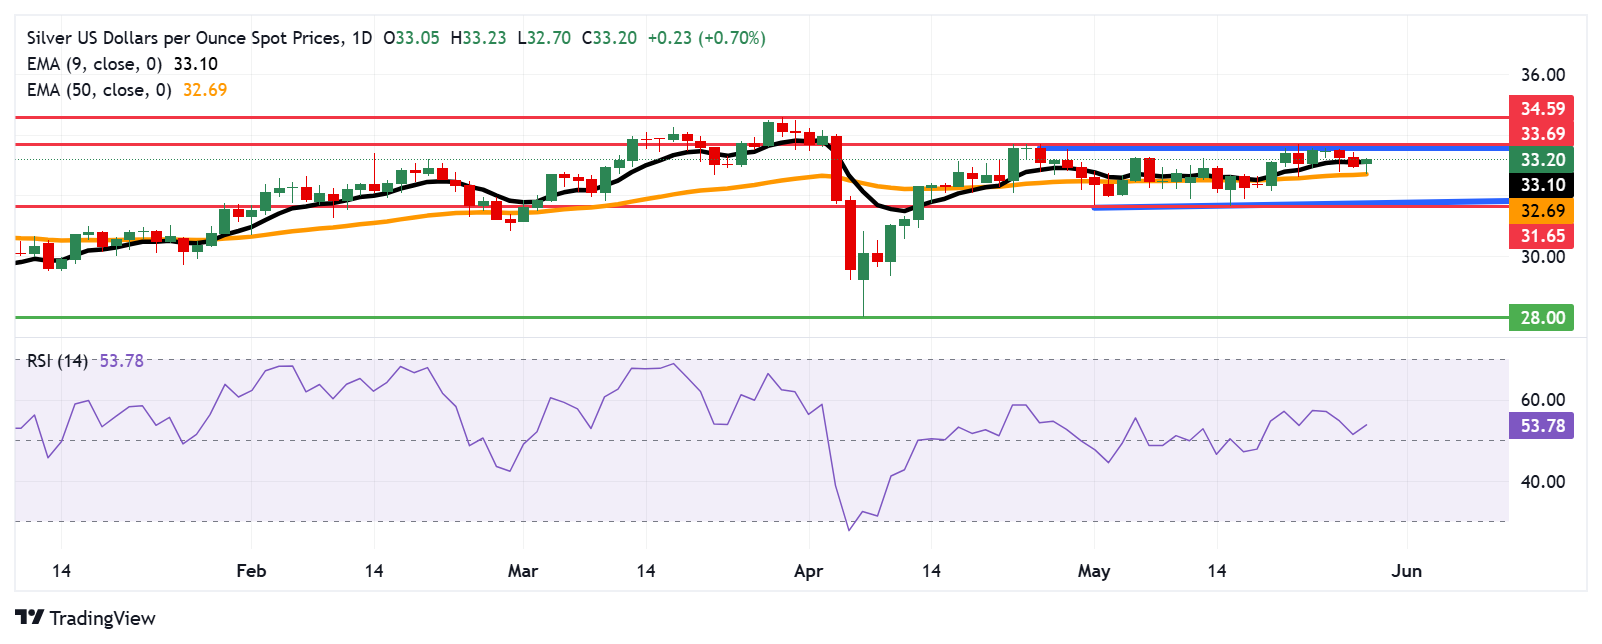
Silver price could find the immediate support at the nine-day EMA of $33.10.
The bullish bias could emerge as the 14-day RSI moved above the 50 level.
The rectangle’s upper boundary at $33.60 appears as the primary barrier.
Silver price (XAG/USD) halts its two-day losing streak, trading around $33.20 per troy ounce during the Asian hours on Thursday. Technical analysis of the daily chart indicates a neutral bias, as the price of the precious metal consolidates within a rectangular pattern.
The 14-day Relative Strength Index (RSI) has moved slightly above the 50 level, indicating a potential for a bullish bias to emerge. Additionally, the Silver price is hovering around the nine-day Exponential Moving Average (EMA), further highlighting that the short-term momentum is impartial.
Silver price could retest the immediate support at the nine-day EMA of $33.10, followed by the 50-day EMA at $32.69. A break below these levels could weaken the short- and medium-term price momentum and put downward pressure on the price of the grey metal to navigate the area around the lower boundary of the rectangle at $31.80, followed by the six-week low at $31.65, which was recorded on May 15.
On the upside, the XAG/USD pair could explore the region around the rectangle’s upper boundary at $33.60, aligned with the seven-week high at $33.69, reached on April 24. A break above this crucial resistance zone could cause the emergence of the bullish bias and lead the Silver price to approach the seven-month high of $34.59, last seen on March 28.
XAG/USD: Daily Chart
* The content presented above, whether from a third party or not, is considered as general advice only. This article should not be construed as containing investment advice, investment recommendations, an offer of or solicitation for any transactions in financial instruments.


