


Raydium Breaks Key Level Showing Relative Strength – New Highs Next?
Raydium (RAY) has had an exceptionally bullish week, surging over 62% in less than six days and capturing the spotlight in the decentralized exchange (DEX) market. This impressive rally has positioned Raydium as a market leader, with strong momentum that shows no signs of slowing down. The cryptocurrency recently cleared last year’s high, a significant milestone that further bolsters its bullish outlook.
Top analyst BigCheds shared insights into Raydium’s performance, highlighting its relative strength in the market. According to BigCheds, the token’s ability to outperform in a volatile environment signals strong demand and solidifies its position as one of the top-performing DEX tokens. This bullish momentum is drawing increased attention from traders and investors who see the potential for even greater gains in the near term.
Raydium’s breakout above last year’s high is a significant technical achievement, paving the way for further upward movement. With market sentiment turning increasingly positive and Raydium showcasing resilience and strength, the DEX is well-positioned to capitalize on its recent momentum. As it continues to outperform, many are watching closely to see just how high Raydium can go in this bullish phase. The coming days will be crucial for determining its next big move.
Raydium Reaches Multi-Year Highs
Raydium has made a significant move, breaking above the $6.5 mark just a few hours ago and continuing to push higher as the cryptocurrency market gains momentum. This breakout signals strong bullish sentiment for the token, as both technical and fundamental factors align to support further price appreciation. As the leading decentralized exchange (DEX) on Solana, Raydium’s growth and dominance within the ecosystem further bolster its long-term potential.
Top analyst Cheds recently shared a technical analysis on X, emphasizing Raydium’s relative strength compared to other altcoins. According to Cheds, RAY’s ability to outperform in a volatile market environment highlights the strong demand driving its rally. The token’s decisive move above key supply levels is a bullish indicator that could pave the way for significant gains in the coming days.
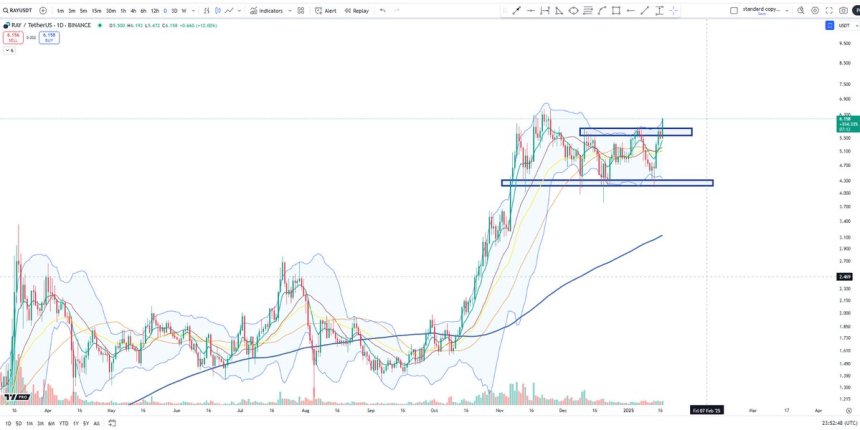
Beyond technicals, Raydium’s fundamentals remain robust, contributing to its strong performance. The DEX has cemented itself as a critical component of the Solana ecosystem, providing liquidity and facilitating seamless trading for a wide range of assets. Its expanding user base and consistent innovation reinforce investor confidence, making it a top choice for traders and liquidity providers alike.
As Raydium builds on its momentum, clearing critical price levels and pushing higher, many investors are now targeting even loftier price points. If the market continues to heat up and RAY maintains its relative strength, the potential for a massive rally becomes increasingly likely. With its strong fundamentals and bullish technical outlook, Raydium is well-positioned to capture further gains, making it one of the most exciting altcoins to watch in this current market cycle. The coming days will be pivotal in determining how far RAY can go in this bullish phase.
RAY Breaking Above Key Levels
Raydium is currently testing levels not seen since 2022, signaling a remarkable resurgence in its price action. The token’s strong momentum suggests it is primed for further gains, with bullish sentiment dominating the market. However, a potential retest of the $6.5 level could be on the horizon, providing an opportunity for consolidation before the next leg up.
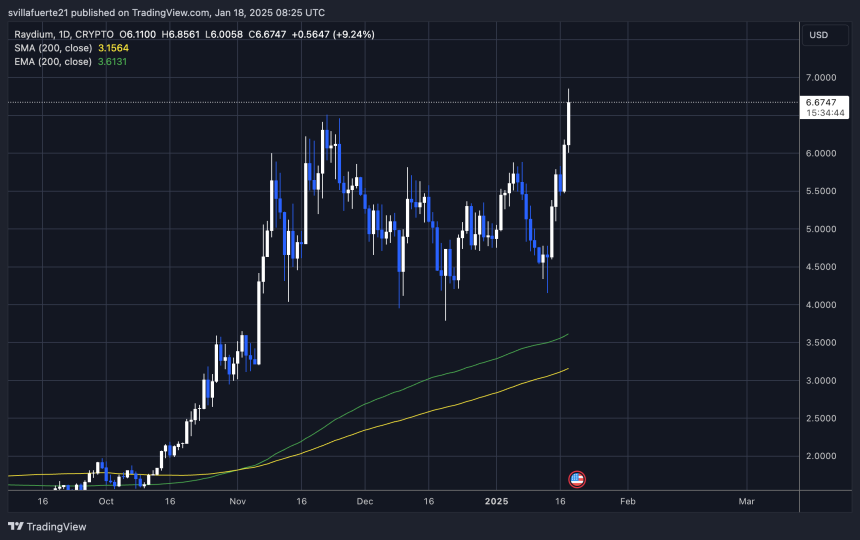
As of now, RAY is holding above the critical $6.70 mark, a level that solidifies bullish control. Maintaining this support is crucial, as it underscores market confidence and sets the foundation for continued upward movement. If bulls can defend this level, the next logical target for RAY would be the $7 mark—a key psychological and technical resistance that, once cleared, could pave the way for even greater gains.
Market sentiment around Raydium remains optimistic, with both technical indicators and fundamentals aligning to support its bullish trajectory. As the leading decentralized exchange (DEX) on Solana, RAY continues to benefit from strong utility and growing adoption, further reinforcing its appeal to investors.
Featured image from Dall-E, chart from TradingView
Recommended Articles


