Bitcoin Slips Under $91,000 As Crypto Inflows See 56% Decline

Source Newsbtc

Bitcoin has continued its bearish price action as on-chain data shows the inflows into the cryptocurrency market have seen a sharp decline recently.

Cryptocurrency Capital Inflows Have Seen A Notable Drop Recently

As explained by analyst Ali Martinez in a new post on X, capital inflows for the cryptocurrency sector have slowed down over the past month. Capital enters (or exits) the digital asset market through mainly three asset classes: Bitcoin (BTC), Ethereum (ETH), and the stablecoins. It’s only once that inflows have made it to these coins that they rotate out into the altcoins.

Thus, the flows related to these assets could be assumed to represent the netflows for the cryptocurrency sector as a whole. As for how the flows can be calculated, the Realized Cap indicator can be used in the case of Bitcoin and Ethereum.

The Realized Cap is an on-chain capitalization model that determines the total value of any given asset by assuming that the real value of any token in circulation is equal to the price at which it was last transacted on the network.

The last transaction of any coin is likely to be the last point at which it changed hands, so the price at that time would denote its current cost basis. Since the Realized Cap sums up this value for all tokens in the circulating supply, it essentially measures the amount of capital that the investors as a whole have put into the asset.

Bitcoin and Ethereum capital netflows can be equated with the changes taking place in this indicator. For stablecoins, there isn’t any need for this model as their price is always fixed around the $1 mark, so changes in their combined market cap serve as a sufficient method for finding capital flows.

Now, here is the chart shared by the analyst that shows the trend in the 30-day flows related to the three asset classes over the last few months:

Bitcoin Realized Cap

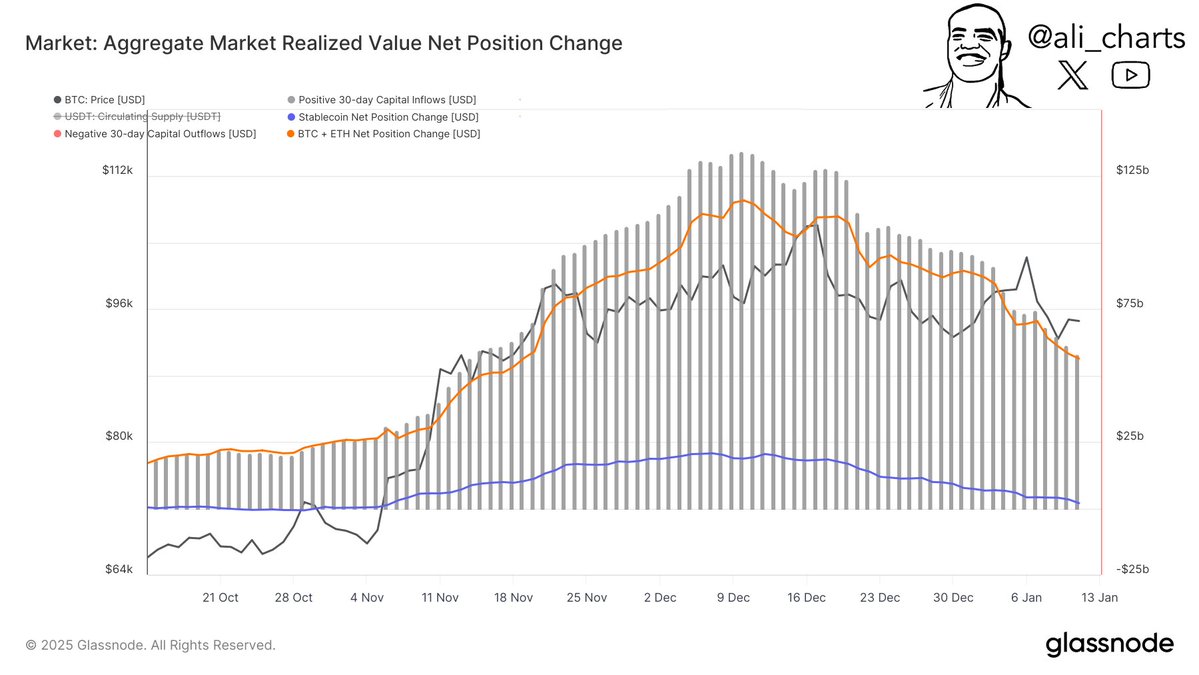
As displayed in the above graph, the total netflows related to the cryptocurrency sector have been positive during the last few months, implying that a net amount of capital has been coming into the various assets.

The 30-day inflows appear to have peaked last month, however, as they have since been following a downward trajectory. In this period, the metric’s value has declined from $134 billion to $58 billion, representing a decrease of more than 56%.

“This points to a significant reduction in investment activity,” notes Martinez. The slowdown in capital inflows could be why Bitcoin and other assets have switched to a bearish trajectory recently.

BTC Price

Bitcoin briefly fell under the $91,000 mark earlier in the day, but it appears the coin has since retraced back above it as its price is now trading around $91,800.

Bitcoin Price Chart
Disclaimer: For information purposes only. Past performance is not indicative of future results.
placeholder
Bitcoin Reclaims $70,000. Cathie Wood Claims Near Potential Bottom, Will This Time Be Different?Bitcoin price rebounds above $70,000; Cathie Wood calls a "potential bottom" again, but the reality may differ.On Monday (February 9), Bitcoin ( BTC) price momentum has stalled, fluctuati
Author  TradingKey
13 hours ago
Bitcoin price rebounds above $70,000; Cathie Wood calls a "potential bottom" again, but the reality may differ.On Monday (February 9), Bitcoin ( BTC) price momentum has stalled, fluctuati
placeholder
A Crash After a Surge: Why Silver Lost 40% in a Week?TradingKey - Spot Silver ( XAGUSD) prices have continued to decline; on Thursday, silver plummeted as much as 20% to break below $71 per ounce, and on Friday the sell-off intensified as prices fell fu
Author  TradingKey
Feb 06, Fri
TradingKey - Spot Silver ( XAGUSD) prices have continued to decline; on Thursday, silver plummeted as much as 20% to break below $71 per ounce, and on Friday the sell-off intensified as prices fell fu
placeholder
Bitcoin is trading around $63,000, down nearly 40% from its peak near $126,000Wall Street desks are no longer talking about upside dreams. The talk right now is how far Bitcoin charts could fall if selling keeps piling up. According to data from TradingView, Bitcoin’s price now sits at a shocking $63,500, after falling from $70,000 just this morning, losing $13,000 in 6 days, and staying far below […]
Author  Cryptopolitan
Feb 06, Fri
Wall Street desks are no longer talking about upside dreams. The talk right now is how far Bitcoin charts could fall if selling keeps piling up. According to data from TradingView, Bitcoin’s price now sits at a shocking $63,500, after falling from $70,000 just this morning, losing $13,000 in 6 days, and staying far below […]
placeholder
WTI declines below $63.00 as US-Iran talks loom West Texas Intermediate (WTI), the US crude oil benchmark, is trading around $62.85 during the Asian trading hours on Friday. The WTI price declines after the United States (US) and Iran agreed to hold talks in Oman on Friday. 
Author  FXStreet
Feb 06, Fri
West Texas Intermediate (WTI), the US crude oil benchmark, is trading around $62.85 during the Asian trading hours on Friday. The WTI price declines after the United States (US) and Iran agreed to hold talks in Oman on Friday. 
placeholder
Bitcoin Surrenders $65,000 as Analysts Warn of ‘Structural’ Market BreakBitcoin plunges 11% to break $65k as analysts term the crash "structural," citing a $1 trillion market wipeout and $2.09 billion in daily liquidations.
Author  Mitrade
Feb 06, Fri
Bitcoin plunges 11% to break $65k as analysts term the crash "structural," citing a $1 trillion market wipeout and $2.09 billion in daily liquidations.
goTop
quote