

Bitcoin Weekly Forecast: BTC targets $52,000, will New Moon trigger a pullback first?
- Bitcoin price has rallied 5.05% in the last two days and is up over 2.10% on Friday.
- Two out of the last three new moons have created local tops.
- The fourth new moon is on February 9, which leaves investors wondering about a potential correction.
- A weekly candlestick below $41,395 will prove fatal for BTC and could trigger a steeper correction.
Bitcoin (BTC) price action is showing strength and volatility after seven weeks of consolidation. The current weekly BTC candlestick has already registered a 9.30% gain and is likely to close on a positive note.
Also read: Bitcoin price shows strength as US BTC ETF flow percentage beats AUM in most regions
Bitcoin ETFs signal sustained bullish flows
Despite the Bitcoin spot Exchange-Traded Fund (ETF) approval, BTC price failed to rally as anticipated. The news of ETF inflows and outflows, caused a widespread panic among investors, which led to a brief pause. But lately, things are starting to improve with regard to ETF inflows.
The total inflows for BTC ETFs have been greater than Graysacle’s net BTC ETF outflows for the ninth consecutive day. Interestingly, this positive netflow data overlaps with the positive Bitcoin price performance over the last week.
BTC price turns over a new leaf
Bitcoin price development over the last week is promising and forecasts a continuation of the 2023 bull rally. The key developments due to the recent uptick are:
- BTC overcame $42,289, which is the midpoint of the last cycle’s bear market crash of 77%.
- Additionally, it has also flipped the $45,156 weekly resistance level into a support floor.
As a result, investors should expect a continuation of the uptrend to retest the $50,000 psychological level in the next one to three weeks.
But there are a few concerns regarding the recent move.
- The volume for the 9.30% move this week is lacking, which could imply a potential fake move that could trap longs.
- If the current weekly candlestick closes above $45,156, it will create a high, maintaining the uptrend structure. But it would also create a lower low on the Relative Strength Index (RSI) indicator, which is a clear bearish divergence.
Hence, investors should keep some gunpowder dry, should Bitcoin price trigger a pullback. For now, the key levels for buying the dips include $45,156 and $43,823. A bounce coupled with a spike in buying pressure could send Bitcoin price to the next key weekly hurdle at $52,062.
Also read: Top 3 Price Prediction Bitcoin, Ethereum, Ripple: Crypto markets primed, await directional bias from BTC
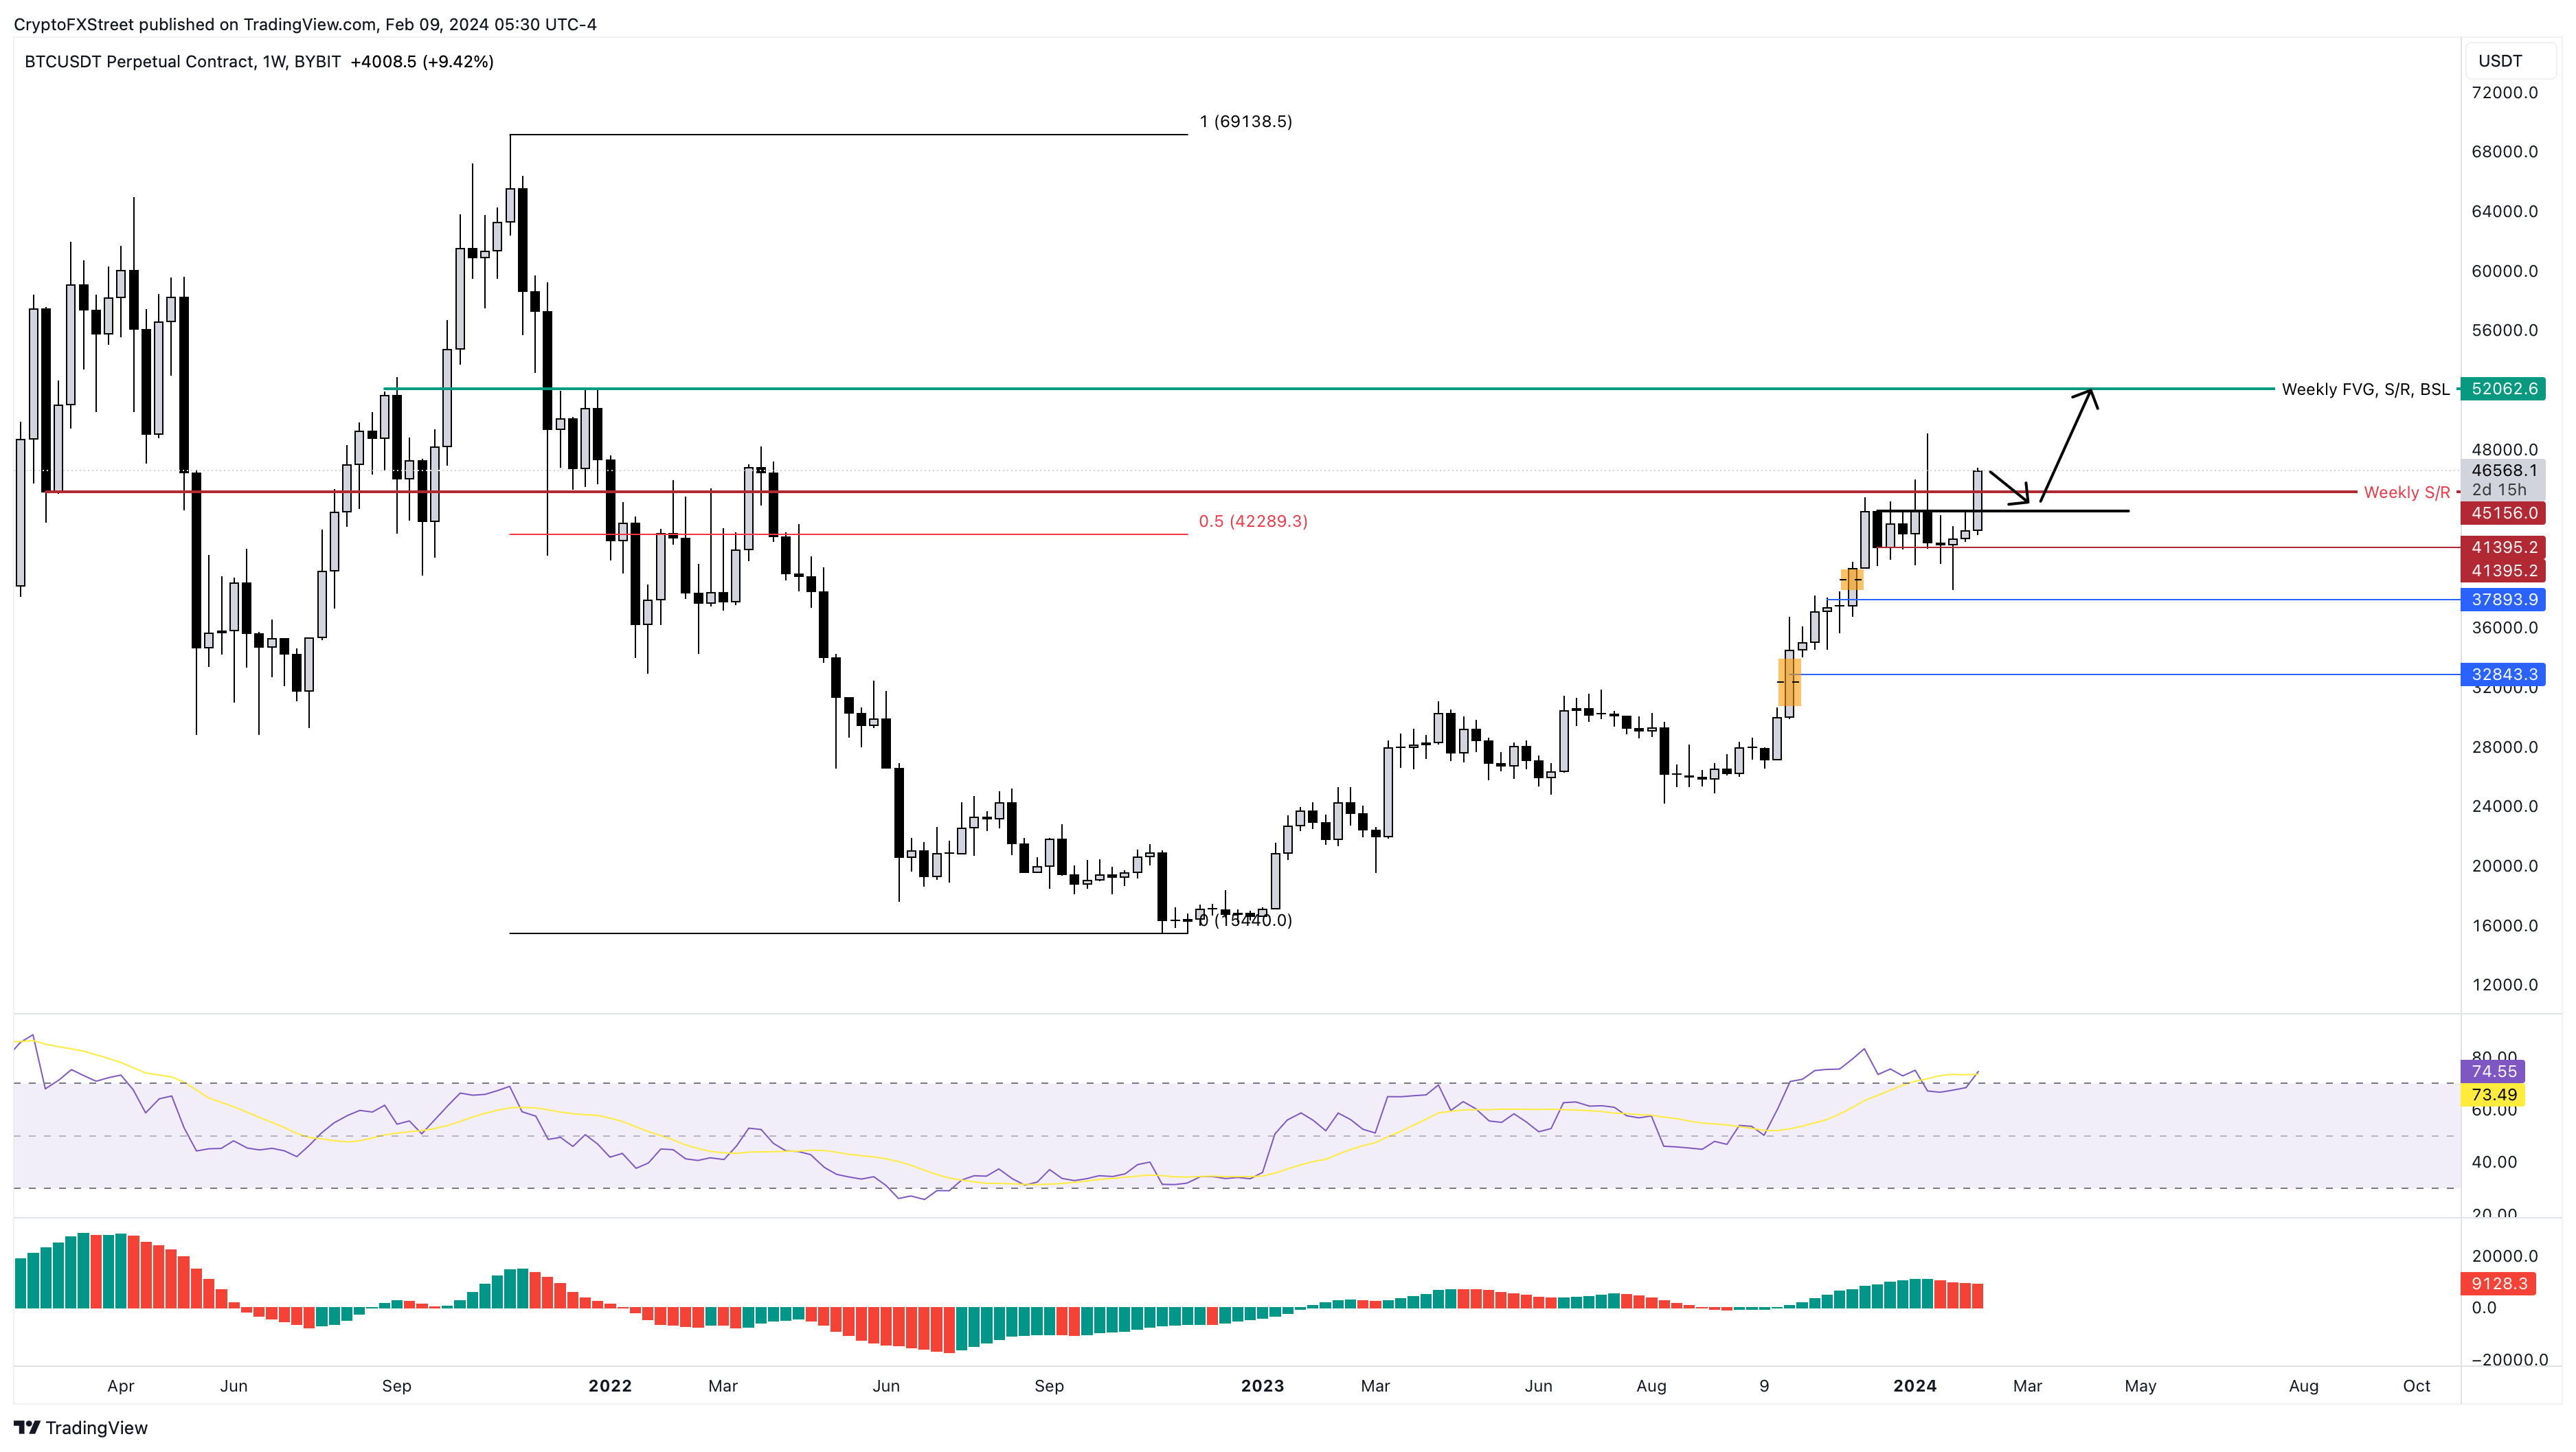
BTC/USDT 1-week chart
Read more: Bitcoin Weekly Forecast: BTC price remains indecisive despite strong fundamentals
Moon cycles and its effects on BTC
Another important aspect that BTC must not overlook is the moon phase cycles and their effect on Bitcoin price.
Out of the last three new moons – Bitcoin price has formed two local tops of sorts, leading to corrections. But looking at the data up to the fourth quarter of 2022, shows a different outlook.
A comprehensive look at the influence of the last 16 new moons on Bitcoin price shows interesting pointers:
- If the daily candlestick closes positive on the day of the new moon, BTC has a higher chance of continuing the uptrend or at least rallying the next day.
- 10 out of 16 times, BTC has triggered an uptrend after the new moon.
- The corrections for the last 16 data points show that the corrections could extend to 15%, and rallies can stretch up to 10%.
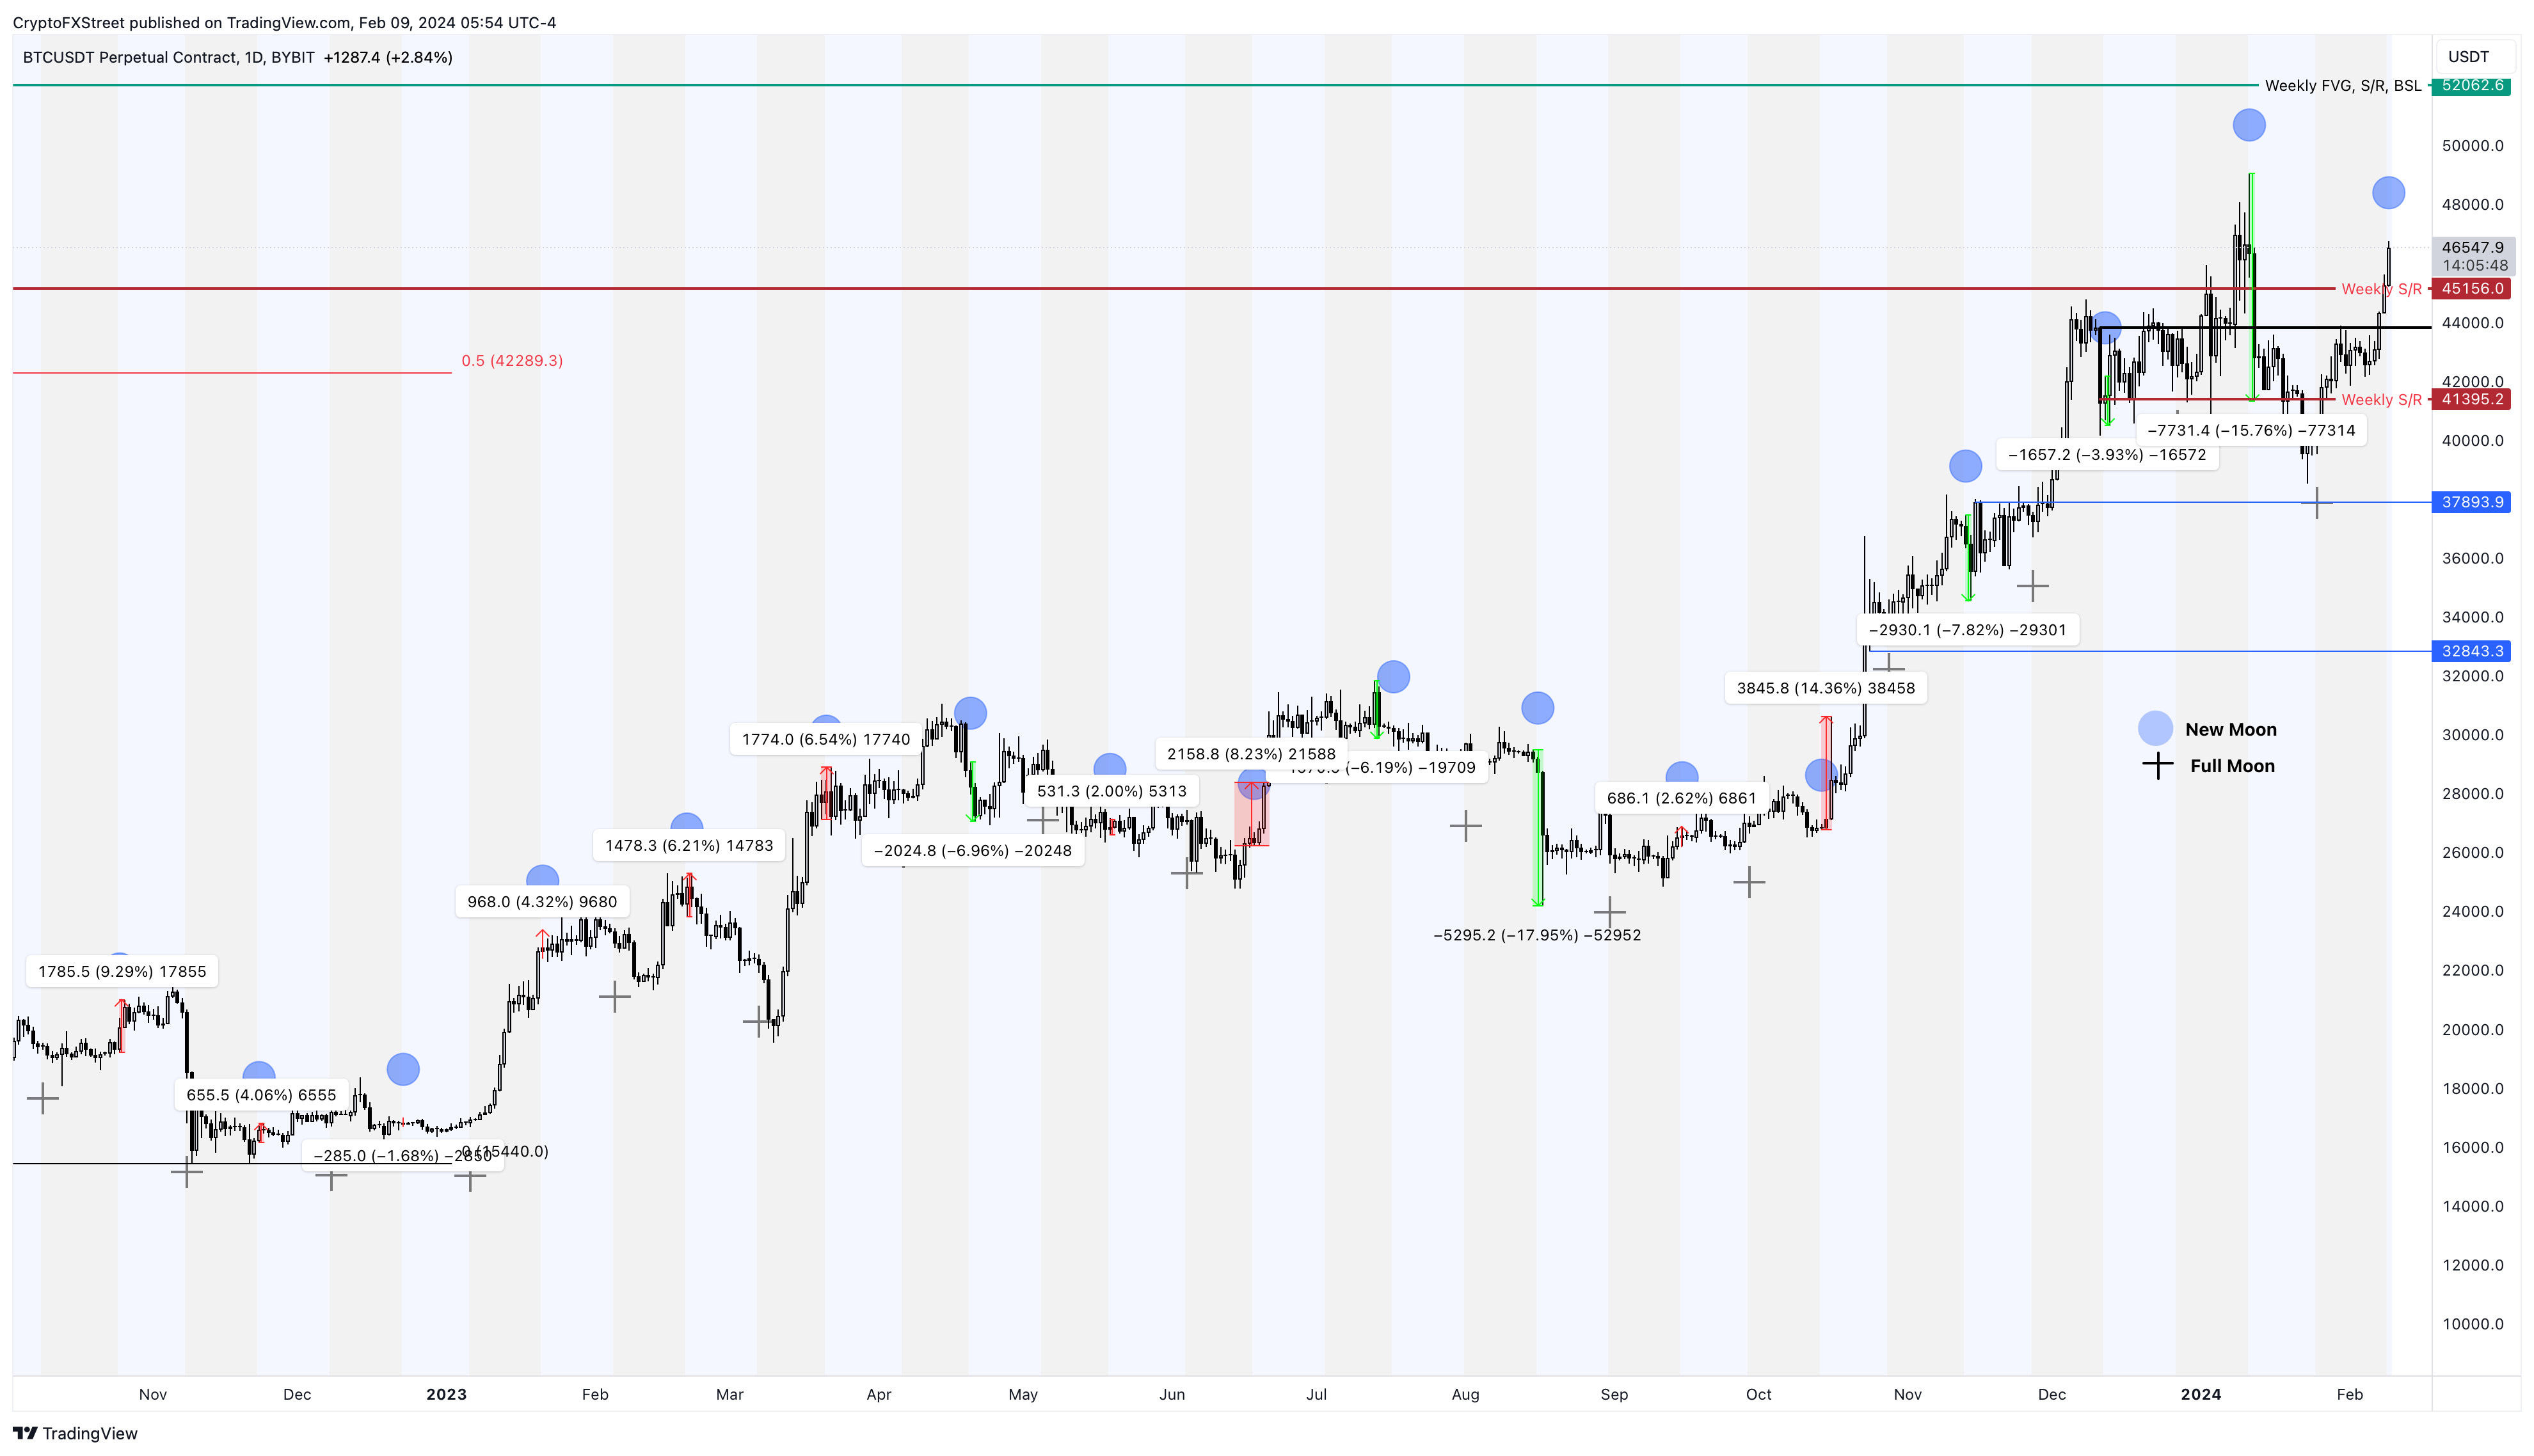
BTC/USDT 1-day chart
Regardless of the bullish outlook, the lack of volume during the recent uptick, coupled with a potential bearish divergence formation of the daily chart, suggests investors should play tier hand cautiously. Should a correction ensue tomorrow, market participants should expect Bitcoin price to pull back to 6% and revisit $43,283.
On the other hand, if this correction receives legs, it could retest the $41,395 support floor. A daily or weekly candlestick close below this level would invalidate the bullish thesis for BTC. In such a case, Bitcoin price could trigger a near 11% crash to revisit the $37,893 support floor.
Recommended Articles


