

Large Ethereum Transactions Grow As ETH Breaks Yearly Highs

Source Newsbtc

Ethereum (ETH) is making headlines as it trends toward the $4,100 mark, reaching a new yearly high of $4,096. This milestone, just $3 above the previous high set in March, signals a potential resurgence for the second-largest cryptocurrency by market capitalization. The price action has caught the attention of analysts and investors, particularly as Ethereum continues to outperform expectations in a market dominated by volatility and uncertainty.

Key metrics from IntoTheBlock shared by analyst Ali Martinez shed light on the network’s activity, revealing a surge in large Ethereum transactions. Historically, such increases in transaction volume have been linked to significant price movements, suggesting that Ethereum’s current uptrend could have more room to run. These developments hint at growing interest from institutional players and high-net-worth investors, further solidifying Ethereum’s position as a market leader.

The next few weeks promise to be pivotal as Ethereum approaches the year’s end. Will it sustain its momentum and close the year with a breakout above $4,100? Or will it face resistance and retrace? With on-chain activity and market sentiment aligning in Ethereum’s favor, all eyes are on its next move as traders and investors position themselves for what could be an exciting close to 2024.

Ethereum Transactions Surge With Price

Ethereum continues to dominate market discussions after pushing to new yearly highs on Friday. The cryptocurrency surged past $4,096, surpassing its previous peak set in March. This upward momentum has reignited investor interest, but Ethereum’s price isn’t the only thing on the rise—its network activity is booming as well.

According to data by analyst Ali Martinez (IntoTheBlock), large Ethereum transactions are experiencing a significant uptick. Martinez highlights that weekly transaction volume has skyrocketed by over 300%, reaching an impressive $17.15 billion yesterday. This surge in network activity signals increased confidence among institutional players and high-net-worth investors, who often precede retail adoption during major bull runs.
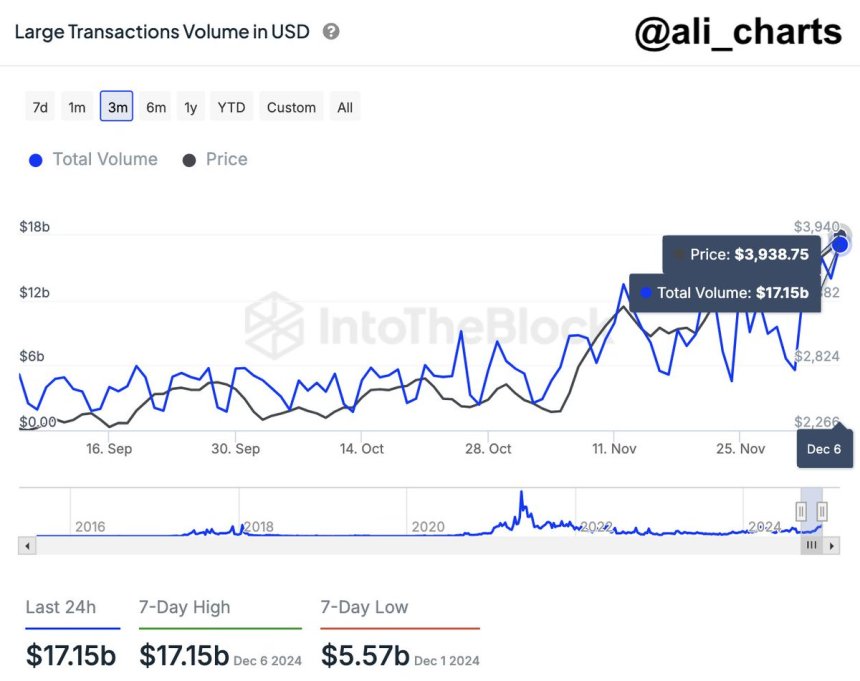
Ethereum Large Transactions Volume (USD)

Such growth in transaction volume historically correlates with sustained upward price movements, suggesting Ethereum’s rally may not be over. As the second-largest cryptocurrency by market cap, ETH appears well-positioned to continue setting new highs if these trends persist.

Despite this optimism, ETH faces a key milestone ahead—its all-time high of $4,878, set in November 2021, is still 20% away. While Ethereum’s recent breakout has invigorated bulls, analysts caution that reaching and sustaining prices near the ATH will require significant buy-side pressure and broader market strength.

If the current trajectory holds, Ethereum could approach its ATH sooner than expected, further solidifying its status as the go-to blockchain for decentralized applications and financial innovation. For now, investors are closely monitoring Ethereum’s price action and network data to gauge whether this rally has the momentum to break new ground or if a pullback is imminent.

ETH Pushing Above $4k 

Ethereum is currently trading at $3,960, showing resilience after reaching a local high of $4,096 just two days ago. This rally has brought Ethereum back into the spotlight, with investors eyeing key levels that could dictate its next move.

A weekly close above the critical $4,000 mark would signal the highest weekly close for ETH since December 2021, a major milestone for the second-largest cryptocurrency. Such a close would reinforce the bullish sentiment surrounding Ethereum, potentially attracting more buy-side pressure and setting the stage for a continued rally toward its all-time high of $4,878.
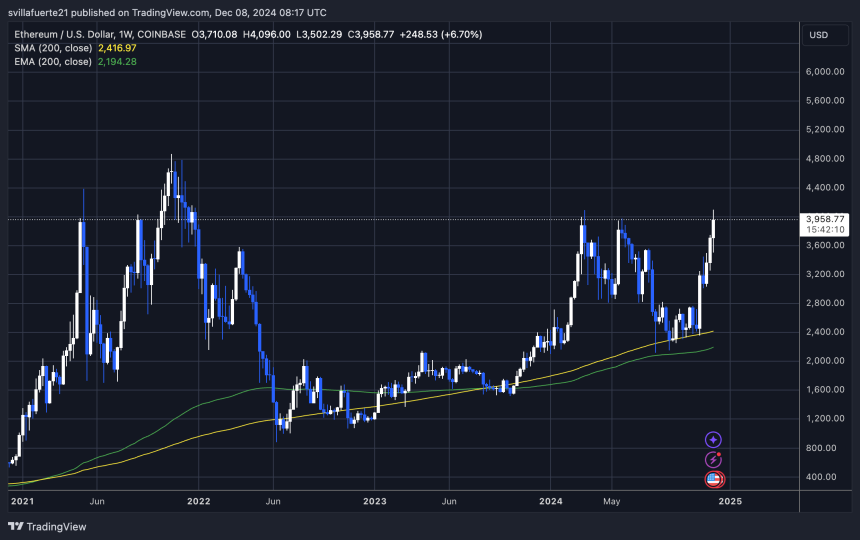
ETH testing the $4K mark

On the flip side, failure to achieve a weekly close above $3,880—its previous highest weekly close—could indicate waning momentum. In this scenario, Ethereum may enter a consolidation phase as traders take profits and the market digests recent gains. Consolidation below this level would likely keep ETH range-bound in the near term, with $3,880 and $4,000 acting as pivotal resistance levels.

The next few days will be crucial as ETH navigates this critical juncture. A decisive weekly close will likely determine whether Ethereum extends its current rally or pauses to consolidate, offering traders opportunities and challenges in this dynamic market.

Featured image from DALL-E, chart from TradingView

Disclaimer: For information purposes only. Past performance is not indicative of future results.
placeholder
Gold Price Analysis Today | Forex Gold Analysis | XAU/USD Analysis - November 11, 2026Get the latest gold price analysis, forex gold insights, and XAU/USD analysis for November 11, 2026. Read on for the details.
Author  Mitrade
Nov 11, Wed
Get the latest gold price analysis, forex gold insights, and XAU/USD analysis for November 11, 2026. Read on for the details.
placeholder
Nvidia slid 7.7% after hours while AMD and Broadcom rose — the AI trade changed hands, it didn't breakNvidia closed Wednesday at 173.73, up 2.87%, then fell as much as 8.1% to 159.44 after reports that its board was preparing for a possible leadership change. The same session, the Philadelphia Semiconductor Index rose 5.7% with all 30 components higher, CoreWeave jumped 24.7% on 168% revenue growth, and Micron added 11.9%. If AI demand were being repriced, AMD and Broadcom would not be bid. This is a governance discount on one name, and 204.54 — the 200-day average — is the level that settles it.
Author  Irene Q.
Nov 12, Thu
Nvidia closed Wednesday at 173.73, up 2.87%, then fell as much as 8.1% to 159.44 after reports that its board was preparing for a possible leadership change. The same session, the Philadelphia Semiconductor Index rose 5.7% with all 30 components higher, CoreWeave jumped 24.7% on 168% revenue growth, and Micron added 11.9%. If AI demand were being repriced, AMD and Broadcom would not be bid. This is a governance discount on one name, and 204.54 — the 200-day average — is the level that settles it.
placeholder
US October PPI Preview: Fed Rate Hike Expectations Rise, PPI May Be Key Variable; How Will US Stocks, Dollar, and Gold Move?On Friday (Nov. 13) Eastern Time, the U.S. will release the October Producer Price Index (PPI). Following the October CPI once again exceeding expectations, the market will look to the PP
Author  TradingKey
Nov 12, Thu
On Friday (Nov. 13) Eastern Time, the U.S. will release the October Producer Price Index (PPI). Following the October CPI once again exceeding expectations, the market will look to the PP
placeholder
Gold hit a one-year low while central banks bought 321 tonnes — the sellers were never the ones you thinkSpot gold closed at 3,876 on Thursday, down 2.8% and its lowest close in more than a year, with an intraday low near 3,852. The dollar is at a 19-month high of 103.21 and the 10-year yield is at 5.10%, so the price move is easy to explain. What is harder to explain is who sold: central banks bought 321 tonnes in Q3, the PBoC added for a 24th straight month, ETF holdings are near a record 4,256 tonnes, and roughly 95% of the futures selling came from non-reportable and sovereign-type accounts rather than hedge funds. This piece separates the two books that have to balance.
Author  Irene Q.
Yesterday 02: 40
Spot gold closed at 3,876 on Thursday, down 2.8% and its lowest close in more than a year, with an intraday low near 3,852. The dollar is at a 19-month high of 103.21 and the 10-year yield is at 5.10%, so the price move is easy to explain. What is harder to explain is who sold: central banks bought 321 tonnes in Q3, the PBoC added for a 24th straight month, ETF holdings are near a record 4,256 tonnes, and roughly 95% of the futures selling came from non-reportable and sovereign-type accounts rather than hedge funds. This piece separates the two books that have to balance.
placeholder
Brent rose 3.3% and US crude stocks built 4.66 million barrels in the same weekBrent January settled at 95.82, up 3.3%, and WTI at 88.74, up 2.55%, after the US signalled it would not pursue a deal with Iran and attacks on Gulf shipping continued. In the same week, EIA data showed US crude inventories rising 4.657 million barrels against expectations of a 1.1 million draw, with gasoline up another 1.799 million. OPEC output also rebounded 1.96 million barrels a day to 27.16 million in October, led by Saudi Arabia at 10.56 million. This piece separates the geopolitical premium from the physical balance and lays out where each side of the trade is anchored.
Author  Irene Q.
Yesterday 03: 06
Brent January settled at 95.82, up 3.3%, and WTI at 88.74, up 2.55%, after the US signalled it would not pursue a deal with Iran and attacks on Gulf shipping continued. In the same week, EIA data showed US crude inventories rising 4.657 million barrels against expectations of a 1.1 million draw, with gasoline up another 1.799 million. OPEC output also rebounded 1.96 million barrels a day to 27.16 million in October, led by Saudi Arabia at 10.56 million. This piece separates the geopolitical premium from the physical balance and lays out where each side of the trade is anchored.
goTop
quote