

Ripple week in review: Can XRP resume its rally to hit a new all-time high?
- XRP investors realized over $5.86 billion in profits during the week.
- XRP whales are slightly tilted toward accumulation despite holding an average profit of nearly 400%.
- XRP needs to overcome the $2.92 level to stage a rally to a new all-time high.
Ripple's XRP is up 7% on Friday as whales are holding onto their tokens despite high profit-taking among retail traders. This attitude from whales could push XRP to a new all-time high at $3.57.
XRP on-chain data indicates bullish sentiment despite record profit-taking
After extending its rally and rising to a four-year high of $2.91 on Tuesday, XRP saw a pullback, declining by about 17% in the following three days.
The decline was potentially sparked by increased profit-taking, as revealed by the XRP Network Realized Profit and Loss indicator, which shows investors have booked gains of over $5.86 billion since December 1. Such profit-taking is normal among investors during bull markets, especially when prices reach new highs.
 [01.38.01, 07 Dec, 2024]-638691307297625052.png)
XRP Network Realized Profit and Loss | Santiment
This is evidenced in the XRP Mean Coin Age metric, which shows that selling activity was rising in the week across all coin ages, especially among the 2-3 years cohorts. When this metric sees a decline, it sigifies distribution among the respective coin age cohort.
 [01.40.19, 07 Dec, 2024]-638691307692657015.png)
XRP Mean Coin Age | Santiment
Despite the recent pullback from profit-taking, other XRP on-chain data indicates that bullish sentiment is still dominant in the market.
The XRP Market Value to Realized Value (MVRV) ratio, which measures all holders' average profit or loss, shows that investors are still holding onto over 388% of profit.
Notably, most of the recent selling activity may have been from retailers, as whales have shown a slight bias toward accumulation. This is seen in the chart below, which shows that investors holding between 1M - 10M XRP increased their stash by 260 million XRP tokens in the week.
 [01.38.20, 07 Dec, 2024]-638691308072765548.png)
XRP Supply Distribution (1M - 10M) & MVRV Ratio | Santiment
Additionally, Santiment data shows that whale activity — transactions over $1M — was at a five-year high during the week.
 [01.38.35, 07 Dec, 2024]-638691308481188822.png)
XRP Whales Transaction Count (>$1M) | Santiment
However, the Age Consumed metric, which measures the movement of previously idle/old coins multiplied by their amount, remained at low levels and whale holdings didn’t decline.
This shows that the majority of whale activity during the week was potentially tilted toward accumulation. When whales are still holding onto their tokens during a bull market, it suggests they believe prices have more room to grow.
 [01.40.12, 07 Dec, 2024]-638691309287475354.png)
XRP Age Consumed | Santiment
However, it’s important to note that there are also a ton of new XRP whales that purchased the token after the US presidential election. This cohort could panic sell if XRP declines near their cost basis.
Additionally, XRP weekly active addresses have continued to grow, reaching a sixteen-month high of 495K.
Meanwhile, Ripple Labs' Chief Technology Officer David Schwartz said at The Emergence conference that he's hopeful the company will launch its RLUSD stablecoin before the end of the year.
XRP needs to overcome the $2.92 level before staging a rally to a new all-time high
XRP recovered the 23.6% Fibonacci (Fib) Retracement level after declining briefly below it during the week. If XRP manages to reclaim the $2.58 level, it could retest $2.92 where it saw a rejection.
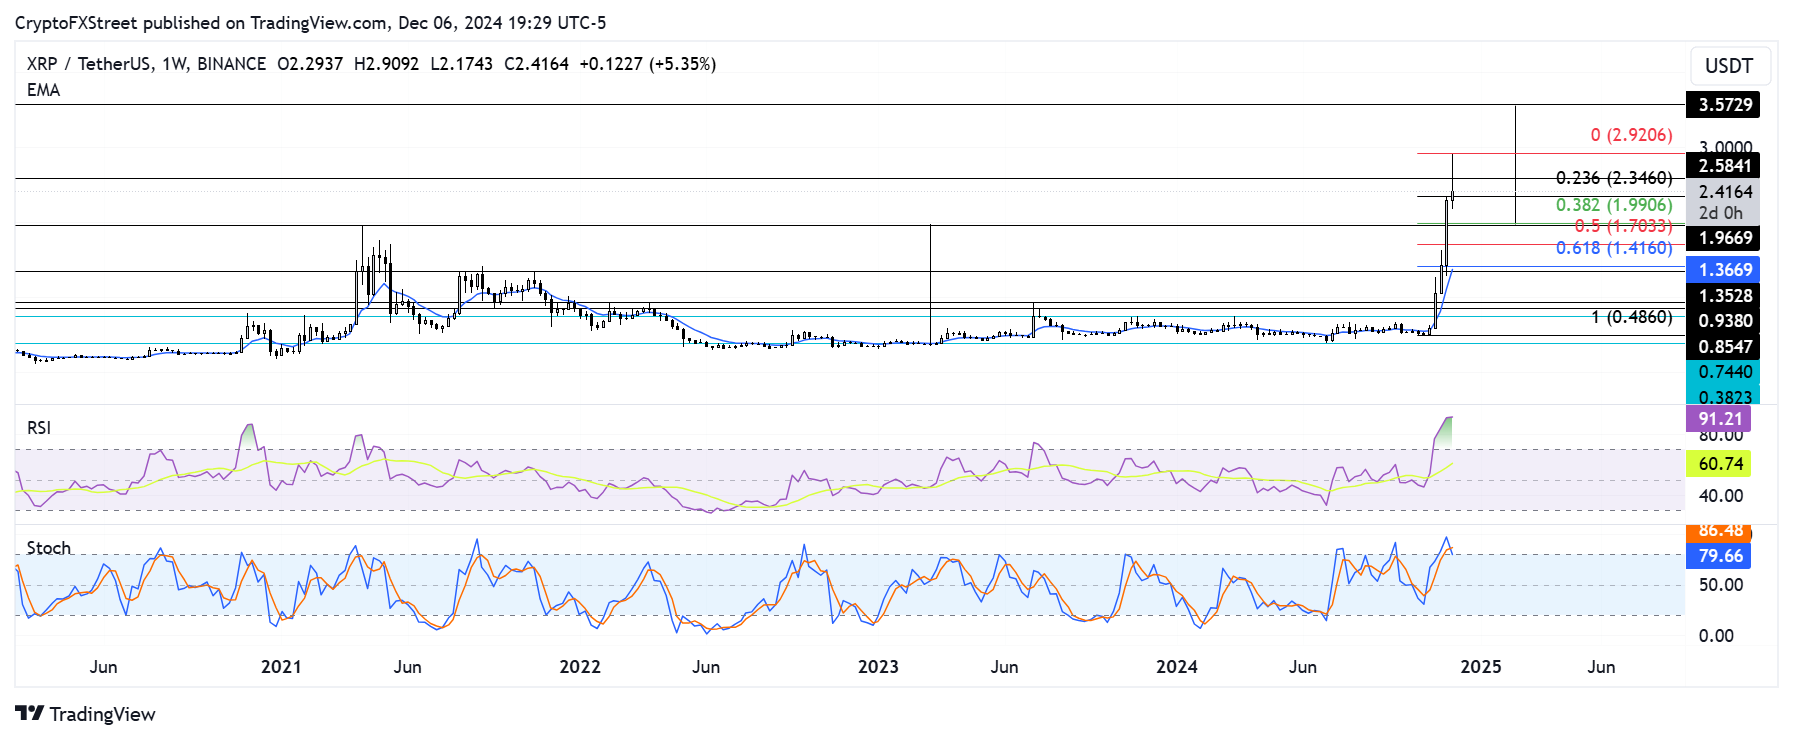
XRP/USDT weekly chart
A move above this level could see XRP complete the maximum profit target of a multi-year rounded bottom by rallying above its all-time high of $3.4 to set a new record at $3.57.
The Relative Strength Index (RSI) is in the overbought region, indicating prices are getting overheated and a potential correction is imminent. The Stochastic Oscillator is in the overbought region but trending downward, indicating weakening bullish momentum.
A weekly candlestick close below the $1.96 level near the 50% Fib Retracement will invalidate the bullish thesis and send XRP to find support near the 61.8% Fib level.
Ripple FAQs
Ripple is a payments company that specializes in cross-border remittance. The company does this by leveraging blockchain technology. RippleNet is a network used for payments transfer created by Ripple Labs Inc. and is open to financial institutions worldwide. The company also leverages the XRP token.
XRP is the native token of the decentralized blockchain XRPLedger. The token is used by Ripple Labs to facilitate transactions on the XRPLedger, helping financial institutions transfer value in a borderless manner. XRP therefore facilitates trustless and instant payments on the XRPLedger chain, helping financial firms save on the cost of transacting worldwide.
XRPLedger is based on a distributed ledger technology and the blockchain using XRP to power transactions. The ledger is different from other blockchains as it has a built-in inflammatory protocol that helps fight spam and distributed denial-of-service (DDOS) attacks. The XRPL is maintained by a peer-to-peer network known as the global XRP Ledger community.
XRP uses the interledger standard. This is a blockchain protocol that aids payments across different networks. For instance, XRP’s blockchain can connect the ledgers of two or more banks. This effectively removes intermediaries and the need for centralization in the system. XRP acts as the native token of the XRPLedger blockchain engineered by Jed McCaleb, Arthur Britto and David Schwartz.
Recommended Articles


