

Solana (SOL) Price Shows Signs of Consolidation After Reaching a New All-Time High
Solana (SOL) price is currently 12% below its all-time high, which was reached on November 22. Despite this recent pullback, SOL remains one of the year’s top performers, boasting an impressive 275.85% gain year-to-date.
Recent technical indicators, including the BBTrend, DMI, and EMA lines, suggest the market may be entering a consolidation phase. This could set the stage for SOL to test key support and resistance levels as it seeks its next major move.
SOL BBTrend Is Negative, But Far from Its Peak
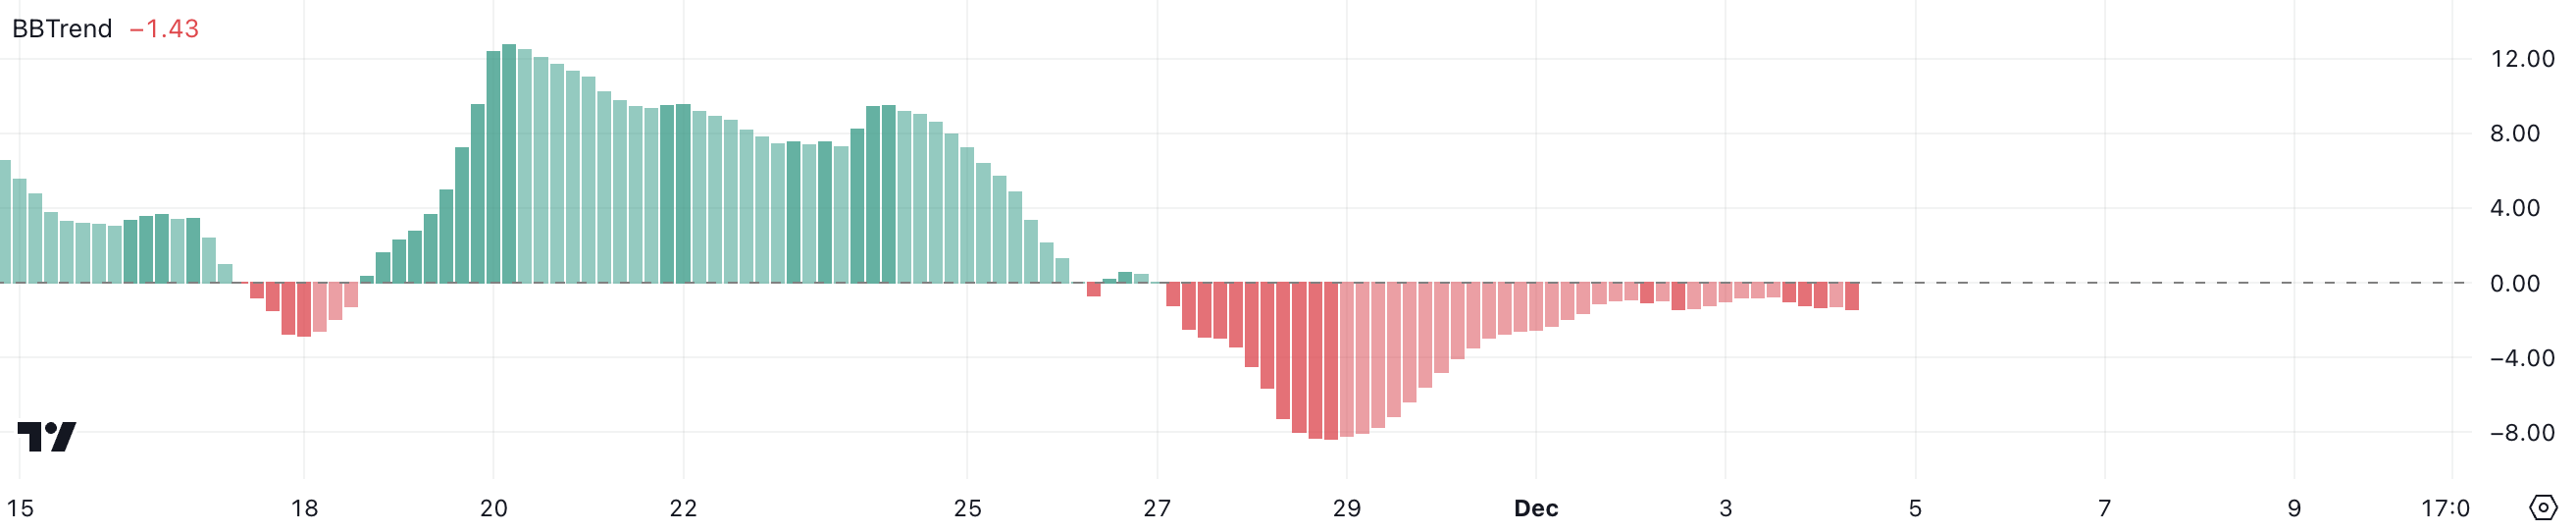
SOL’s BBTrend is currently at -1.43, recovering from its peak negative level of -8.34 on November 28. Although it has remained negative since November 27, this less extreme reading suggests SOL may be entering a consolidation phase.
SOL price could now stabilize within a narrower range as the bearish pressure appears to be easing.
 SOL BBTrend. Source: TradingView
BBTrend measures price momentum relative to Bollinger Bands, with negative values indicating downward pressure and positive values signaling upward trends.
Solana current BBTrend level, while still negative, is far less bearish than its previous lows. This may reflect a transition phase, where the market is pausing to decide its next major move.
Solana Trend Isn’t Strong
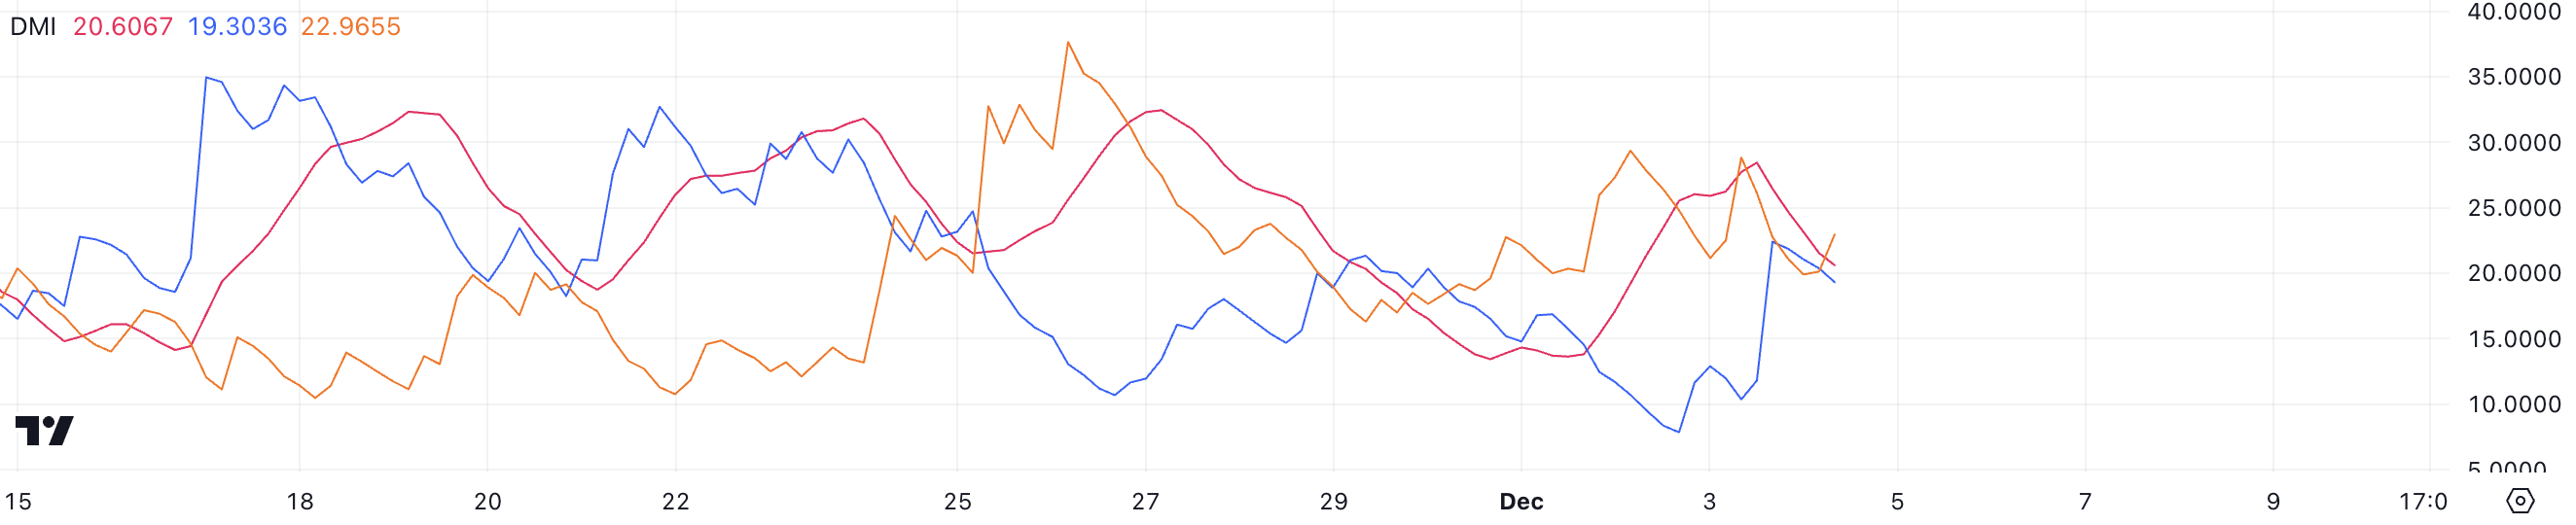
SOL’s DMI chart indicates that its ADX has dropped to 20.6, down from nearly 30 just a day ago. This decline suggests weakening trend strength, potentially signaling reduced market momentum.
Meanwhile, the D+ is at 19.3 and the D- is slightly higher at 22.9, implying a slight bearish advantage as sellers maintain control over buyers.
 SOL DMI. Source: TradingView
The ADX (Average Directional Index) measures trend strength, regardless of direction. Values above 25 indicate a strong trend, while values below suggest a weak or consolidating market.
With D+ representing buying pressure and D- selling pressure, SOL current DMI readings highlight a market still leaning bearish but with less conviction, suggesting potential for consolidation or a shift in momentum.
SOL Price Prediction: A Consolidation Before Trying New All-Time High?
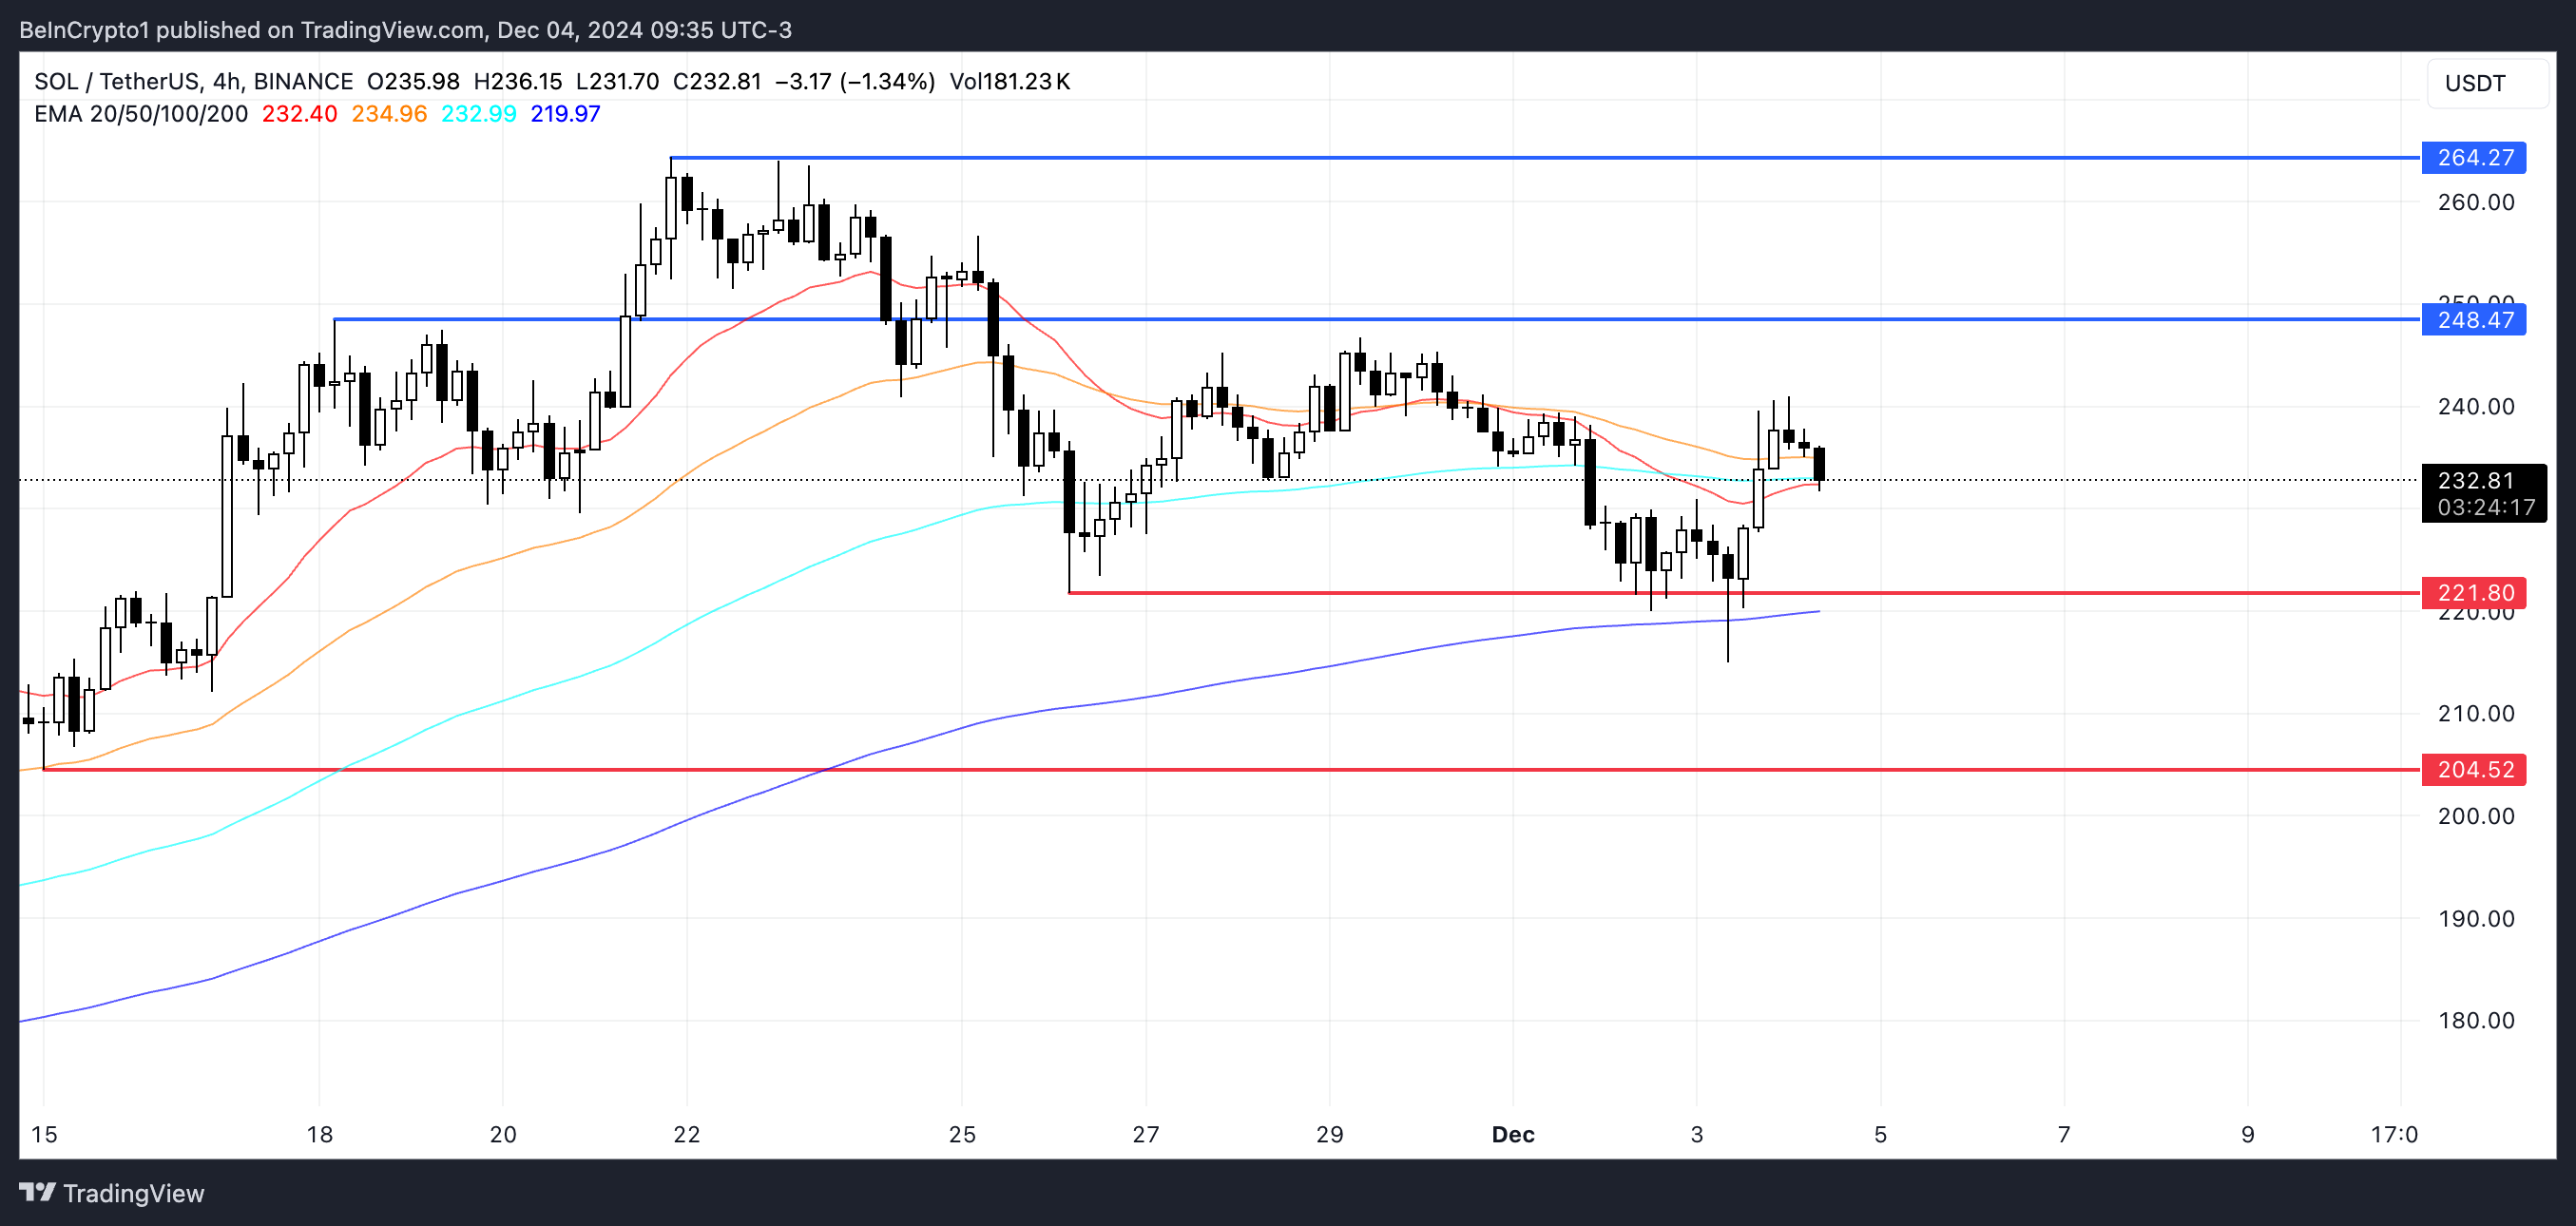
Solana EMA lines recently displayed a bearish signal as a short-term line crossed below a long-term line. However, the narrow gap between the lines suggests consolidation rather than a strong downtrend.
This could indicate a pause in market direction as traders await further cues.
 SOL Price Analysis. Source: TradingView
If a downtrend develops, SOL price might test support at $221, with a further drop to $204 if this level fails. On the other hand, a recovery could push Solana toward a key resistance at $248.
Breaking this level could open the path to retesting its previous all-time high near $264.
Recommended Articles


