

Bitcoin Price Forecast: BTC soars to a new all-time of $75,407 as Trump wins US presidential election
Bitcoin price today:$73,200
- Bitcoin soars to a new all-time high of $75,407 on Wednesday as Trump wins the US presidential election.
- The technical outlook suggests that BTC’s next target could be the 141.40% Fibonacci extension level above $78,000.
- Reports show the so-called Trump trade – long positions in the US Dollar, crypto, and higher Treasury yields – gaining momentum.
Bitcoin (BTC) soared over 7% to a new all-time high of $75,407 on Wednesday as Donald Trump was elected as the 47th President of the United States, the candidate that was seen as more favorable for crypto markets due to his pro-crypto stances.
Technical indicators suggest BTC could head to the next target at the $78,777-$78,955 region, with reports highlighting the growing momentum of the so-called Trump trade, which is based on long positions in the US Dollar (USD), crypto, and higher Treasury yields.
Bitcoin hits fresh all-time high as Trump wins
Bitcoin breaks above the all-time high of $73,777 on Wednesday and soars to a new all-time high of $75,407 as Donald Trump has been elected as the next US president.
Trump’s win in Wisconsin – among other key swing states – put him over the 270 threshold needed to clinch the presidency, according to the Associated Press.
“The ‘Trump trade’ – encompassing long positions in the dollar, crypto, and bets on higher Treasury yields – has gained traction leading up to the election, buoyed by Trump’s lead in prediction markets,” says a report from crypto-asset trading firm QCP.
“USD is gaining due to the market view that Donald Trump’s economic agenda and tariffs will strengthen the US Dollar. This, in turn, is negative for Gold since it is mainly priced and traded in USD. Investors’ preference for other riskier assets, including Bitcoin (BTC) and equities, also sees flows exiting Gold,” says Joaquin Monfort, analyst at FXStreet.
Donald Trump is considered more pro-crypto than Kamala Harris. Trump did great outreach to the crypto industry by speaking at a Bitcoin conference. Trump proposed creating a strategic national Bitcoin stockpile to position the US as a leader in cryptocurrency adoption, announced plans to establish a Bitcoin and crypto presidential advisory council for clearer regulatory guidelines, and made other statements appealing to the industry, including promising to fire Securities and Exchange Commission (SEC) Chair Gary Gensler.
Bitcoin ETFs post outflows, profit-taking increases
Coinglass ETF data shows that US spot Exchange Traded Funds (ETFs) recorded a second day of outflow totaling $657.9 million until Tuesday, hinting at a decline in institutional demand for Bitcoin. Still, the data is backward-looking as it doesn’t reflect yet the results of the US presidential election.
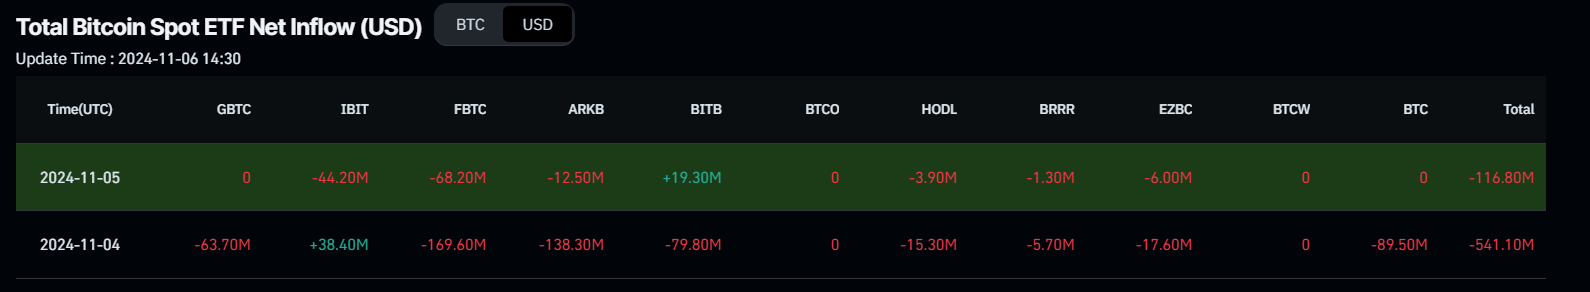
Total Bitcoin Spot ETF Net Inflow chart. Source: Coinglass
Moreover, Santiment’s Network Realized Profit/Loss (NPL) shows that some holders booked some profits, and the indicator spiked from 35.75 million to 909.41 million from Tuesday to Wednesday. This uptick indicates that the holders were, on average, taking profits.
 [16.21.58, 06 Nov, 2024]-638664938788224488.png)
Bitcoin Network Realized Profit/Loss chart. Source: Santiment
Bitcoin Price Forecast: New all-time high of $78,777 on the cards
Bitcoin’s weekly chart shows that the biggest crypto asset by market capitalization broke above the downward-slopping parallel channel pattern and successfully retested the breakout level at around $67,800 in mid-October. It rallied but was rejected around its all-time high of $73,777 last week. As of this week, it continues to rally, breaking above its ATH and forming a new one at $75,407.
If BTC continues to rally, the pattern’s technical target (obtained by measuring the distance between the two trendlines and extrapolating it higher) projects a new ATH of $78,955.
The Relative Strength Index (RSI) momentum indicator on the weekly chart trades at 63, above its neutral level of 50 and still far below overbought conditions, suggesting bullish momentum is gaining traction.
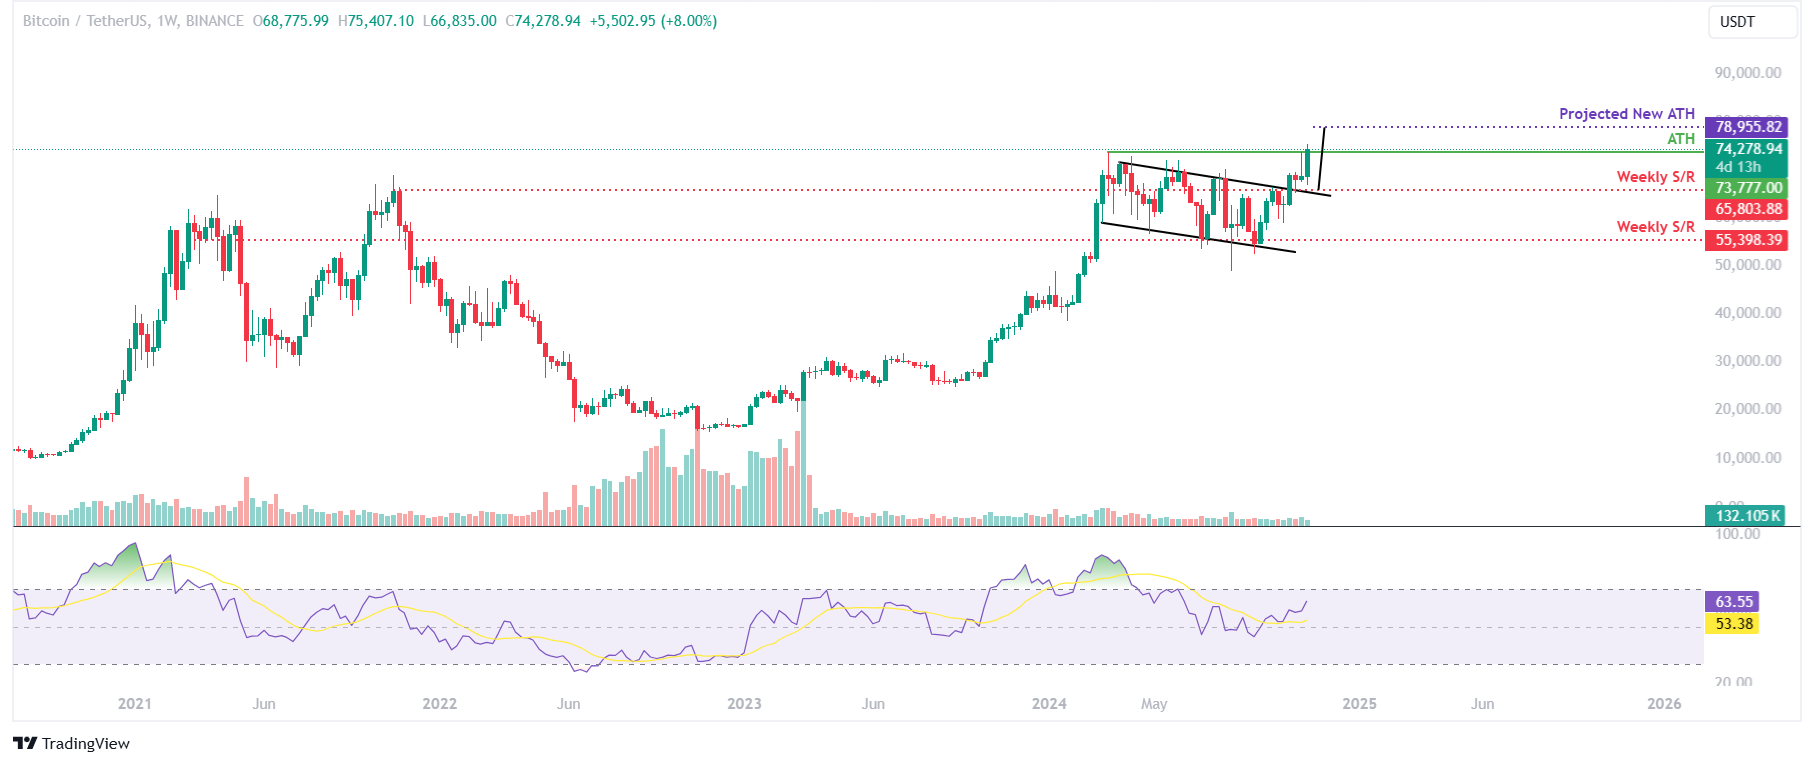
BTC/USDT weekly chart
The daily chart also shows that bulls are in control, hinting at a rally ahead. Bitcoin found support around $67,000 on Monday and rose 2.24% until Tuesday. On Wednesday, it breaks above its ATH of $73,777 and forms a new all-time high of $75,407.
A successful daily close above its former ATH of $73,777 could pave the way for BTC to target the 141.40% Fibonacci extension level (drawn from July’s high of $70,079 to August’s low of $49,072) at $78,777, which closely aligns with the technical target of the downward-sloping parallel channel pattern around $78,955 seen on the weekly chart.
The Relative Strength Index (RSI) on the daily chart has bounced off from its neutral level of 50 and reads 68.
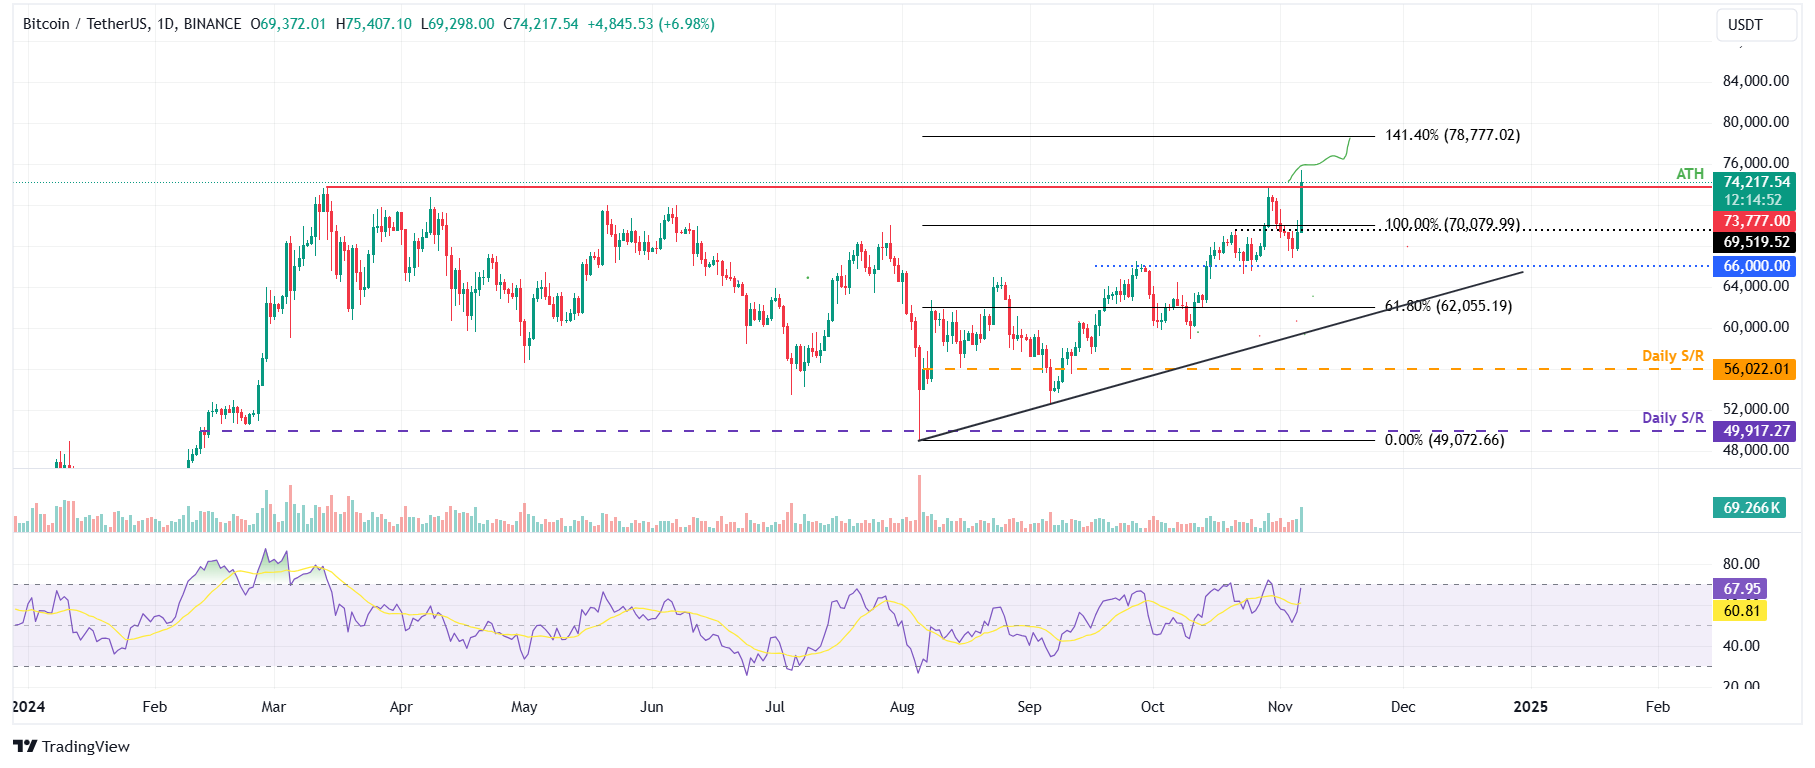
BTC/USDT daily chart
However, if BTC fails to close above $73,777 and declines, it may retest the key psychological level of $70,000.
Bitcoin, altcoins, stablecoins FAQs
Bitcoin is the largest cryptocurrency by market capitalization, a virtual currency designed to serve as money. This form of payment cannot be controlled by any one person, group, or entity, which eliminates the need for third-party participation during financial transactions.
Altcoins are any cryptocurrency apart from Bitcoin, but some also regard Ethereum as a non-altcoin because it is from these two cryptocurrencies that forking happens. If this is true, then Litecoin is the first altcoin, forked from the Bitcoin protocol and, therefore, an “improved” version of it.
Stablecoins are cryptocurrencies designed to have a stable price, with their value backed by a reserve of the asset it represents. To achieve this, the value of any one stablecoin is pegged to a commodity or financial instrument, such as the US Dollar (USD), with its supply regulated by an algorithm or demand. The main goal of stablecoins is to provide an on/off-ramp for investors willing to trade and invest in cryptocurrencies. Stablecoins also allow investors to store value since cryptocurrencies, in general, are subject to volatility.
Bitcoin dominance is the ratio of Bitcoin's market capitalization to the total market capitalization of all cryptocurrencies combined. It provides a clear picture of Bitcoin’s interest among investors. A high BTC dominance typically happens before and during a bull run, in which investors resort to investing in relatively stable and high market capitalization cryptocurrency like Bitcoin. A drop in BTC dominance usually means that investors are moving their capital and/or profits to altcoins in a quest for higher returns, which usually triggers an explosion of altcoin rallies.
Recommended Articles


