


XRP could rise to $0.5608 despite weak on-chain data
- XRP investors are still at an average profit of 32% despite recent sideways price action.
- XRP's futures open interest and trading volume have been weak since October 1.
- XRP could rise to $0.5608 if it maintains bullish momentum and crosses above the 100-day and 200-day SMA.
Ripple's XRP is trading near $0.5140 on Tuesday following declines in several of its on-chain data, which indicates declining investor interest. The remittance-based token could rally toward $0.5608 after crossing above the upper trendline resistance of a symmetry triangle.
XRP suffers waning investor interest
XRP's on-chain data has remained fairly quiet since around October 1, when investors realized profits of over $134 million.
The most recent modest spike was in XRP's Age Consumed on October 20 after prices moved lower and investors realized losses of about $34 million. The Age Consumed metric tracks previously idle coins and spikes when these tokens move between addresses.
As a result, XRP's Market Value to Realized Value (MVRV) Ratio is 32%, indicating that all investors are making an average profit of 32%. However, the percentage of total supply in profit plunged from 90% on October 1 to 70% on Tuesday.
 [22.03.29, 05 Nov, 2024]-638664404108098157.png)
XRP Key On-chain data
Meanwhile, XRP's open interest has remained below $800 million and is trending downwards. Open interest is the total number of unsettled contracts in a derivatives market.
The decline in open interest signifies low investor interest or rising liquidation of XRP positions. XRP's futures volumes indicate the former, as the cryptocurrency's trading volume is low, hovering between $500 million and $1.5 billion since October 1.
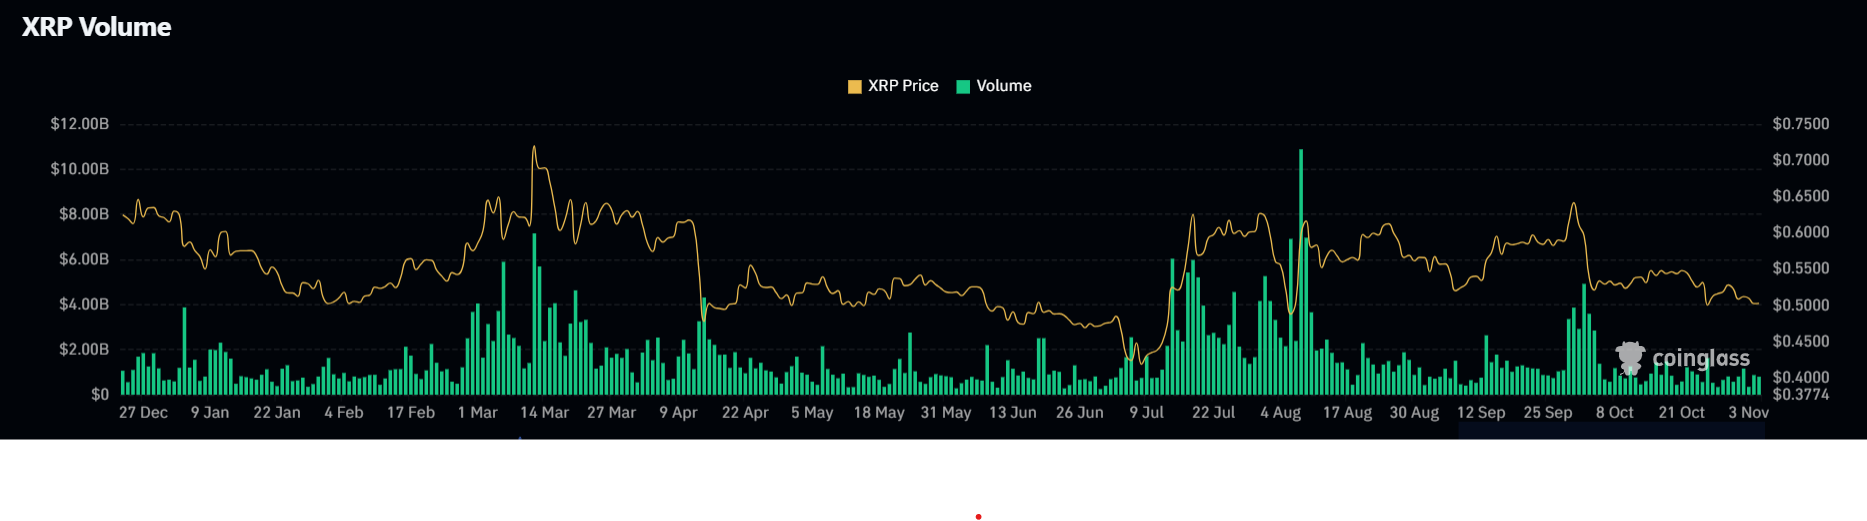
XRP Futures Volume
The XRP long/short ratio from the total volume is 0.935 and has remained below 1 in the past month, indicating that most traders are slightly bearish on the coin.
Ripple technical analysis: XRP could rise to $0.5608
Ripple's XRP is trading near $0.5140, up 2% on the day.
The remittance-based cryptocurrency has crossed above the upper boundary of a symmetrical triangle and the 50-day Simple Moving Average (SMA).
If XRP maintains the momentum and crosses above the 100-day and 200-day SMA, it could rally toward $0.5608. The Relative Strength Index (RSI) and Stochastic Oscillator have crossed above their midlines, indicating bullish pressure is dominant.
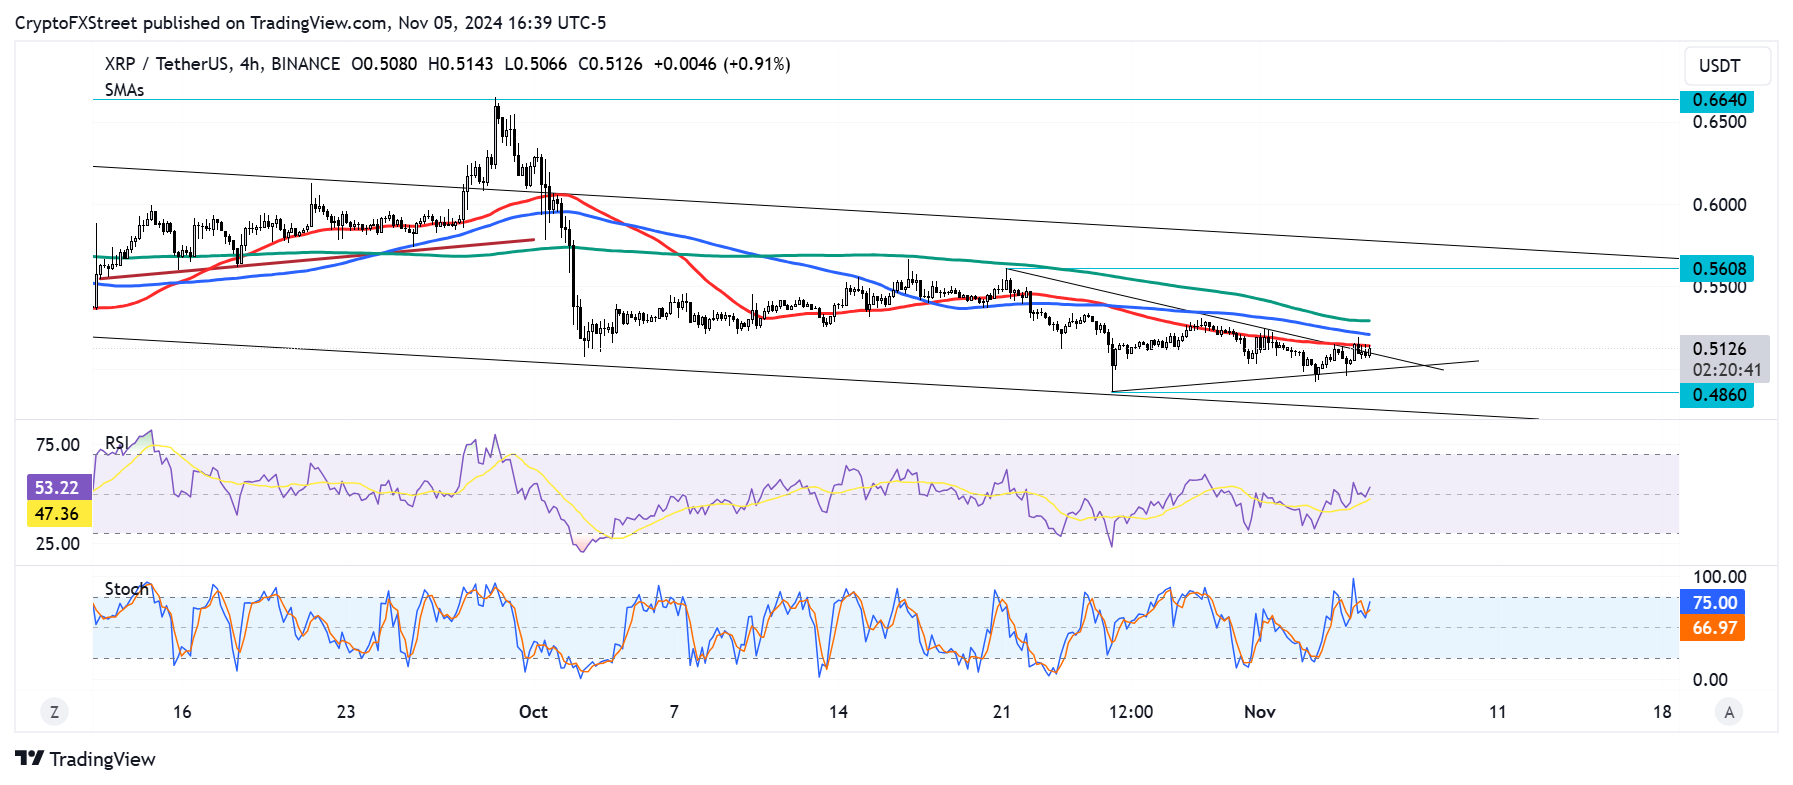
XRP/USDT 4-hour chart
However, a rejection near the 200-day SMA could send its price toward the support level at $0.4860. A daily candlestick close below $0.4860 will invalidate the thesis and send the price lower toward $0.4500.
Ripple FAQs
Ripple is a payments company that specializes in cross-border remittance. The company does this by leveraging blockchain technology. RippleNet is a network used for payments transfer created by Ripple Labs Inc. and is open to financial institutions worldwide. The company also leverages the XRP token.
XRP is the native token of the decentralized blockchain XRPLedger. The token is used by Ripple Labs to facilitate transactions on the XRPLedger, helping financial institutions transfer value in a borderless manner. XRP therefore facilitates trustless and instant payments on the XRPLedger chain, helping financial firms save on the cost of transacting worldwide.
XRPLedger is based on a distributed ledger technology and the blockchain using XRP to power transactions. The ledger is different from other blockchains as it has a built-in inflammatory protocol that helps fight spam and distributed denial-of-service (DDOS) attacks. The XRPL is maintained by a peer-to-peer network known as the global XRP Ledger community.
XRP uses the interledger standard. This is a blockchain protocol that aids payments across different networks. For instance, XRP’s blockchain can connect the ledgers of two or more banks. This effectively removes intermediaries and the need for centralization in the system. XRP acts as the native token of the XRPLedger blockchain engineered by Jed McCaleb, Arthur Britto and David Schwartz.
Recommended Articles


