

Bearish Indicators Keep Dogecoin (DOGE) Price Under Pressure
Dogecoin (DOGE) price is at a pivotal moment, with technical indicators hinting at potential downside risks. The Ichimoku Cloud and DMI both point to a bearish sentiment as sellers maintain control over the trend.
Narrowing EMA lines suggest weakening bullish momentum, raising the possibility of a stronger downtrend if short-term lines cross below the longer-term ones. DOGE’s price trajectory now hinges on whether it can hold support or break through resistance.
DOGE Ichimoku Cloud Shows a Bearish Scenario
The Ichimoku Cloud chart for DOGE indicates a current bearish sentiment in the market. The price has recently moved below the cloud, which is generally seen as a negative signal, suggesting downward pressure.
This setup implies that sellers are in control, and there may be limited buying interest at these levels. However, the fact that the cloud’s color is green indicates that buyers are trying to recover control.
Read more: How To Buy Dogecoin (DOGE) and Everything You Need To Know
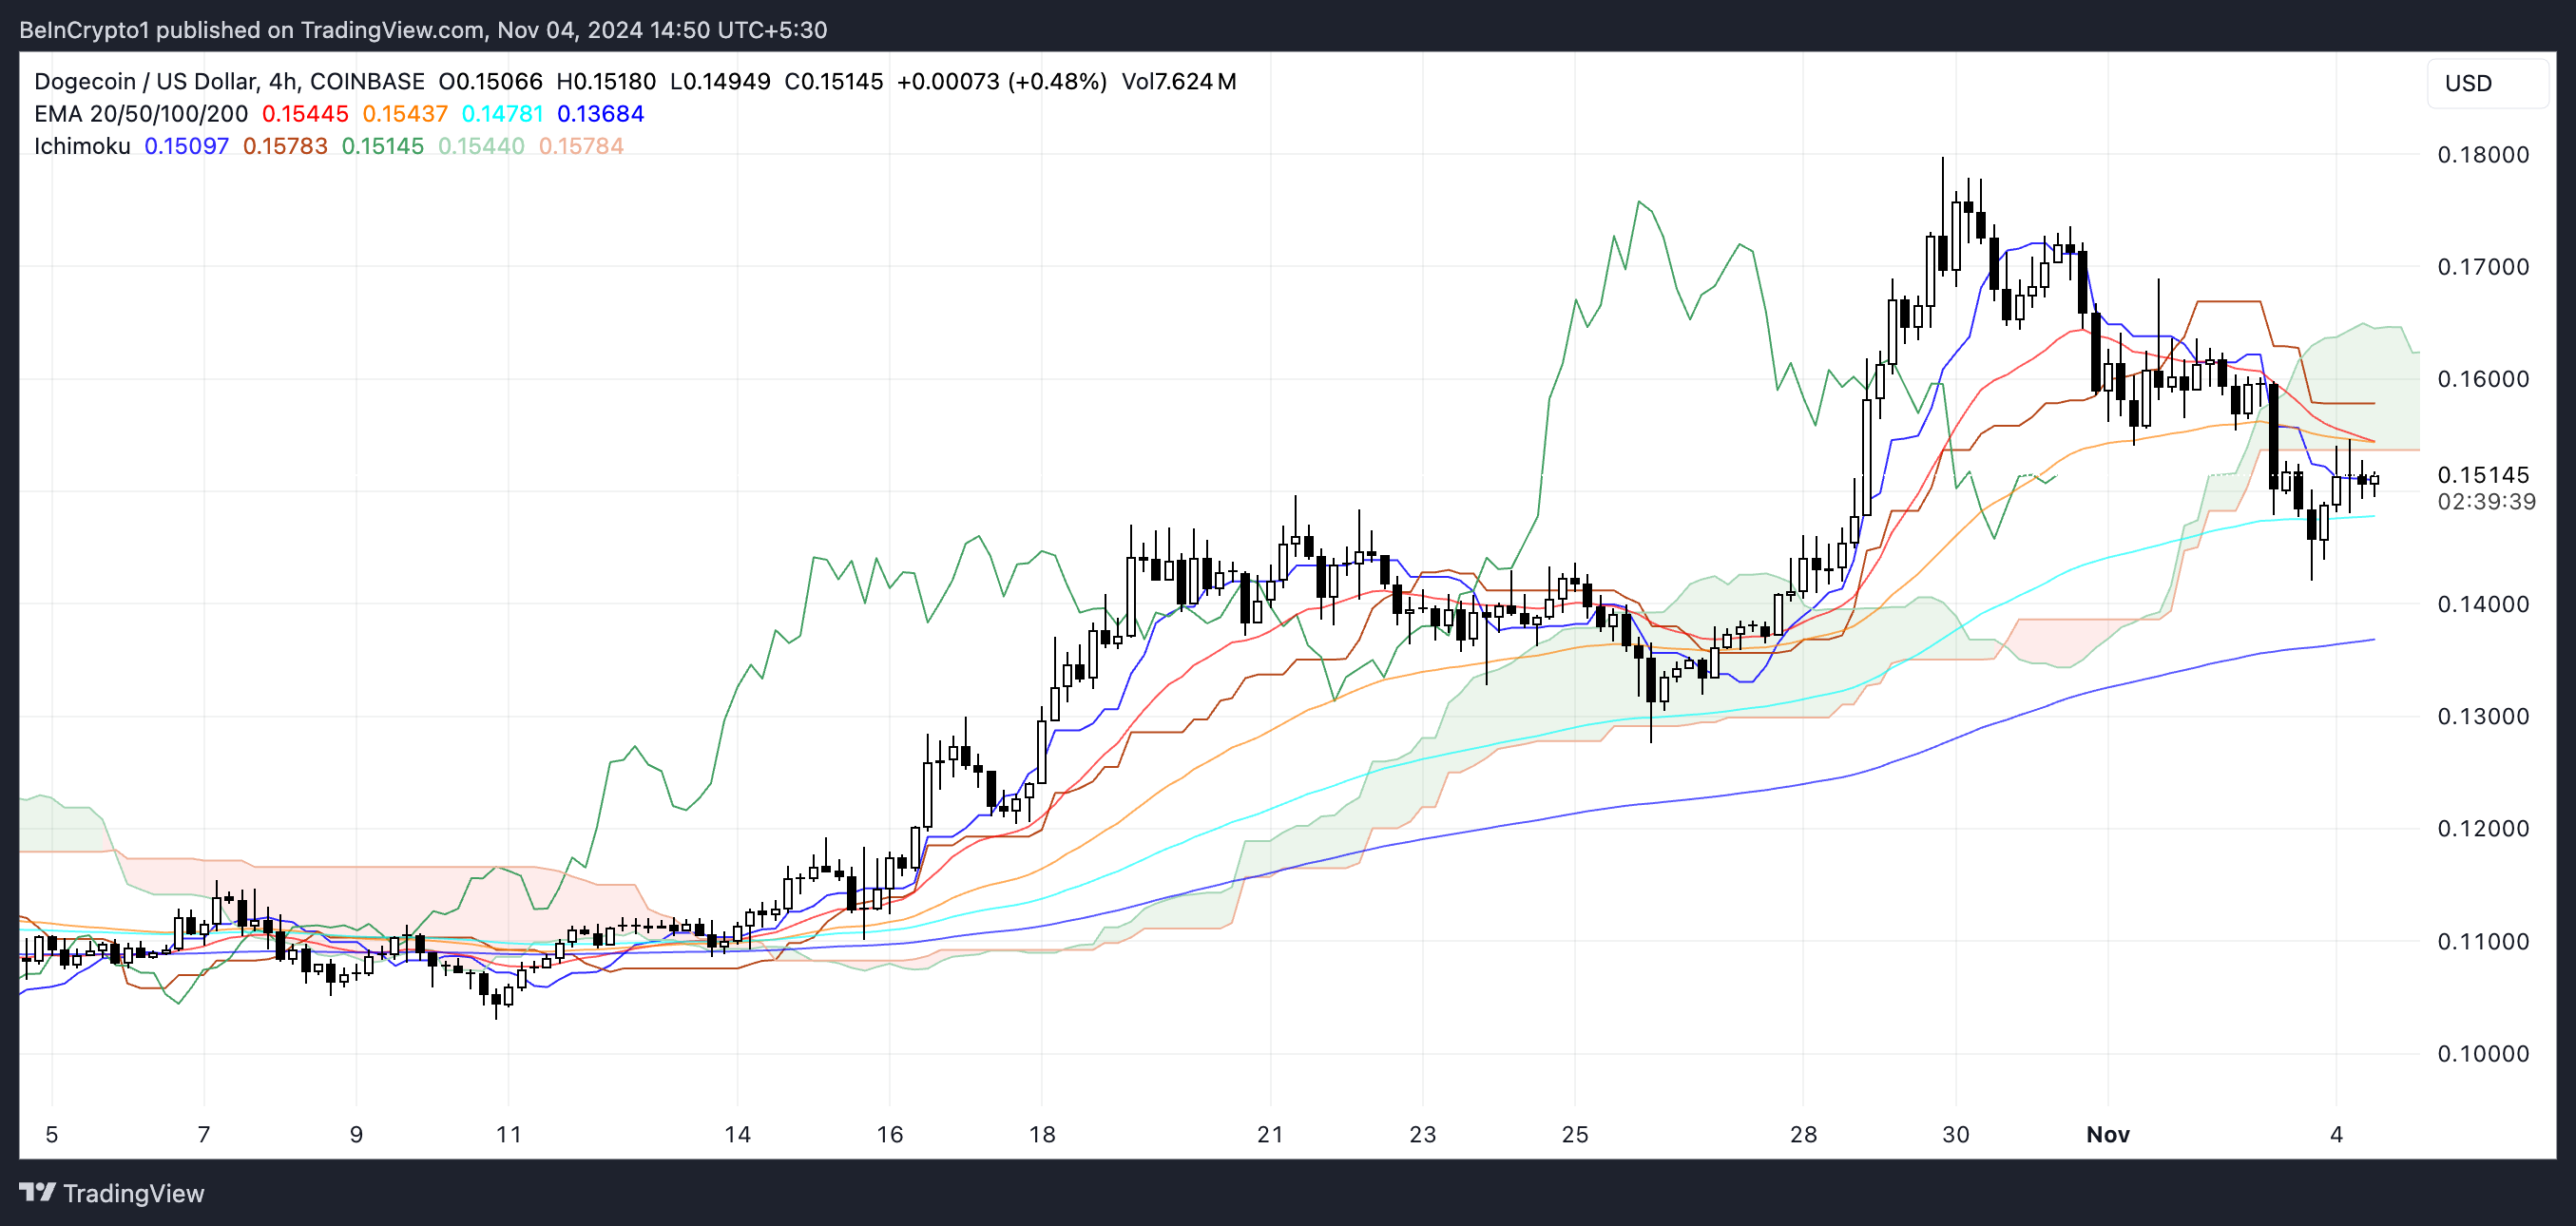 DOGE Ichimoku Cloud. Source: TradingView
If DOGE manages to break back above the cloud, it could indicate a potential reversal, but with the current indicators, the likelihood remains low.
Overall, the bearish configuration of the Ichimoku Cloud shows that DOGE may continue to face downward pressure unless there is a strong reversal signal in the coming sessions.
Dogecoin’s Downtrend Is Strong
DOGE’s DMI (Directional Movement Index) chart shows the ADX at 24.2, indicating a moderately strong trend, although not firmly directional. An ADX reading near 25 generally suggests that a trend is present but not strong, implying that while there is momentum, it lacks substantial strength.
In this case, the ADX above 20 signals that the current trend in DOGE’s price movement may persist, but it may not accelerate dramatically without further support.
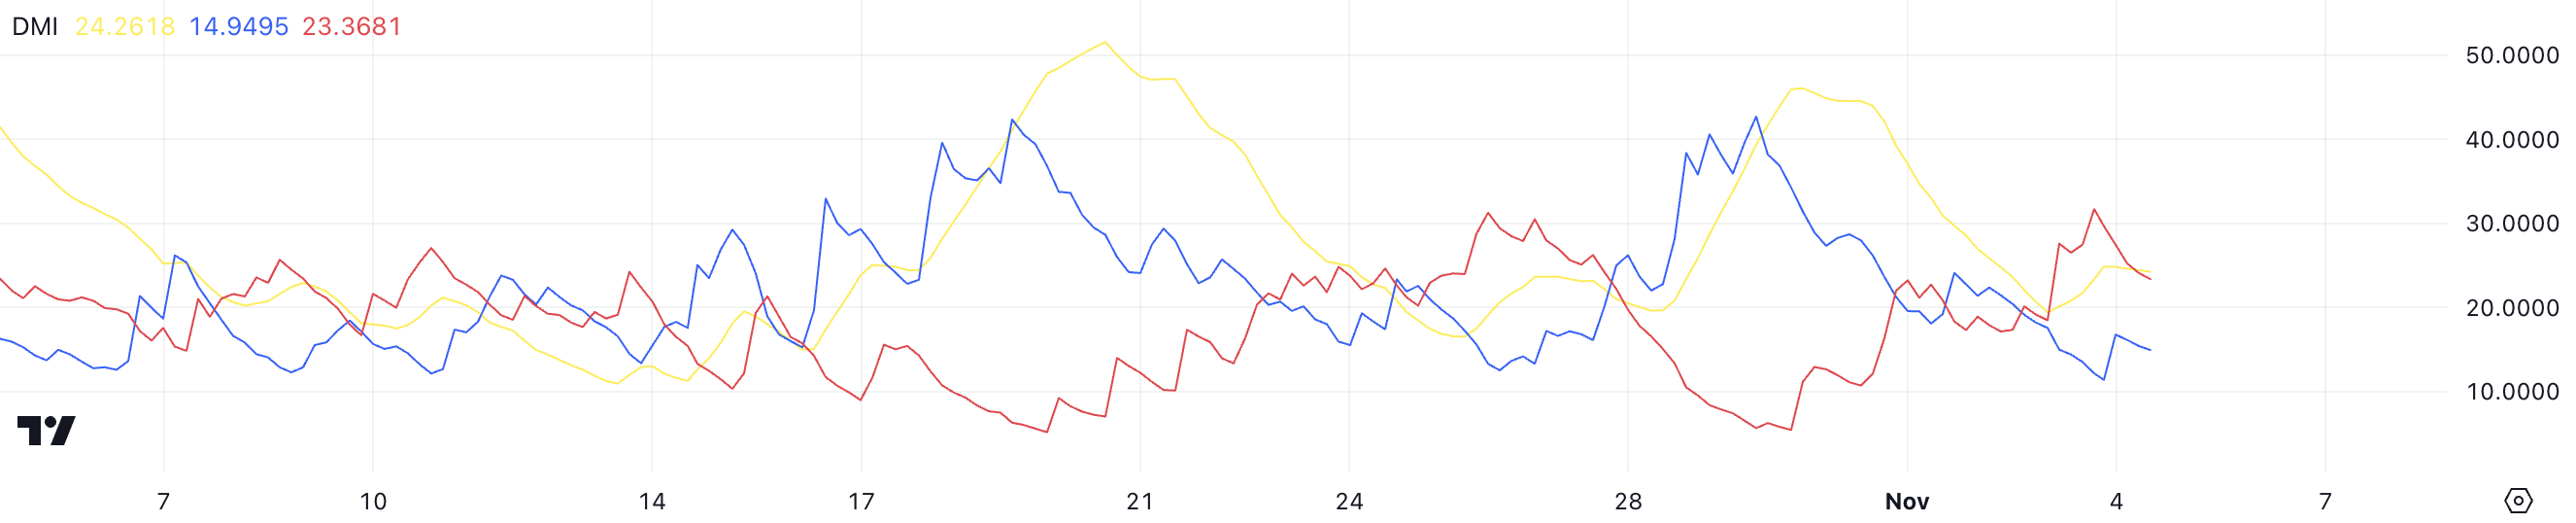 DOGE DMI. Source: TradingView
The DMI chart itself measures both the strength and direction of a trend through the ADX and two directional indicators, +DI and -DI. The ADX reflects trend strength, while +DI and -DI indicate upward and downward pressure, respectively.
Currently, DOGE’s +DI stands at 14.9, and -DI is at 23.3, showing that downward pressure is stronger than upward momentum. With -DI above +DI, sellers have the upper hand, suggesting that the biggest meme coin in the market may face continued downward pressure in the short term unless there’s a shift in buying interest.
DOGE Price Prediction: 15.8% Correction Likely Ahead
DOGE’s price chart currently shows its EMA lines in a potentially precarious position, with indications that a bearish setting may be forming. While the EMAs still maintain a bullish structure — short-term lines positioned above the long-term ones — the gap between them is narrowing.
This convergence signals a possible loss in bullish momentum, as the most recent short-term EMA has started to decline significantly. If this short-term line crosses below the long-term EMAs, it would establish a strong bearish configuration, suggesting further downward pressure on DOGE’s price.
Read more: Dogecoin (DOGE) Price Prediction 2024/2025/2030
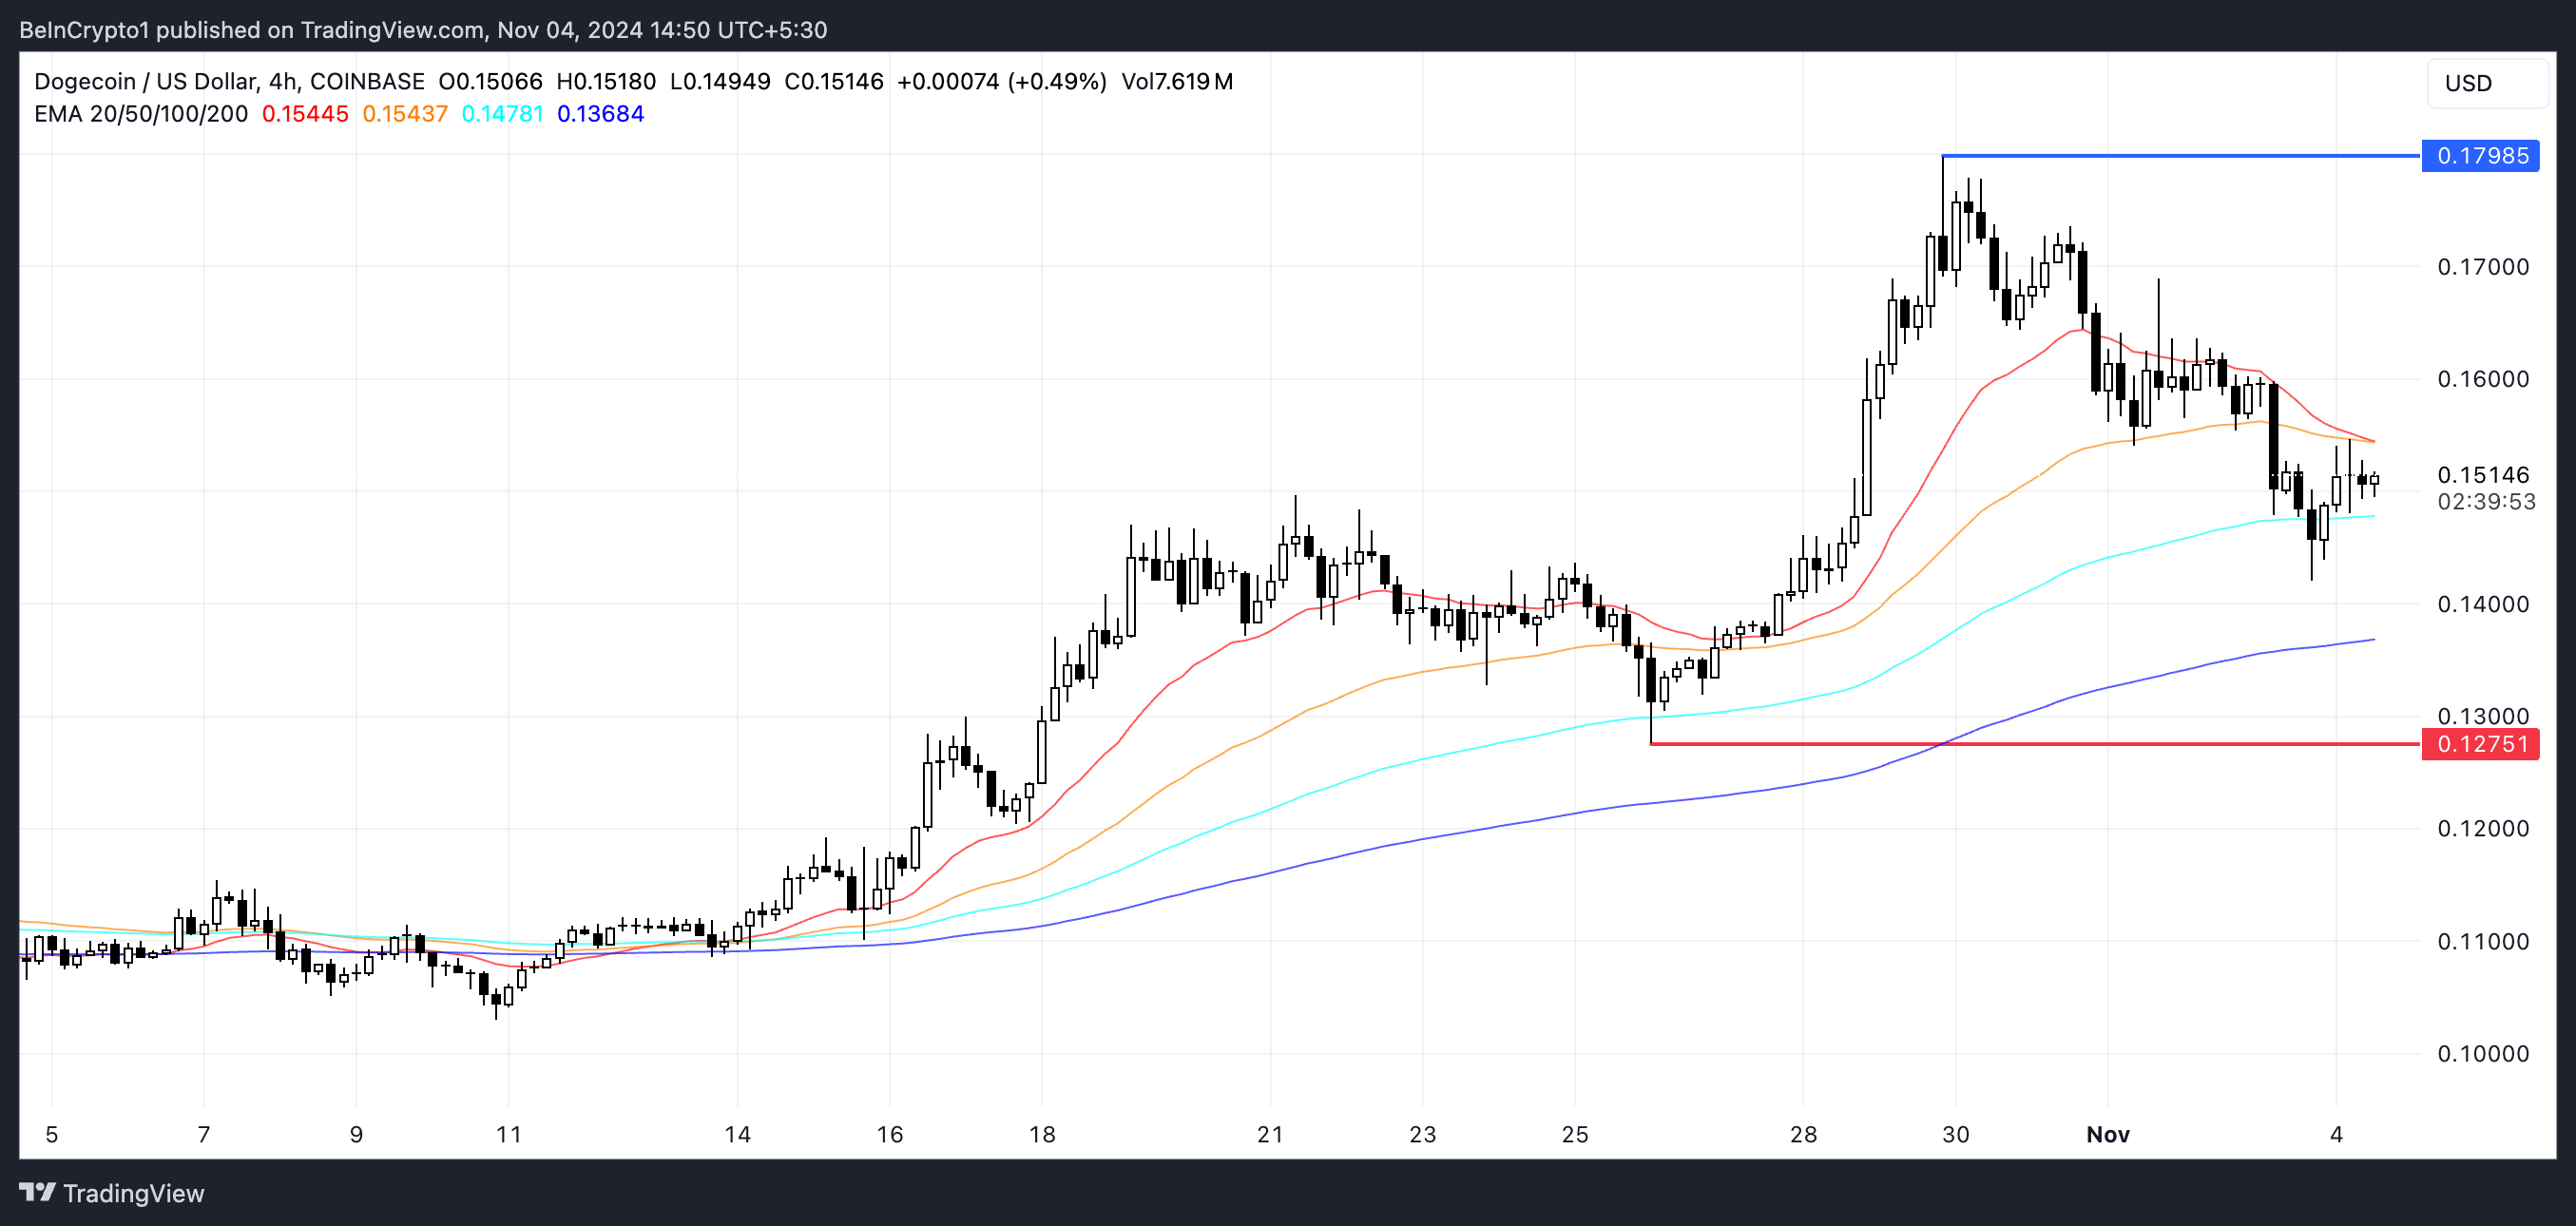 DOGE EMA Lines and Support and Resistance. Source: TradingView
Should this bearish setup materialize, DOGE price could test the next support level at $0.127, indicating a potential retracement in the current price.
However, if the trend reverses and DOGE shifts into an uptrend, it may attempt to retest its previous resistance at $0.179, representing a potential 18.5% price increase.
Recommended Articles


