

GRASS 24% Price Decline Could Open Doors to Extended Downtrend: Here’s Why
In the early hours of November 2, Grass (GRASS) crypto price appeared on track to reach the $2 mark. However, a 23.34% drop over the past 24 hours has halted its impressive week-long rally, pulling the price down to $1.35.
This analysis suggests that GRASS’ crypto price could fall even further from this level. Here’s why.
Grass Bears Take Bulls Out of the Way
Grass, a layer-2 Decentralized Physical Infrastructure Networks (DePIN) project on Solana, launched its native token on October 28. Within just a few days, the altcoin’s value surged by 100%, even with tokens distributed to users through its airdrop.
However, that impressive increase has now dwindled to 67% over the past week. Analyzing the daily chart, we see that the Bull Bear Power (BBP) has fallen into negative territory. The BBP measures the strength of buyers (bulls) relative to sellers (bears).
When the BBP is in the green, it signifies bullish dominance, often leading to price increases. In this instance, the decline in GRASS’s crypto price coincides with a significant drop in the BBP reading, suggesting that bears are currently in control.
Read more: What Is DePIN (Decentralized Physical Infrastructure Networks)?
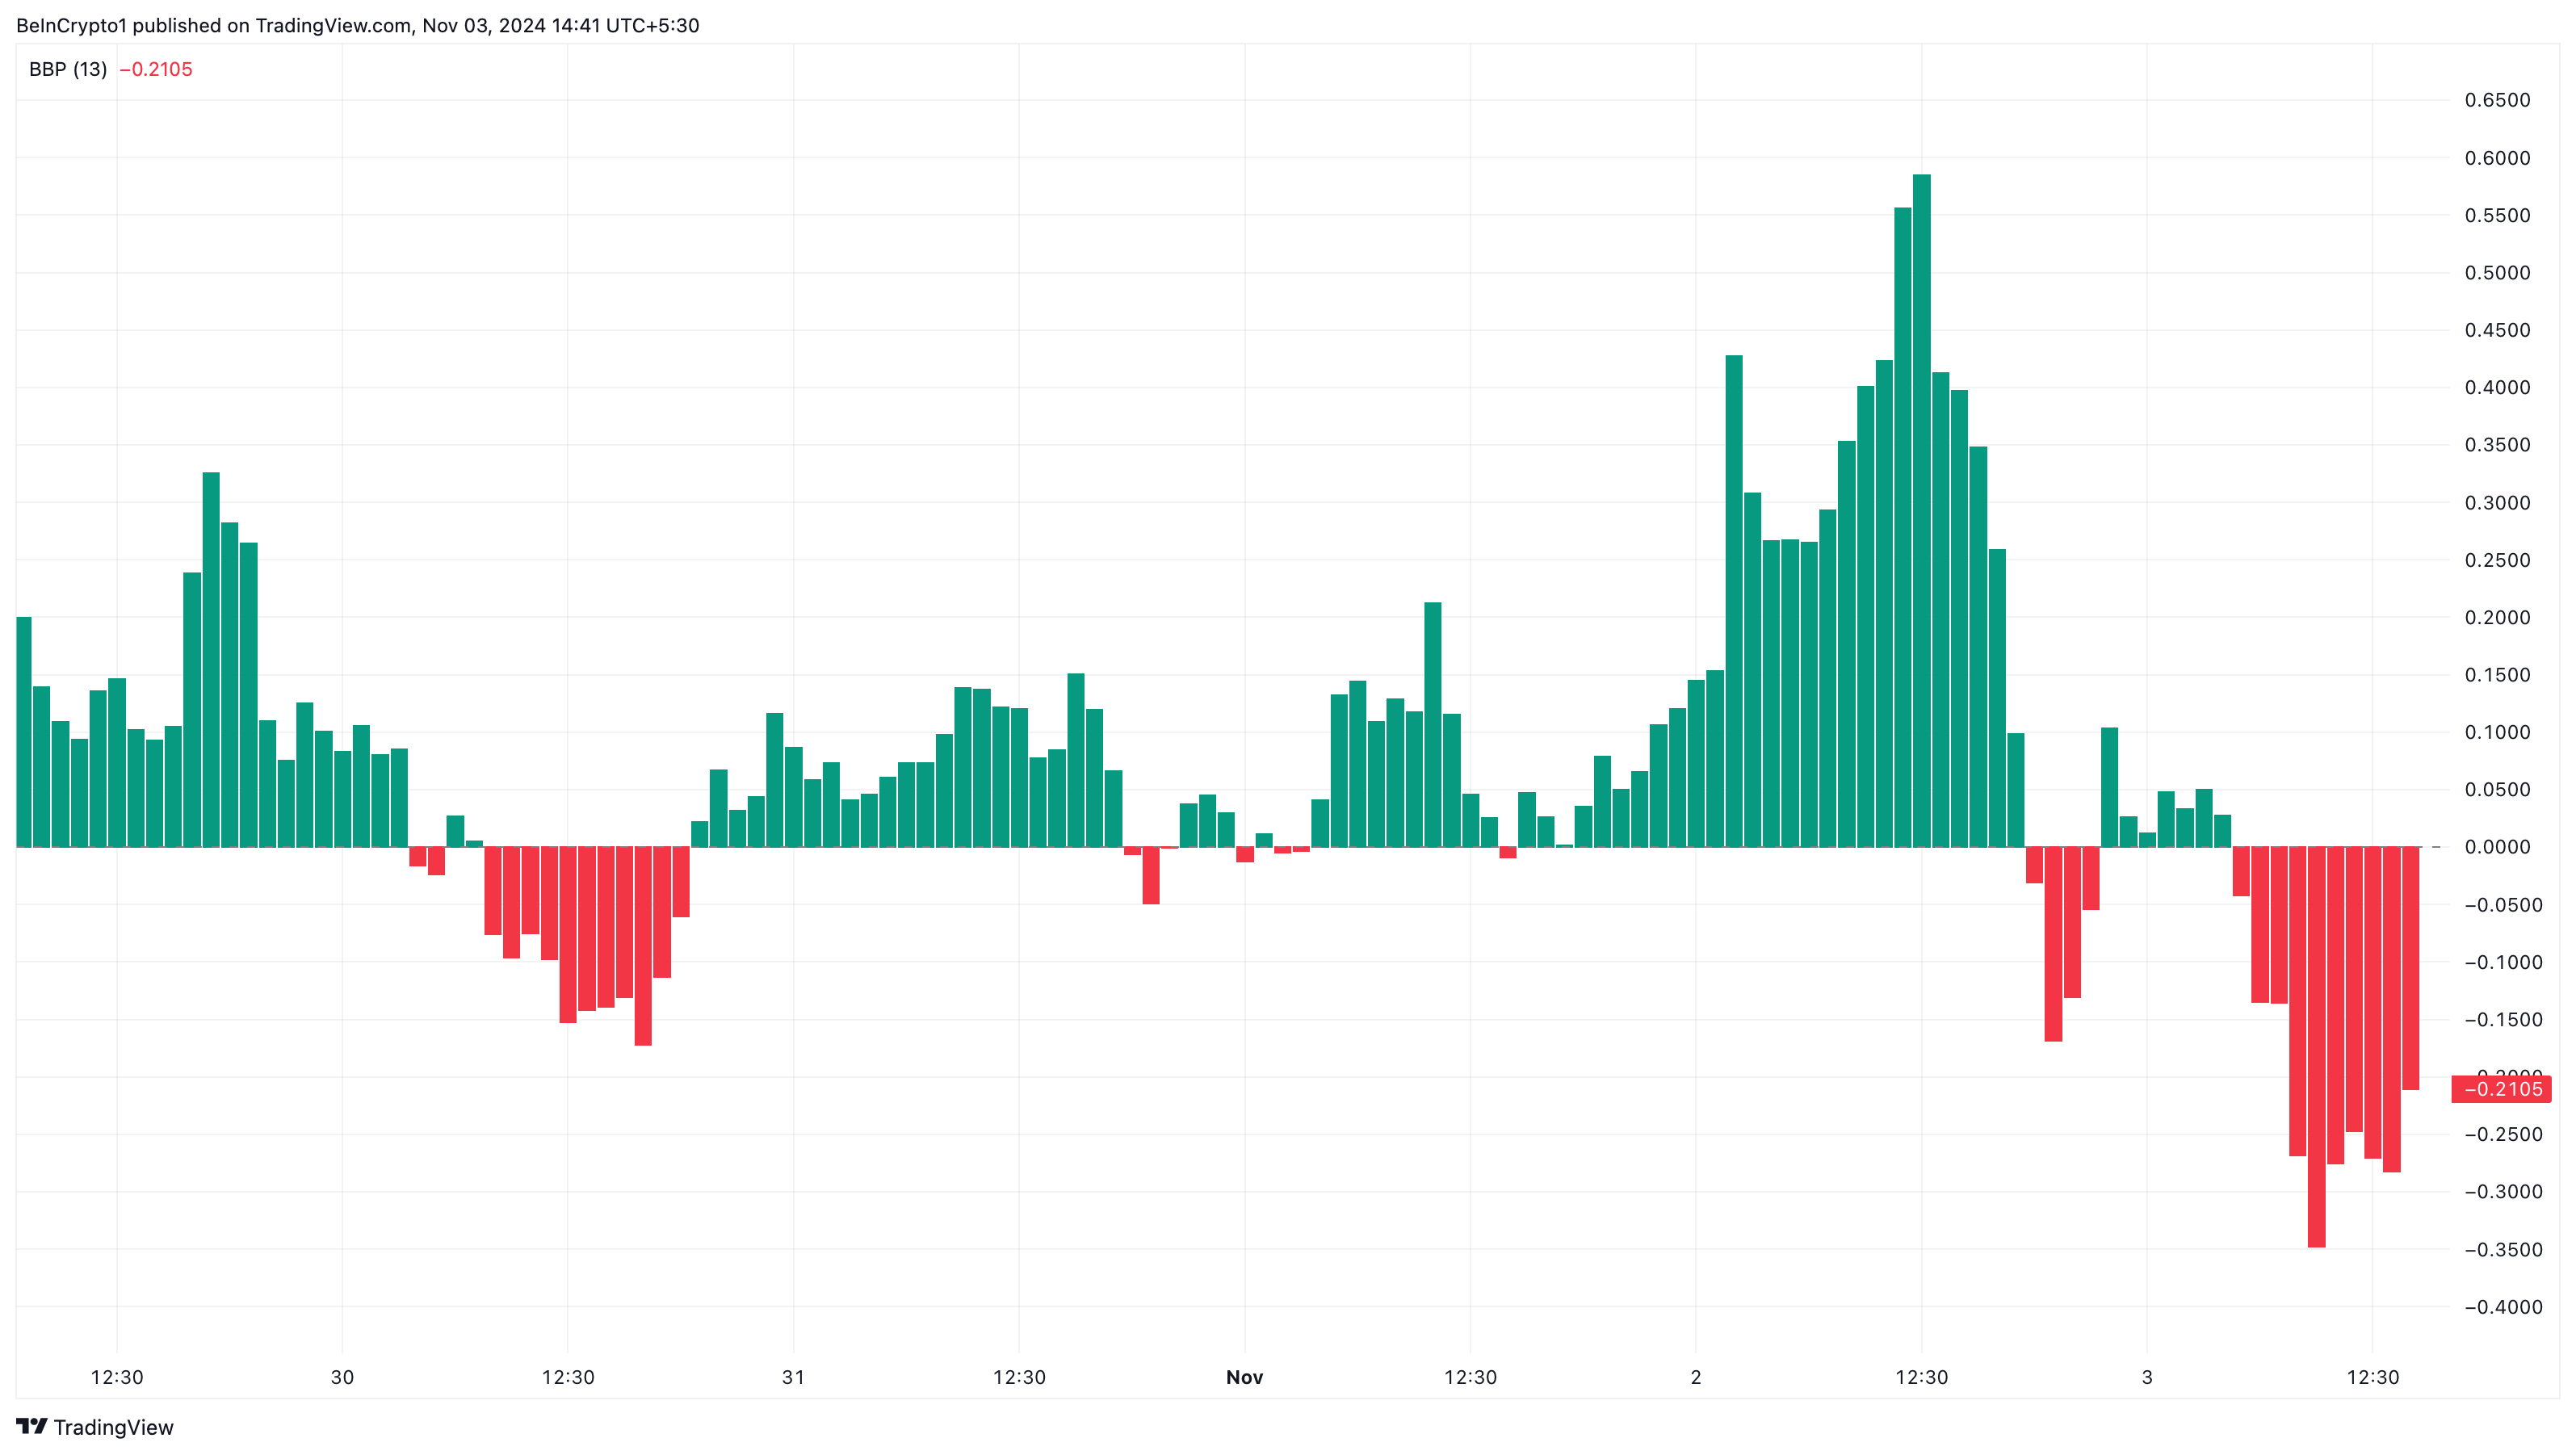 Grass Bull Bear Power. Source: TradingView
Like the BBP, the Accumulation/Distribution (A/D) line reinforces the bias that bears might continue to drag the Grass crypto price down.
The A/D assesses an asset’s supply and demand by examining where the price closes within a given period’s range and then multiplying that closing position by the volume.
When the indicator’s reading rises, the demand increases. But in this case, the indicator’s rating has decreased to the negative region, suggesting that distribution outweighs accumulation, and therefore, the GRASS value could continue to go down.
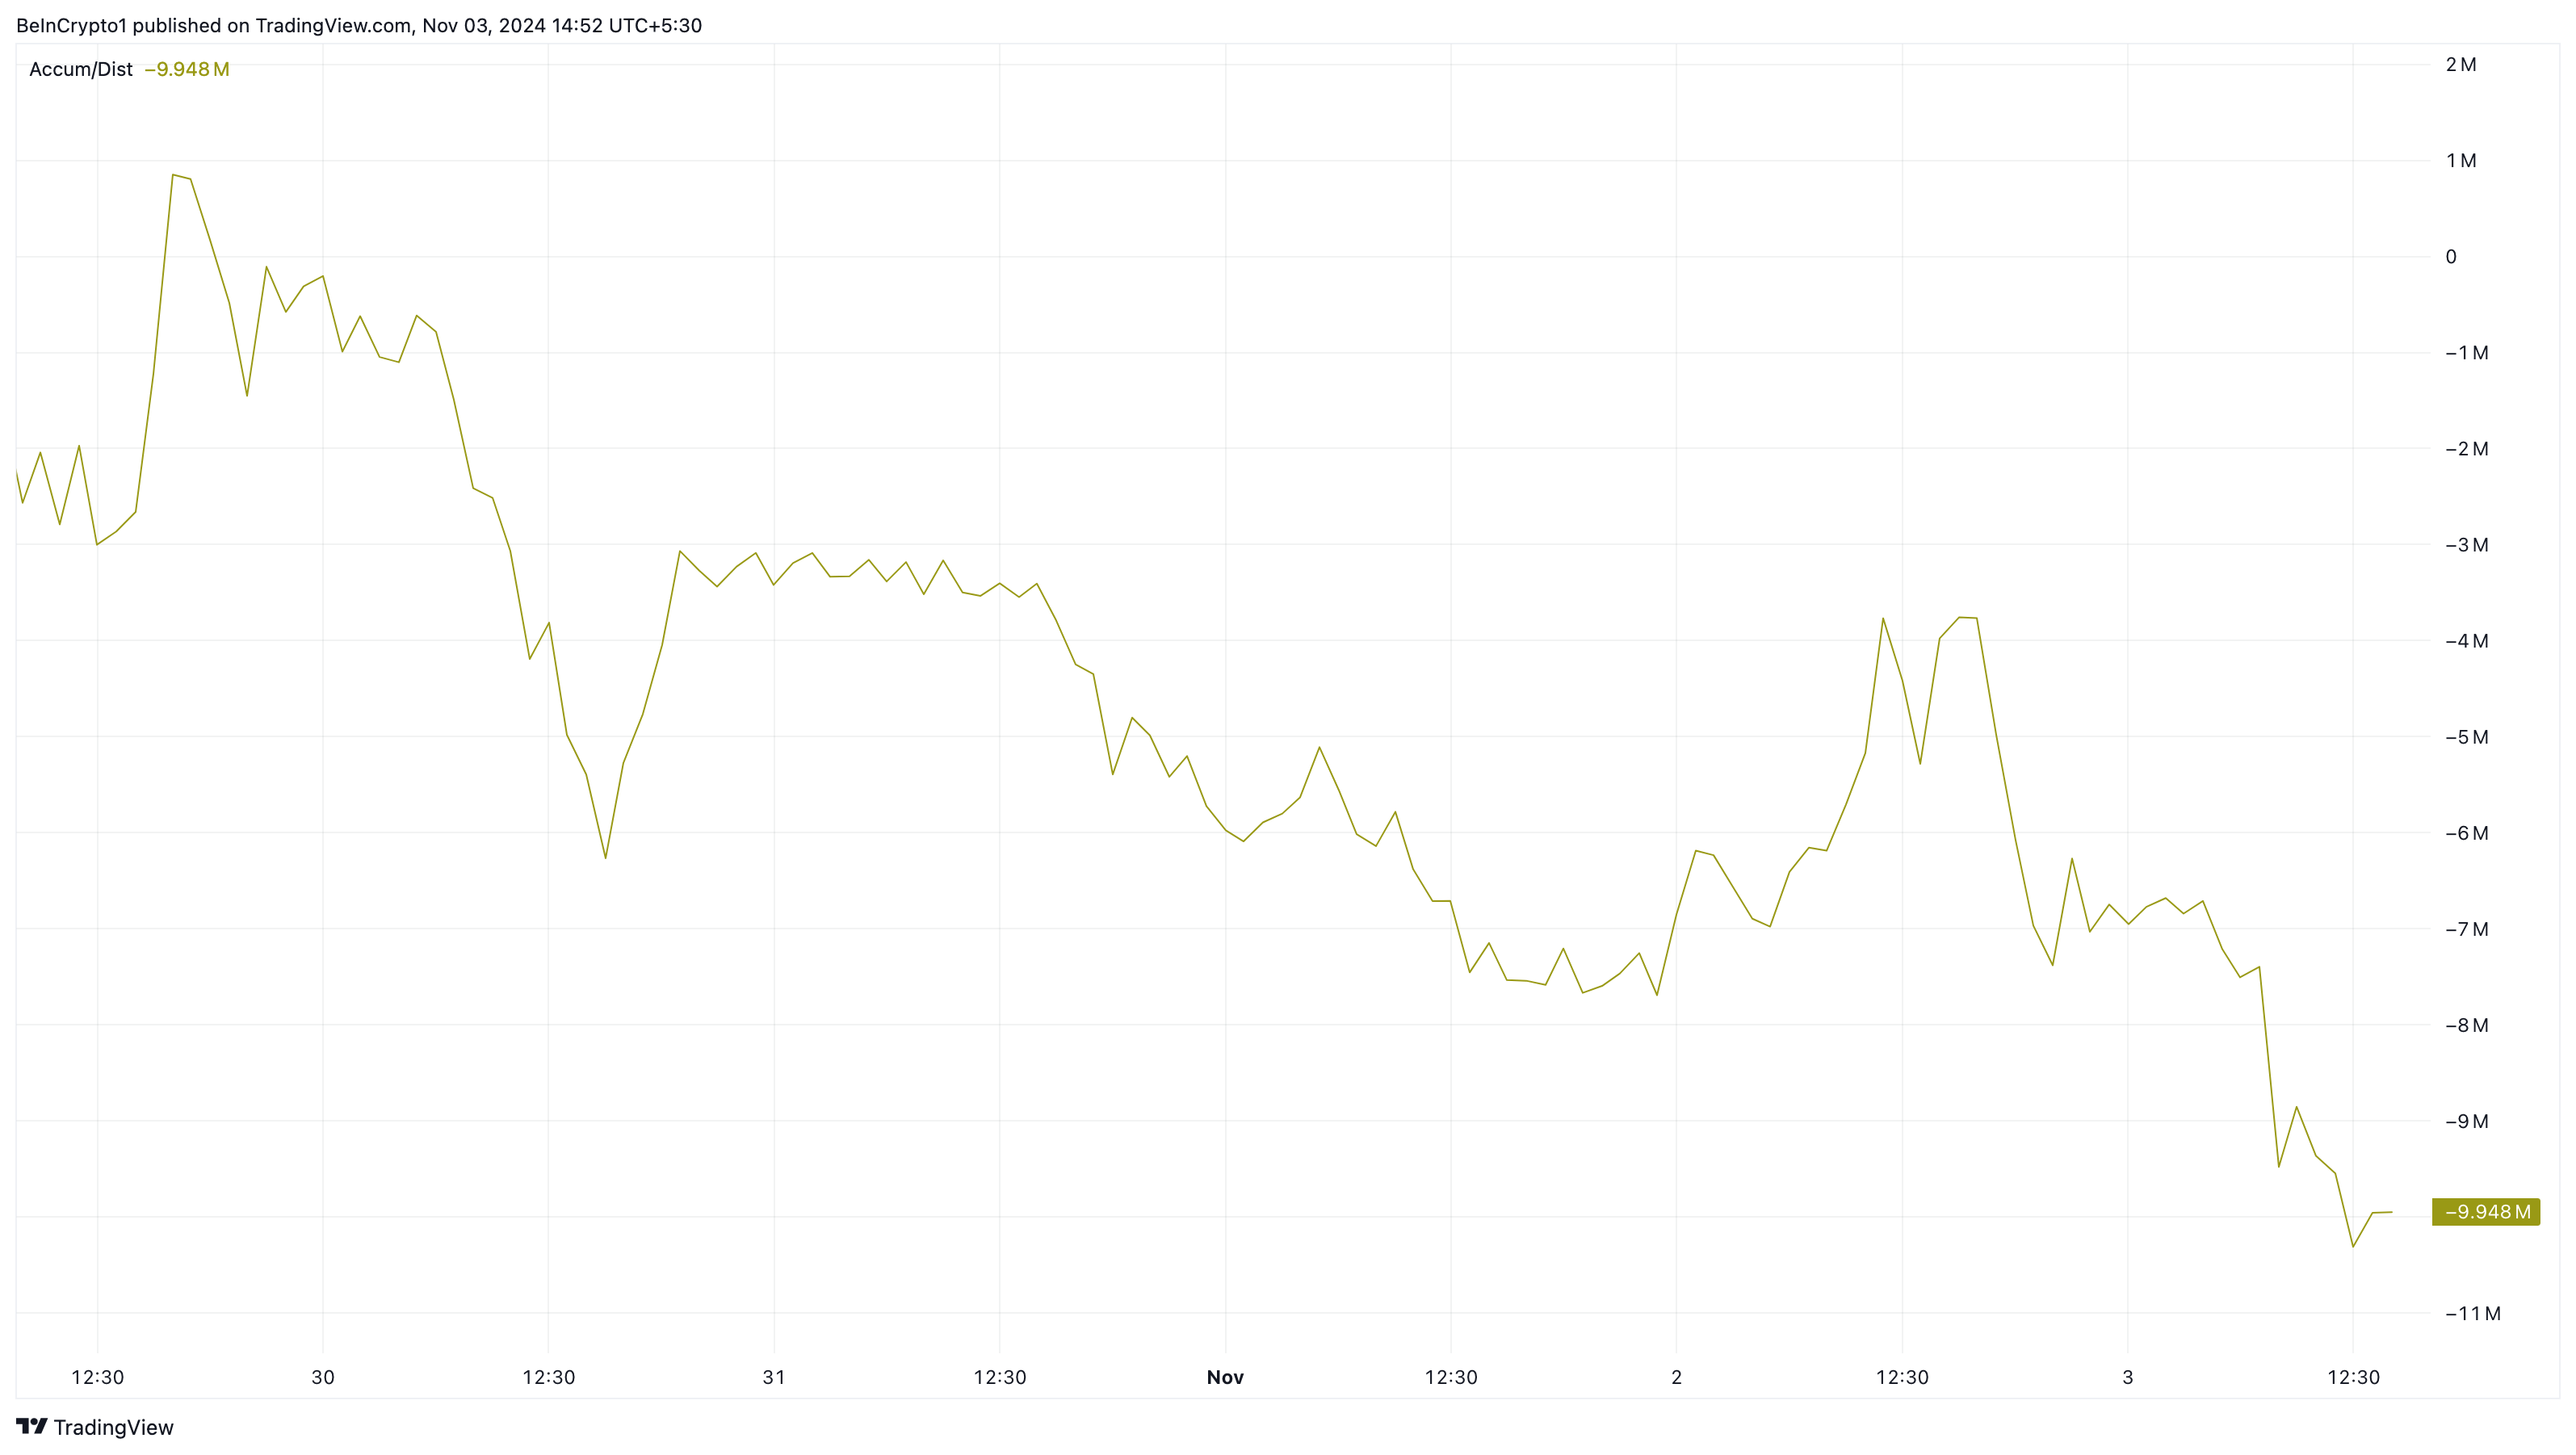 Grass Accumulation/Distribution. Source: TradingView
GRASS Price Prediction: Further Decrease Ahead
A further look at the 1-hour chart shows that GRASS crypto price has formed a double-top pattern. A double top is a chart pattern signaling a potential trend reversal. It’s identified by two peaks of similar height, separated by a moderate trough between them.
When this pattern appears, it means that a cryptocurrency has reached its local top. This appears to be the case with the GRASS price. Considering this outlook, there is a high chance that the token might decline to $1.08.
Read more: 10 Best Altcoin Exchanges In 2024
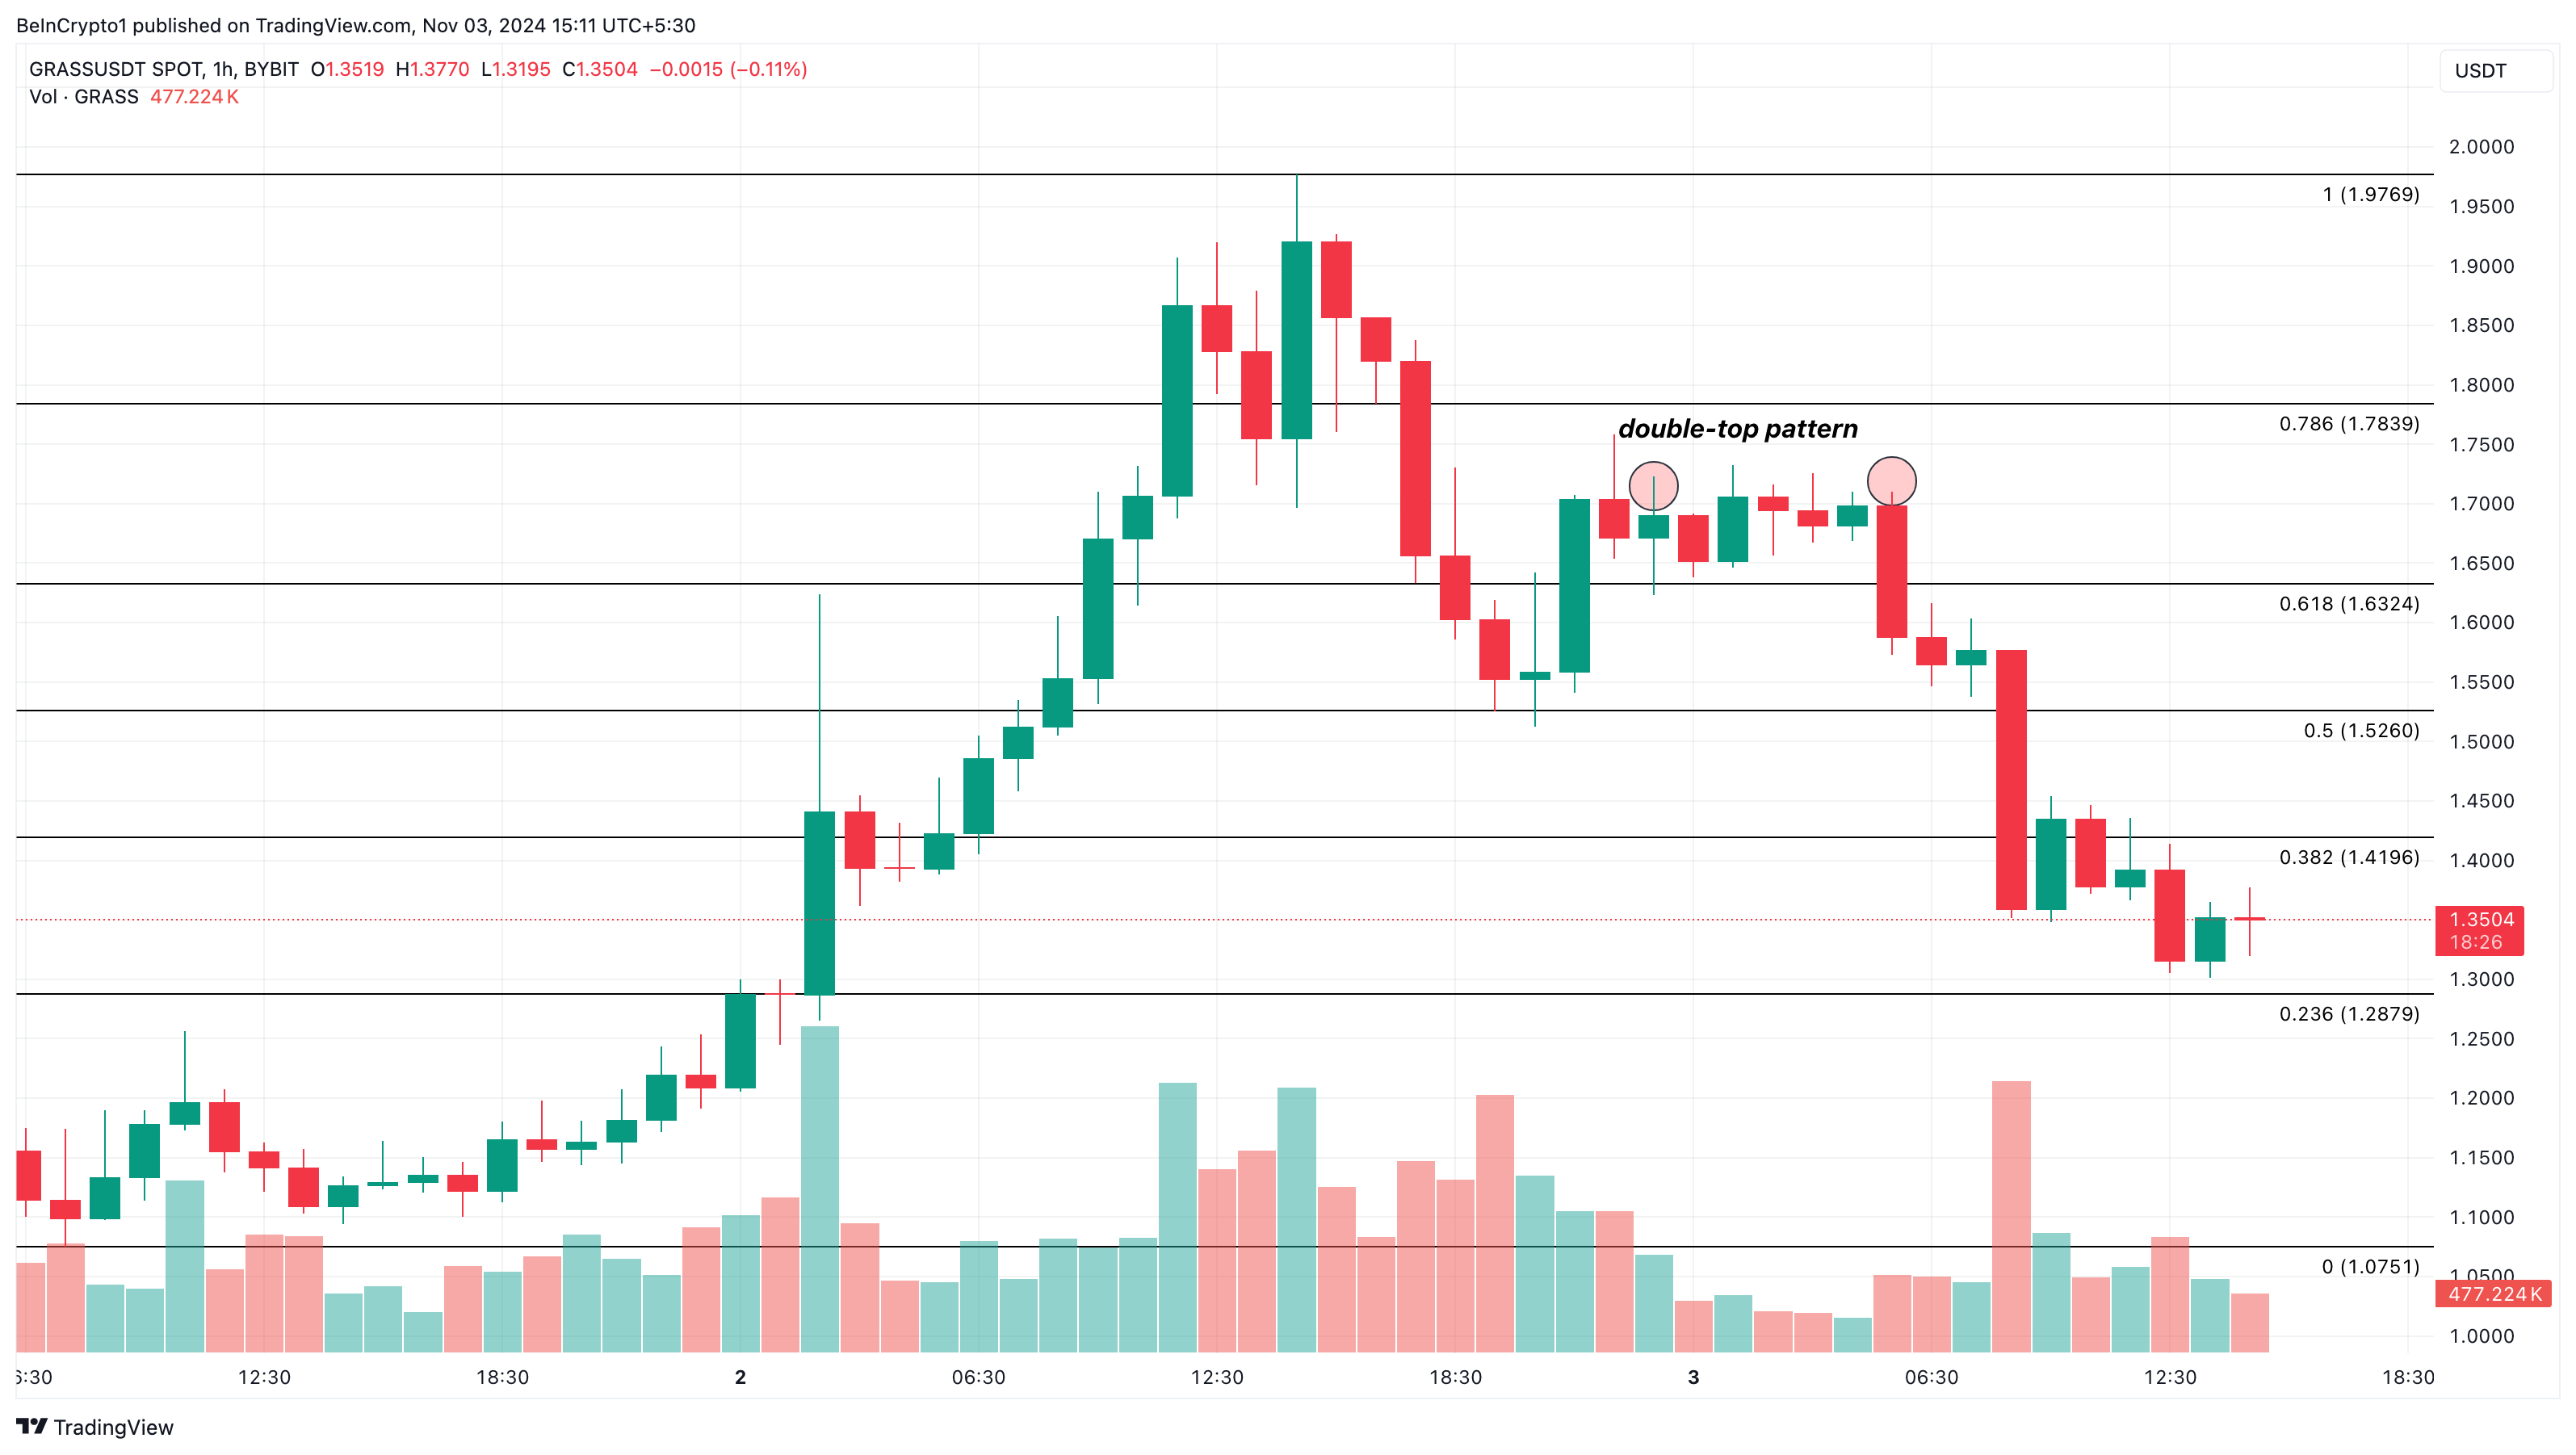 Grass 1-Hour Analysis. Source: TradingView
However, if bulls can defend the support at $1.29, this prediction might be invalidated. In that scenario, GRASS might rebound to $1.63.
Recommended Articles


