

What to Expect from Solana (SOL) in November 2024: Analysts Weigh In

Source Beincrypto

Solana (SOL) recorded an impressive double-digit gain in October, marking its first strong performance in several months. This rally has fueled bullish sentiment among analysts, many of whom predict that Solana’s price in November could bring further upward momentum for the altcoin.

But what should investors expect from Solana this month? In this analysis, BeInCrypto reveals some analysts’ targets and signs from crucial indicators.

Analyst Expectations Differ for Solana

At press time, Solana’s price stands at $166, marking a 22% surge over the past 30 days. Pseudonymous trader Crypto General notes that SOL’s outperformance of Bitcoin (BTC) hints at further gains for the altcoin this month.

“SOL is showing great strength from the past few weeks, defying the BTC dumps but pumping along with BTC pumping. No doubt it is one of my favourite coin for this season and I am targeting a minimum of $290 in the coming weeks,” Crypto General posted on X (formerly Twitter).

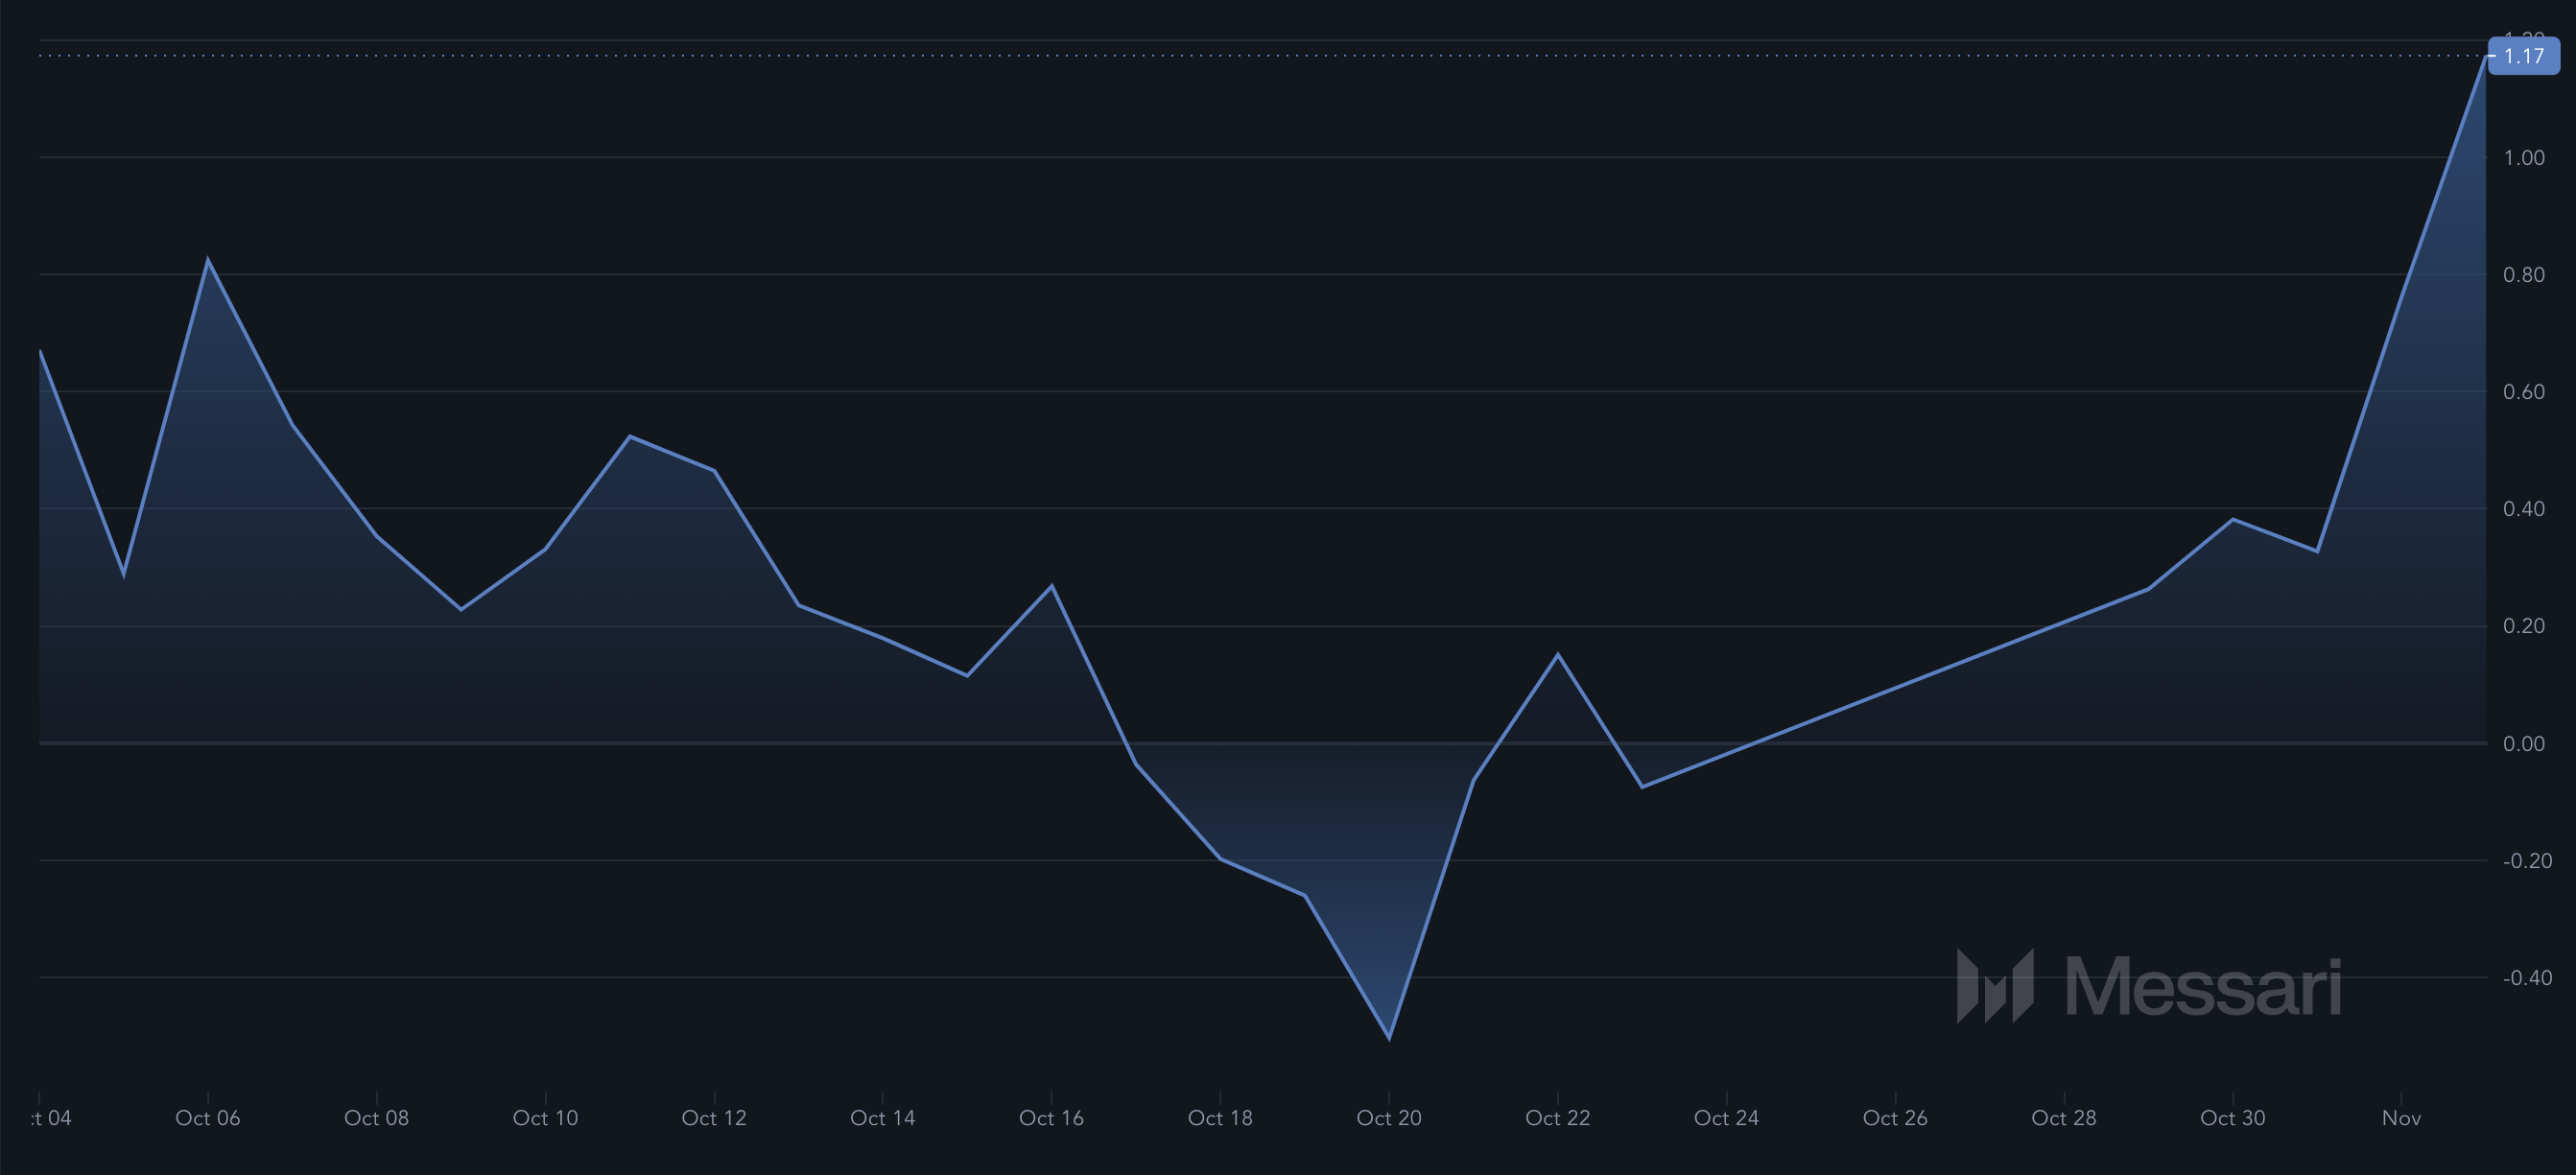
Additionally, the Sharpe ratio has surged into positive territory after remaining in the red from July to September. The Sharpe ratio measures returns by adjusting for risk, making it a popular tool for comparing asset performance.

A negative Sharpe ratio indicates that the potential return may not justify the risk. However, now that it’s positive, Solana’s price shows potential for further gains in November, supporting a bullish outlook.

Read more: 7 Best Platforms To Buy Solana (SOL) in 2024
Solana price in NovemberSolana Sharpe Ratio. Source: Messari

Contrary to Crypto General’s prediction, analyst Benjamin Cowen says SOL might not replicate its performance in October. In fact, the analyst says that the SOL/BTC pair, which was in favor of the altcoin, might drop this month.

“I think sol/btc will drop in Nov/dec and bounce early 2025,” Cowen opined.

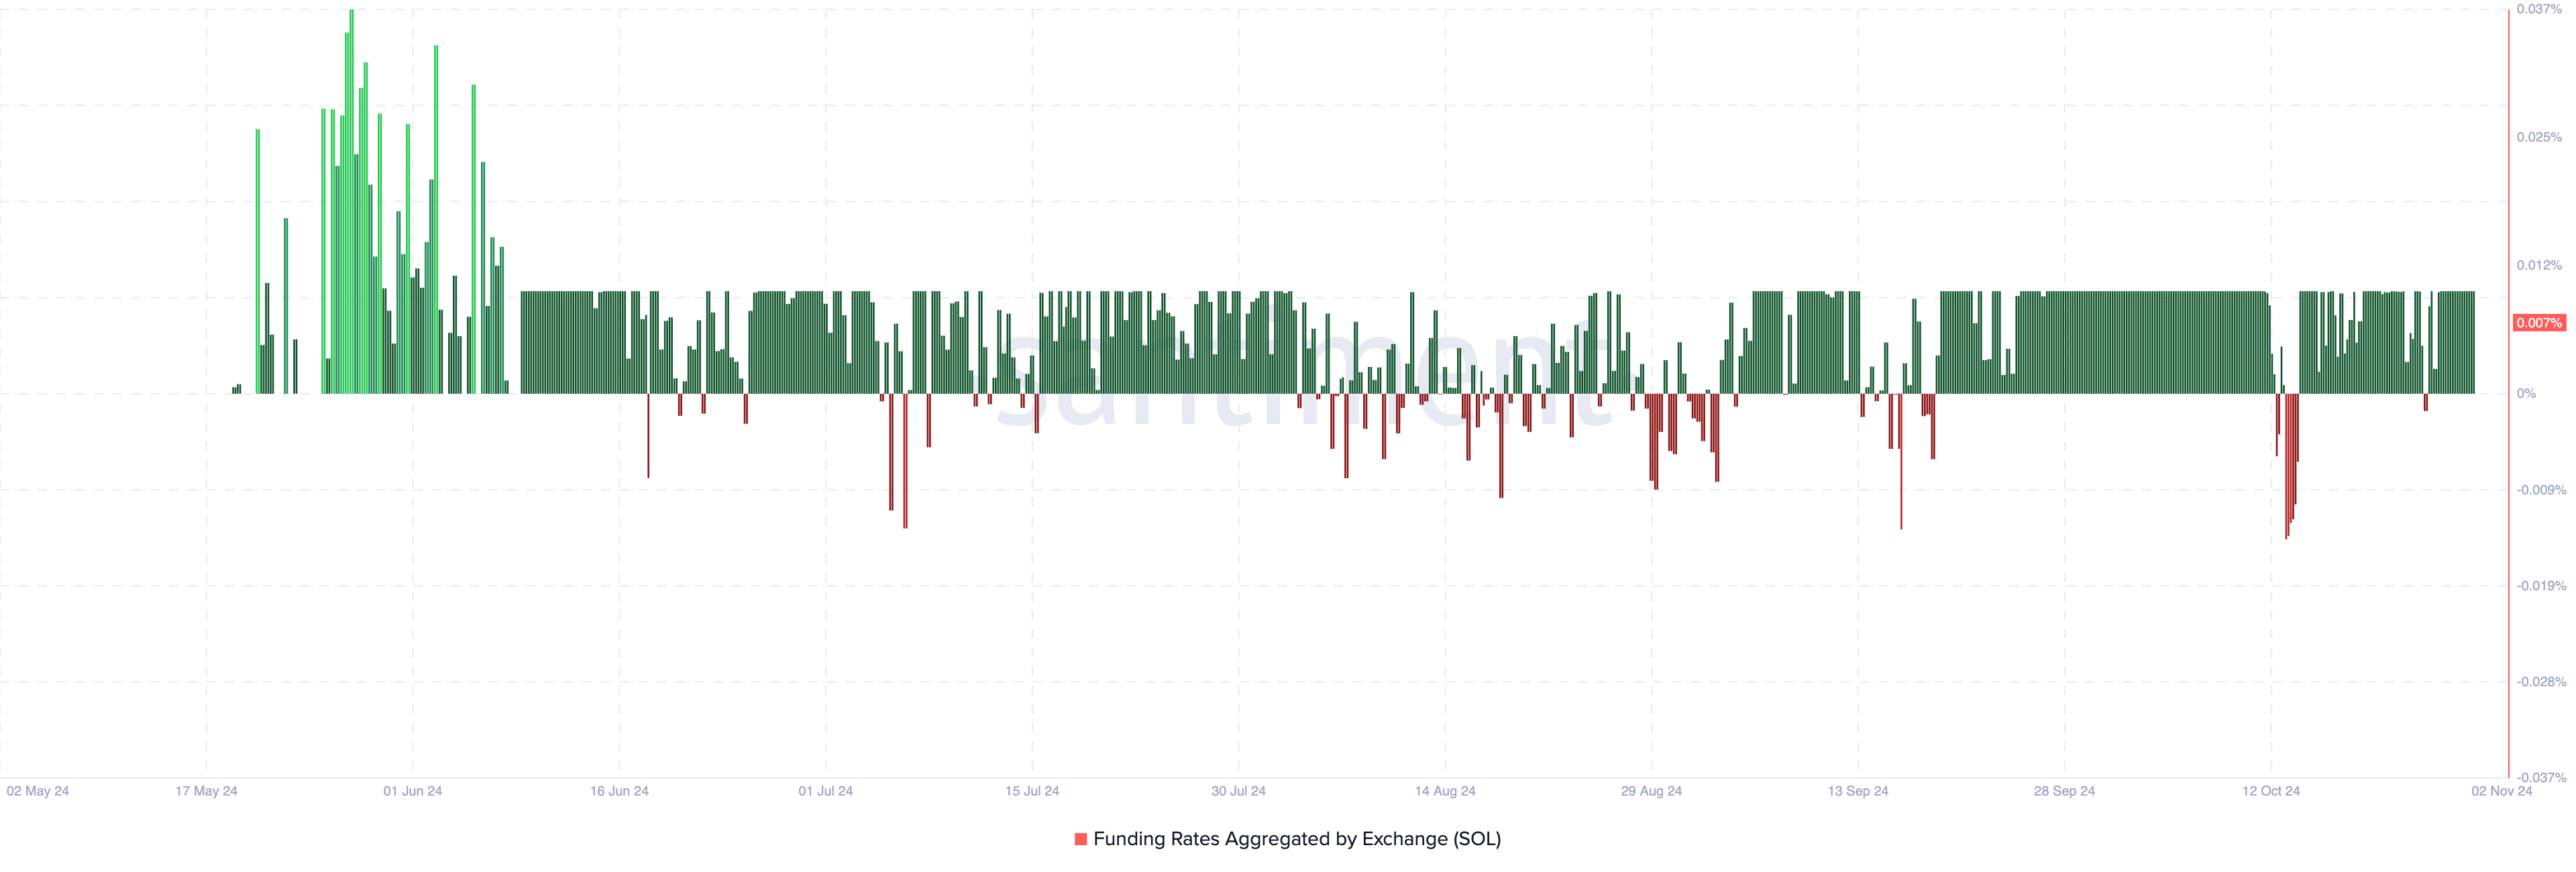
Meanwhile, Santiment shows a positive funding rate, indicating that there are more longs (buyers) than shorts. In contrast, a negative funding rate suggests that shorts dominate the market. Thus, the current reading reflects traders’ expectations for an increase in SOL’s price this November.
Solana bullish funding rateSolana Funding Rate. Source: Santiment

SOL Price Prediction: $209 Target Is Possible

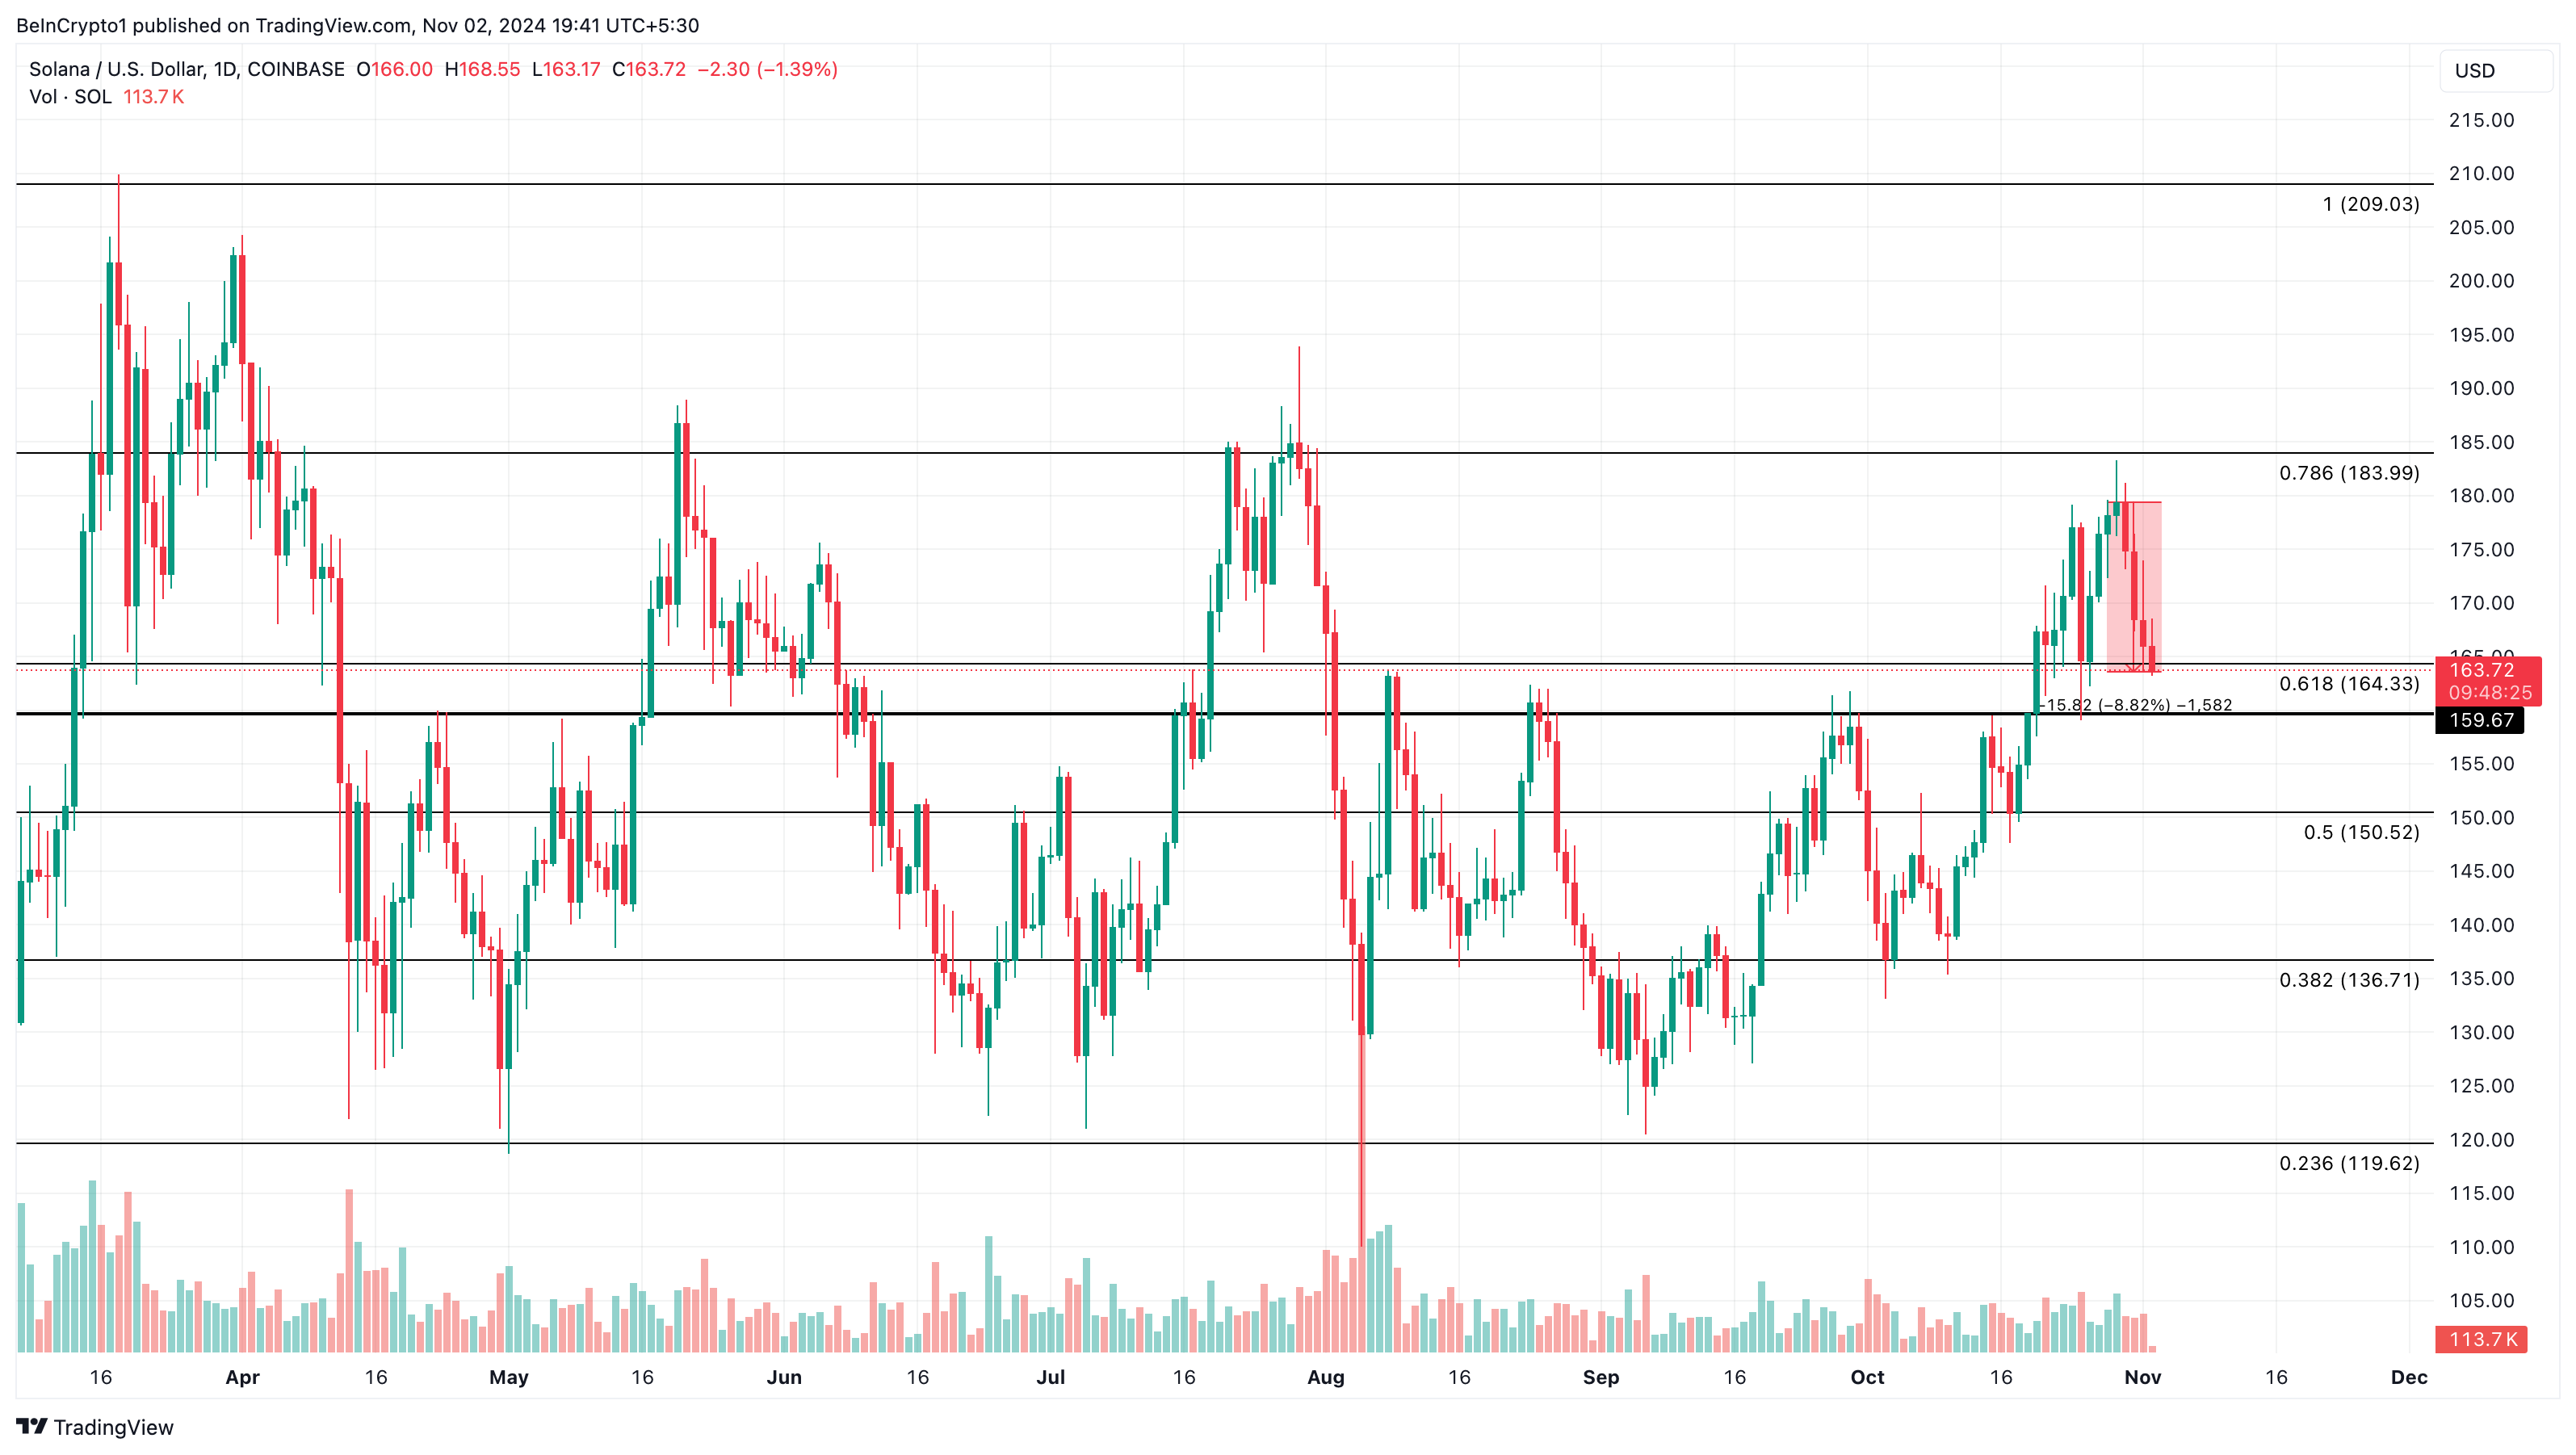
Since Wednesday, SOL’s price has fallen by 8.88%, now trading around $163.72. Despite this dip, the daily chart indicates that the token remains above key support at $159.67. Given this setup, Solana’s price may find a rebound off these lows, potentially rallying toward $209.30 by month’s end.

Read more: Solana (SOL) Price Prediction 2024/2025/2030
Solana price analysisSolana Daily Analysis. Source: TradingView

However, if bulls fail to hold this support, this outlook for November may be invalidated, and SOL could then slide further to around $136.71.

Disclaimer: For information purposes only. Past performance is not indicative of future results.
placeholder
US dollar clings to nine-week lows near 98.4 as Brent nears $100 and the yen hits a seven-month high — five events to watch todayThe dollar is pinned near nine-week lows even after a blockbuster jobs report, as an oil spike toward $100, a surging yen and China's reflation data crowd the driver's seat. Five key events to watch today: Brent at $99.46, USD/JPY at 154, China CPI/PPI, PBOC gold buying, and Thursday's PPI / Friday's CPI ahead of the September 15-16 FOMC.
Author  Eric Nkando
Sep 09, Wed
The dollar is pinned near nine-week lows even after a blockbuster jobs report, as an oil spike toward $100, a surging yen and China's reflation data crowd the driver's seat. Five key events to watch today: Brent at $99.46, USD/JPY at 154, China CPI/PPI, PBOC gold buying, and Thursday's PPI / Friday's CPI ahead of the September 15-16 FOMC.
placeholder
US August CPI lands tonight: after a 5.4% PPI shock, will the Fed hike on September 16?US August PPI came in at 5.4% year-on-year, above the 5.3% consensus, with core PPI at 4.6%. Traders have pushed the odds of a 25bp Fed hike on September 15-16 to around 70%. Tonight's CPI is the last major inflation print before the decision — here is the full calendar, the consensus numbers, and what a hot versus cool reading would mean for the dollar, yields, gold and stocks.
Author  Irene Q.
Sep 11, Fri
US August PPI came in at 5.4% year-on-year, above the 5.3% consensus, with core PPI at 4.6%. Traders have pushed the odds of a 25bp Fed hike on September 15-16 to around 70%. Tonight's CPI is the last major inflation print before the decision — here is the full calendar, the consensus numbers, and what a hot versus cool reading would mean for the dollar, yields, gold and stocks.
placeholder
Brent tests $108 as a key export pipeline stays shut — can the rally clear $110?Brent crude rose 2.55% to $106.97 and WTI 2.32% to $102.30 as a major regional export pipeline remained offline with no restart timeline. Front-month backwardation has widened to $5.53 from $3.84 a week ago, European gas is at its highest since December 2022, and one analyst sees $119.48 if talks stall.
Author  Irene Q.
18 hours ago
Brent crude rose 2.55% to $106.97 and WTI 2.32% to $102.30 as a major regional export pipeline remained offline with no restart timeline. Front-month backwardation has widened to $5.53 from $3.84 a week ago, European gas is at its highest since December 2022, and one analyst sees $119.48 if talks stall.
placeholder
Fed hike odds near 90% into Wednesday's decision — how to trade the dollar, gold and the S&P 500A 0.3% monthly core CPI print has lifted the market-implied probability of a 25bp Fed hike on 16 September to roughly 86.5% ~ 90%, which would be the first increase since July 2023. Here is the decision timeline, the pricing versus the forecasts, both scenarios, and the key levels for the dollar, gold and the S&P 500.
Author  Suzie
18 hours ago
A 0.3% monthly core CPI print has lifted the market-implied probability of a 25bp Fed hike on 16 September to roughly 86.5% ~ 90%, which would be the first increase since July 2023. Here is the decision timeline, the pricing versus the forecasts, both scenarios, and the key levels for the dollar, gold and the S&P 500.
placeholder
Silver Price Forecast: XAG/USD falls to near $63.50 amid Fed hike bets, higher oil pricesSilver price (XAG/USD) loses its gains from the previous day, trading around $63.50 per troy ounce during Asian hours on Monday. Non-yielding Silver is currently facing significant headwinds driven by rising Federal Reserve (Fed) rate-hike expectations for the upcoming September decision.
Author  FXStreet
15 hours ago
Silver price (XAG/USD) loses its gains from the previous day, trading around $63.50 per troy ounce during Asian hours on Monday. Non-yielding Silver is currently facing significant headwinds driven by rising Federal Reserve (Fed) rate-hike expectations for the upcoming September decision.
goTop
quote