

Ripple price breaks technical structure after executive’s personal XRP accounts were compromised
- Ripple price has broken below the monthly triangle as February kicks off.
- XRP still has an opportunity to define its next directional bias.
- A break and close below $0.3303 on the monthly time frame would solidify the downtrend.
Ripple (XRP) price is broadly bearish on lower time frames, but the higher ones show the bulls still have a chance to recover. Specifically, a triangle governs the monthly time frame and could define the next directional bias as it fills out soon.
Also Read: Ripple price coils up for a dump as network offloads massive XRP reserve
Bitcoin, altcoins, stablecoins FAQs
What is Bitcoin?
Bitcoin is the largest cryptocurrency by market capitalization, a virtual currency designed to serve as money. This form of payment cannot be controlled by any one person, group, or entity, which eliminates the need for third-party participation during financial transactions.
What are altcoins?
Altcoins are any cryptocurrency apart from Bitcoin, but some also regard Ethereum as a non-altcoin because it is from these two cryptocurrencies that forking happens. If this is true, then Litecoin is the first altcoin, forked from the Bitcoin protocol and, therefore, an “improved” version of it.
What are stablecoins?
Stablecoins are cryptocurrencies designed to have a stable price, with their value backed by a reserve of the asset it represents. To achieve this, the value of any one stablecoin is pegged to a commodity or financial instrument, such as the US Dollar (USD), with its supply regulated by an algorithm or demand. The main goal of stablecoins is to provide an on/off-ramp for investors willing to trade and invest in cryptocurrencies. Stablecoins also allow investors to store value since cryptocurrencies, in general, are subject to volatility.
What is Bitcoin Dominance?
Bitcoin dominance is the ratio of Bitcoin's market capitalization to the total market capitalization of all cryptocurrencies combined. It provides a clear picture of Bitcoin’s interest among investors. A high BTC dominance typically happens before and during a bull run, in which investors resort to investing in relatively stable and high market capitalization cryptocurrency like Bitcoin. A drop in BTC dominance usually means that investors are moving their capital and/or profits to altcoins in a quest for higher returns, which usually triggers an explosion of altcoin rallies.
Ripple executives on recent XRP accounts hack
Ripple co-founder and chair Chris Larsen, together with CEO Brad Garlinghouse, came forward on Wednesday to provide clarity after misinformation that the company’s accounts were compromised. Per their update, it was in fact Larsen’s personal XRP accounts that were compromised, with the bad actor stealing $112.5 million worth of XRP that were then frozen on multiple exchanges.
Ripple price outlook as XRP starts February below a neutral technical structure
Ripple price faced a rejection from the 50-day Simple Moving Average (SMA) at $0.5413, causing XRP to lose the support offered by the lower trendline of a triangle chart pattern. With the Parabolic Stop and Reverse (SAR) trailing XRP price from below at $0.4000, Ripple price could find a turnaround soon.
Meanwhile, the odds still favor the downside as both the Awesome Oscillator (AO) and the Moving Average Convergence Divergence (MACD) indicators are in negative territory. The RSI is also below its mean line of 50.
An extended fall could see Ripple price test the $0.3303 support, or in a dire case, extend the fall to the $0.1731 support floor.
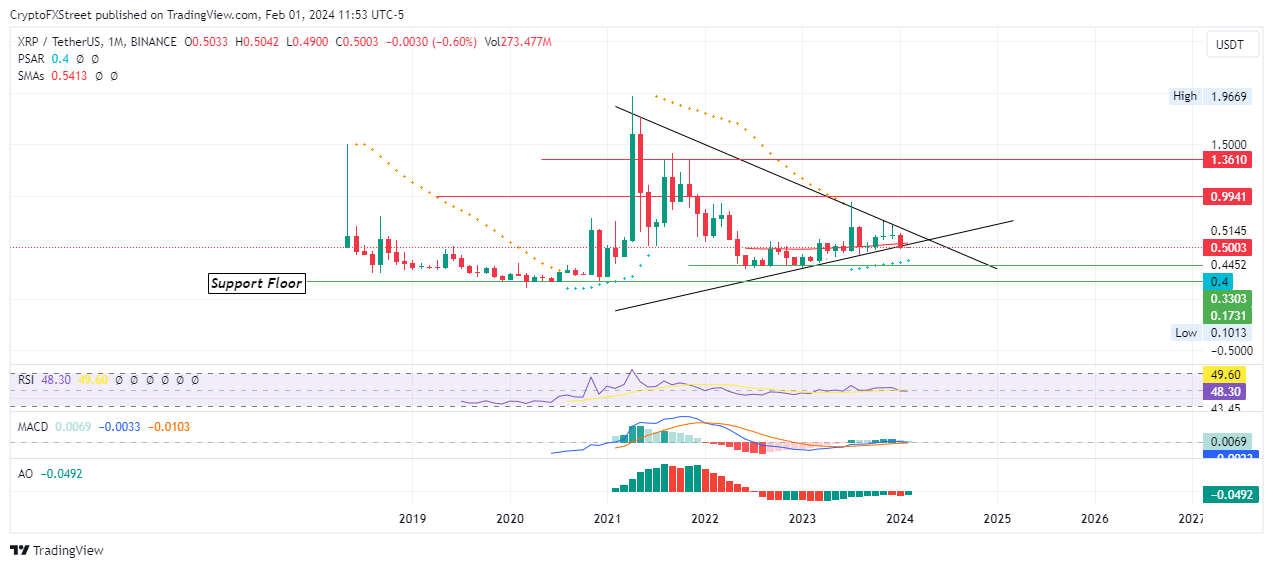
XRP/USDT 1-month chart
Conversely, with this bearish outlook, the XRP market could cull out the faint-hearted, akin to what happened in 2018. While other projects were going up, Ripple price remained stale before a bold move north, taking off to record an intra-day high of $0.8000 on September 21.
In the meantime, XRP price still has the opportunity to define its next directional bias on the monthly time frame. A break and close below $0.3303 would solidify the downtrend, while a breach of the $0.9941 barrier would confirm a move north.
Recommended Articles


