


Solana Price Forecast: Extra 10% gains possible as Solana network beats Ethereum in weekly DEX volume
Solana price today: $178
- Solana posts a third consecutive day of gains on Monday, with prices less than 10% away from its July peak at $193.98.
- The volume in Solana’s decentralized exchanges nearly doubled that of Ethereum last week.
- Solana could extend gains to retest its July peak, technical indicators suggest.
Solana (SOL) recovered from Friday’s intraday decline to near $160 over the weekend and trades at $178.04 at the time of writing on Monday. The native token of the Solana blockchain eyes further gains as on-chain metrics and technical charts support a bullish thesis.
Solana is considered the largest competitor for Ethereum, and with decentralized exchanges (DEX) weekly volume nearly double that of Ether, SOL is likely primed for further gains.
Higher DEX volume is typically representative of higher demand for the chain and its relevance among market participants.
Solana beats competitor, dominates weekly DEX volume
Solana’s on-chain metrics, such as new addresses, active addresses, and transactions on the SOL chain, noted an increase in the third quarter, according to TheBlockData. When compared to Ethereum, the weekly DEX volume metric, which measures the transaction volume across all decentralized exchanges in the Solana ecosystem, it was evident that Solana leads.
Solana’s weekly DEX volume is $15.733 billion, against Ethereum’s $8.849 billion, according to DeFiLlama data. This marks a significant milestone for Solana since it is the first time that SOL leads Ether in DEX trading volume by a large margin (77.79%).
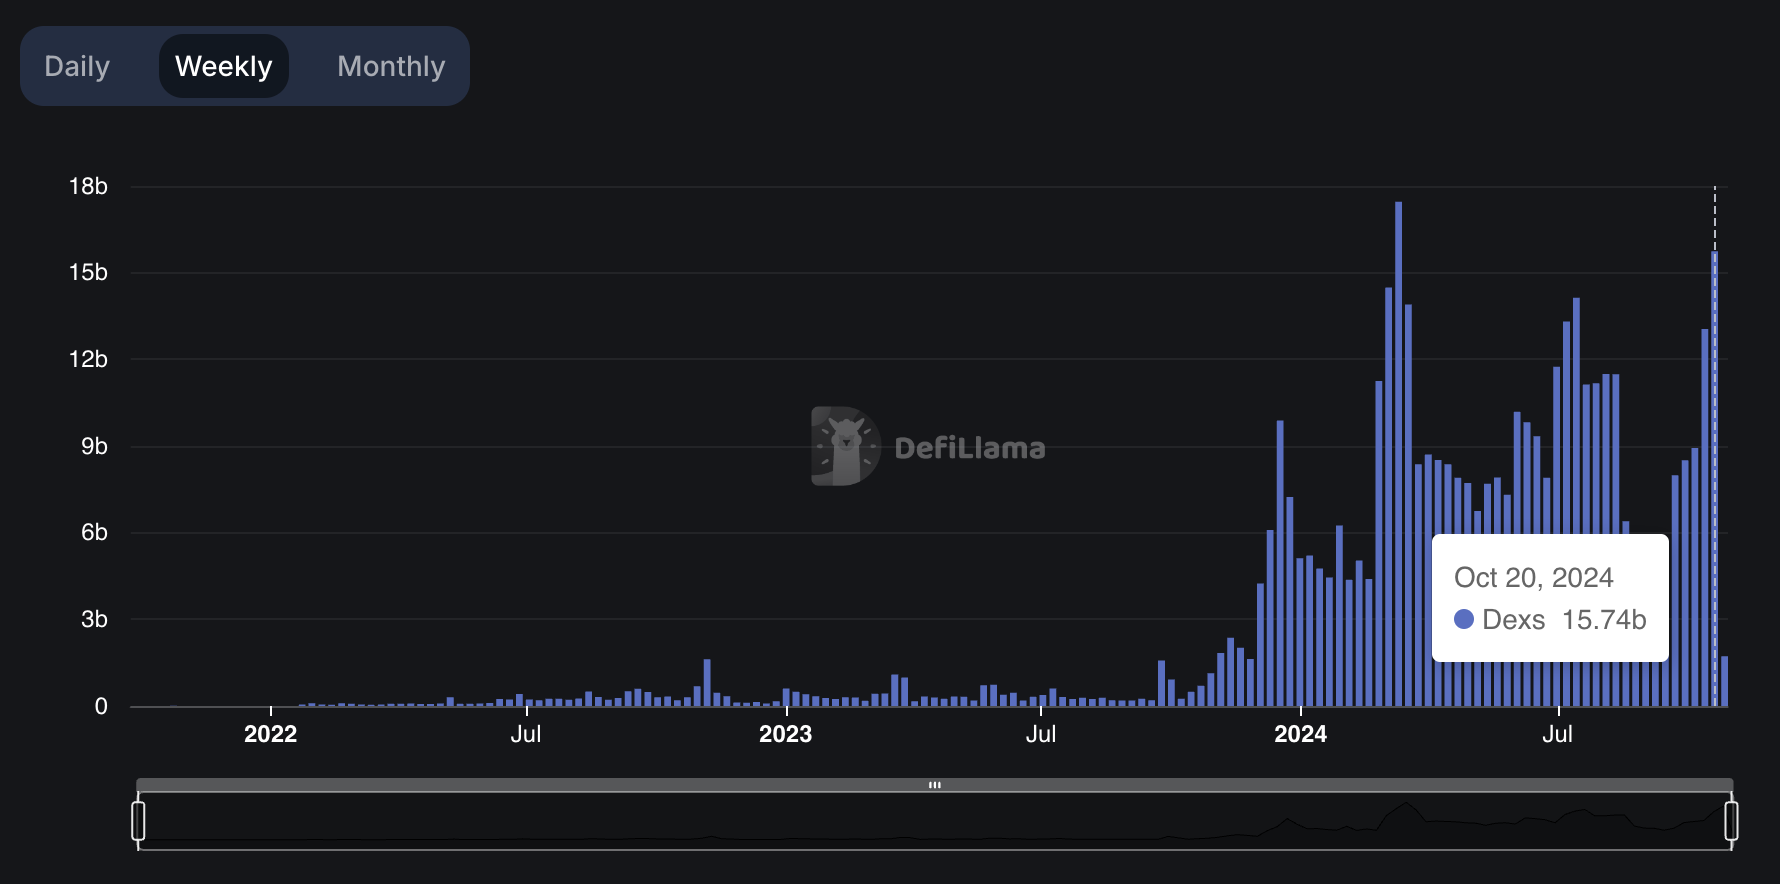
Solana’s weekly DEX volume on DeFiLlama
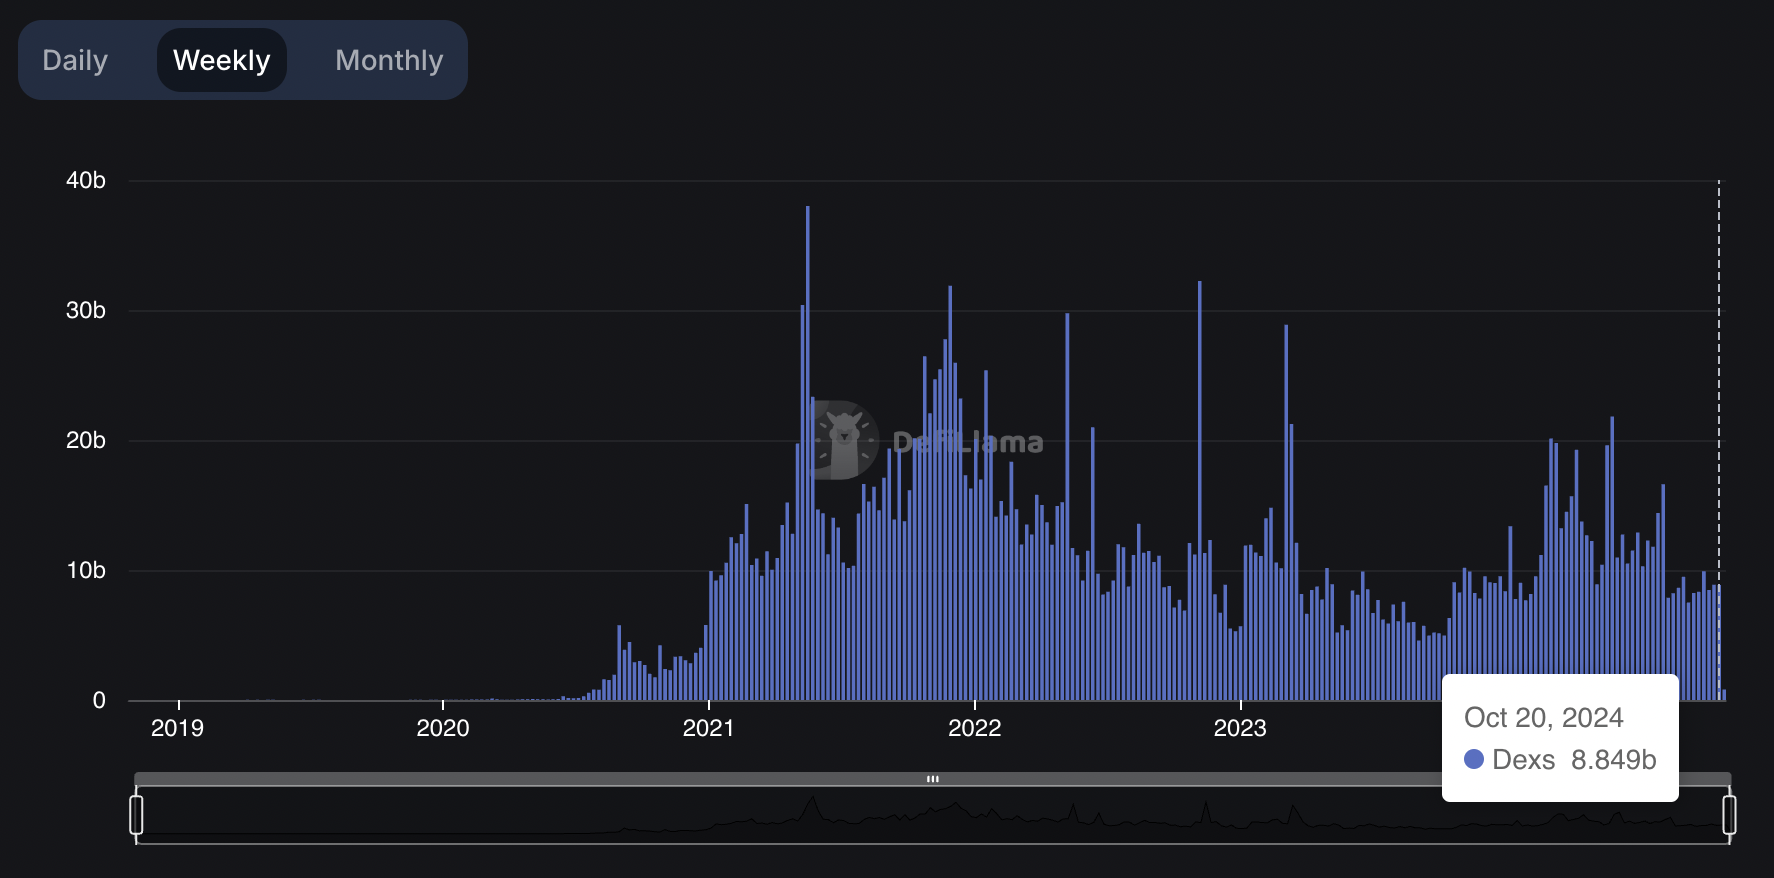
Ethereum’s weekly DEX volume on DeFiLlama
In the last 24 hours, Solana’s DEX volume stands at $1.739 billion, and for Ether, the metric lags behind at $836.79 billion.
Solana Price Forecast: SOL eyes nearly 10% gains
Solana could make a comeback to its July peak of $193.98, and test its resistance, if the altcoin extends its gains. On Friday, Solana slipped under $160, a key psychological support level for the altcoin. Since then, SOL has recovered and climbed to $178.04 at the time of writing.
The Relative Strength Index (RSI) indicator reads 66.42, still under the “overbought” level at 70, and shows there is room for further gain in Solana’s price. The Moving Average Convergence Divergence (MACD) indicator shows green histogram bars above the neutral line, signaling underlying positive momentum in SOL price.
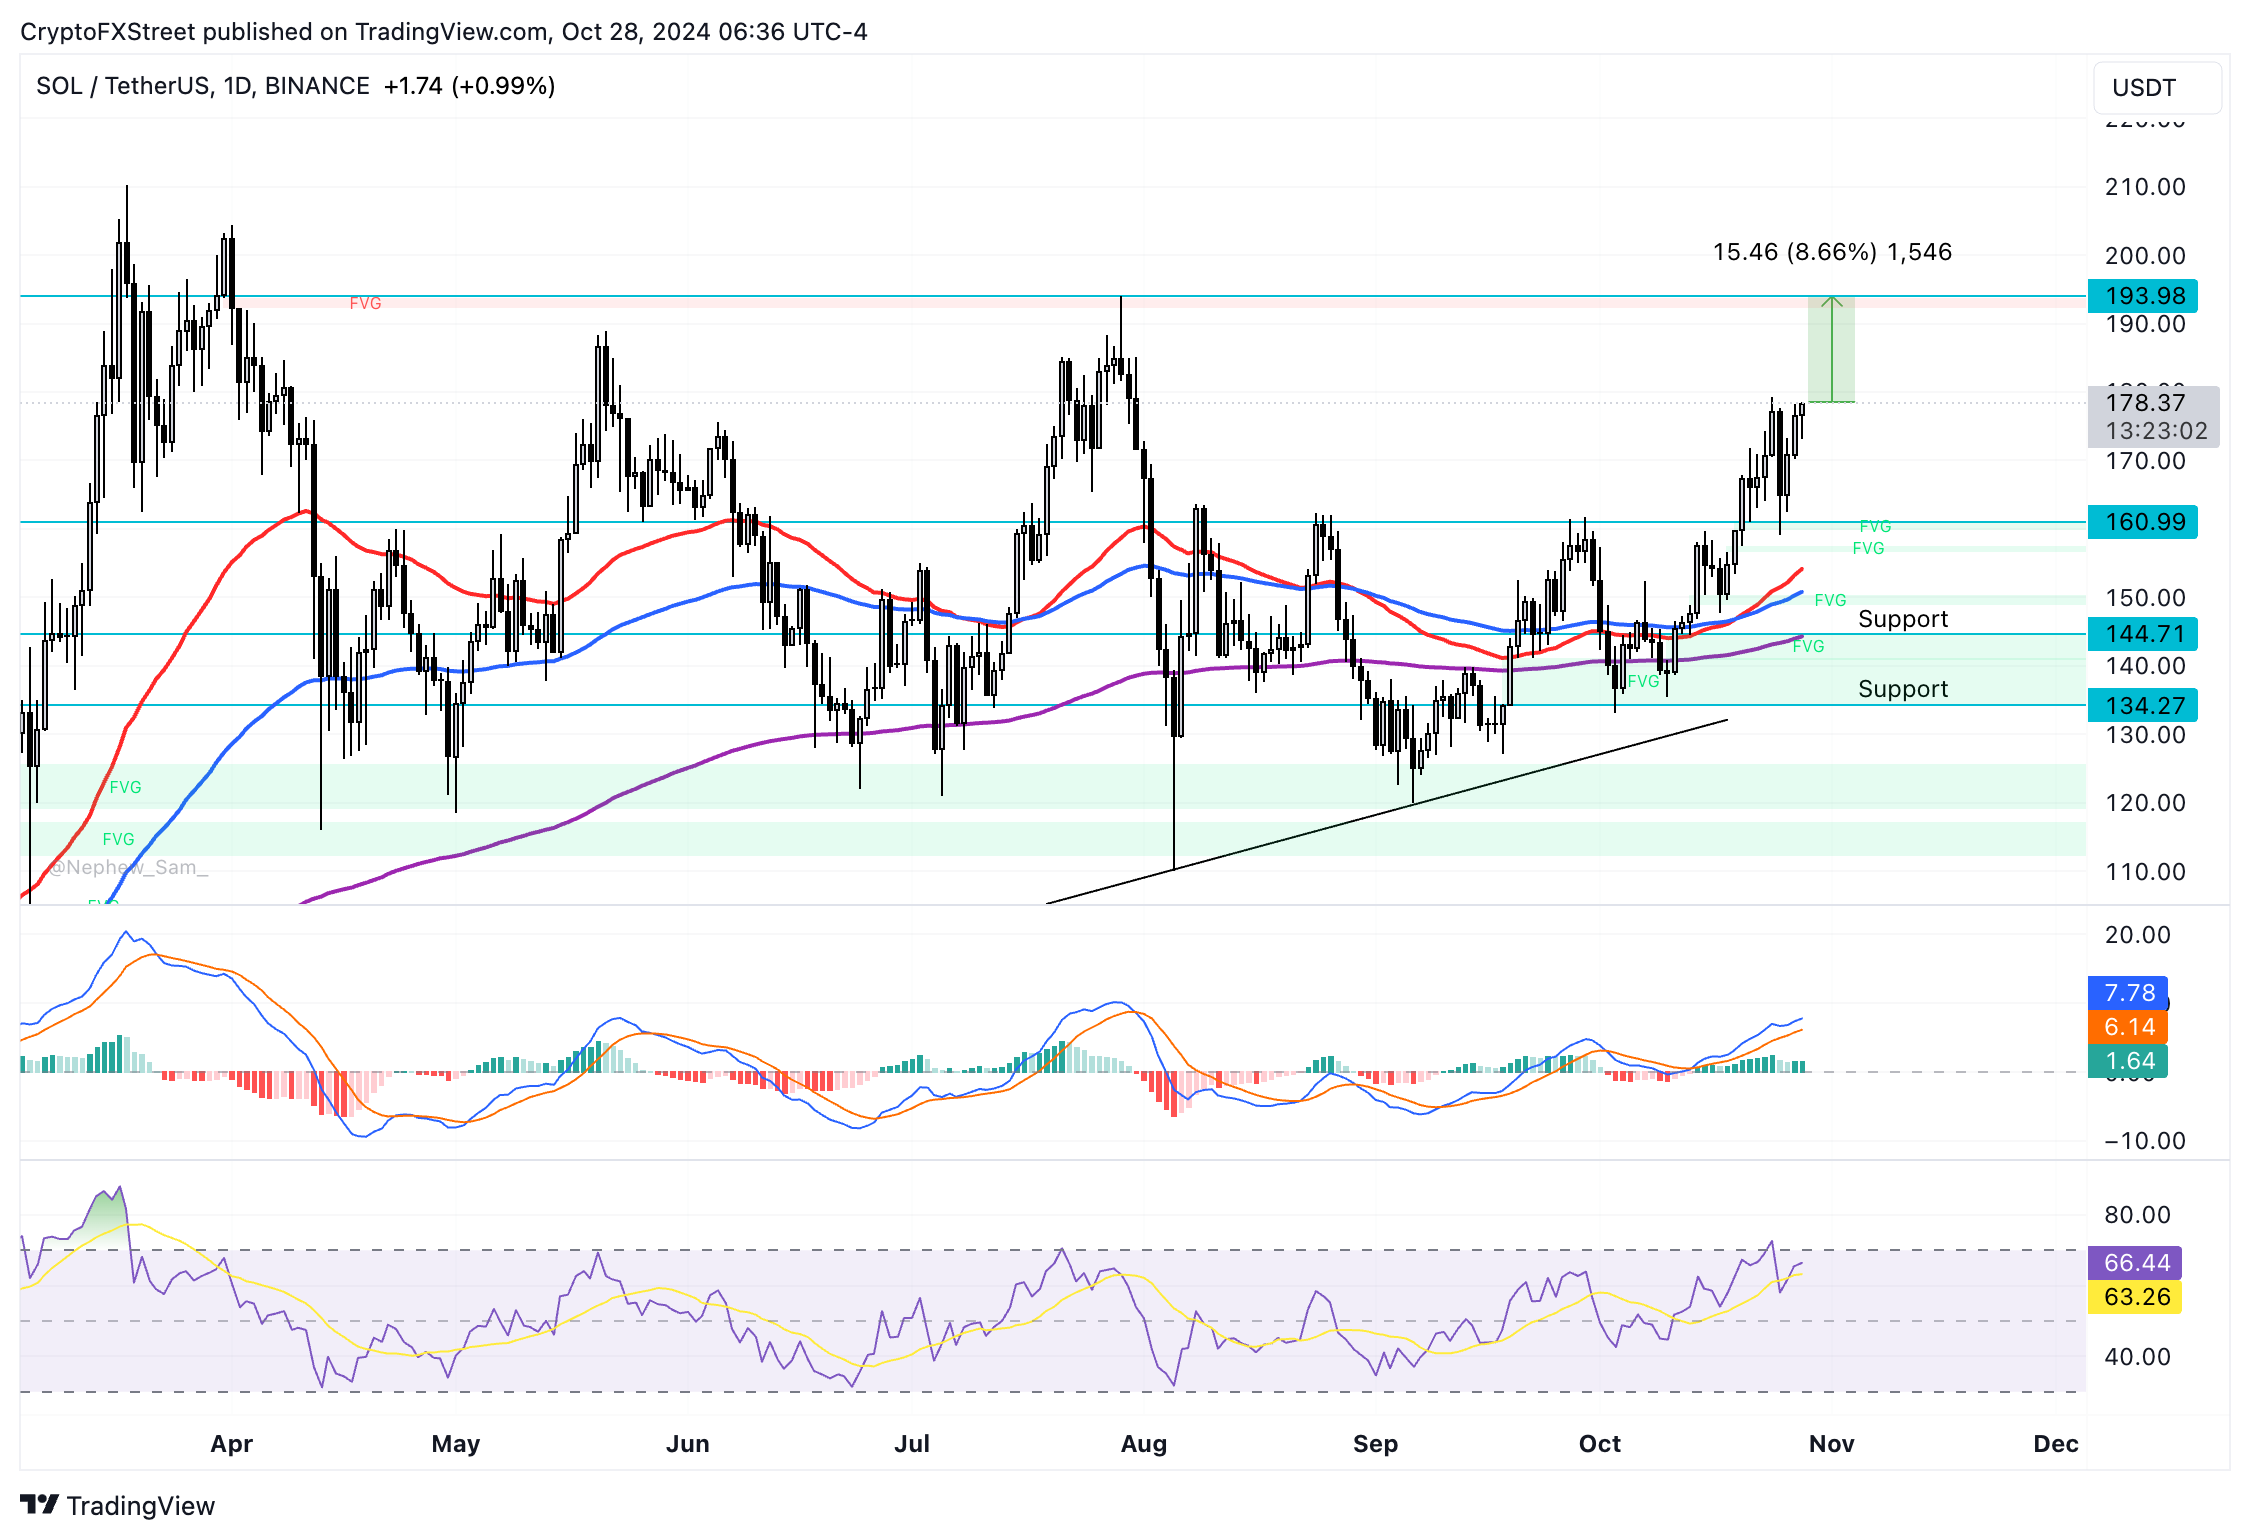
SOL/USDT daily chart
Looking down, Solana could find support at the upper boundary of the Fair Value Gap (FVG) at $160.99, as seen on the daily chart. Another key support level is the 10-day Exponential Moving Average (EMA) at $154.16.
Bitcoin, altcoins, stablecoins FAQs
Bitcoin is the largest cryptocurrency by market capitalization, a virtual currency designed to serve as money. This form of payment cannot be controlled by any one person, group, or entity, which eliminates the need for third-party participation during financial transactions.
Altcoins are any cryptocurrency apart from Bitcoin, but some also regard Ethereum as a non-altcoin because it is from these two cryptocurrencies that forking happens. If this is true, then Litecoin is the first altcoin, forked from the Bitcoin protocol and, therefore, an “improved” version of it.
Stablecoins are cryptocurrencies designed to have a stable price, with their value backed by a reserve of the asset it represents. To achieve this, the value of any one stablecoin is pegged to a commodity or financial instrument, such as the US Dollar (USD), with its supply regulated by an algorithm or demand. The main goal of stablecoins is to provide an on/off-ramp for investors willing to trade and invest in cryptocurrencies. Stablecoins also allow investors to store value since cryptocurrencies, in general, are subject to volatility.
Bitcoin dominance is the ratio of Bitcoin's market capitalization to the total market capitalization of all cryptocurrencies combined. It provides a clear picture of Bitcoin’s interest among investors. A high BTC dominance typically happens before and during a bull run, in which investors resort to investing in relatively stable and high market capitalization cryptocurrency like Bitcoin. A drop in BTC dominance usually means that investors are moving their capital and/or profits to altcoins in a quest for higher returns, which usually triggers an explosion of altcoin rallies.
Recommended Articles


