

Ethereum Recovered on the Charts, But The Data Underneath Tells a Different Story
Ethereum has posted a modest price recovery, but the move lacks the foundational strength needed to sustain it. Market conditions continue to show deterioration rather than improvement, particularly from the investor side.
The risk of a correction looms large as underlying sentiment fails to align with the surface-level price appreciation currently visible on ETH’s charts.
Ethereum Holders Are Losing Confidence
Despite Ethereum’s recent price uptick, the realized profit/loss data tells a sobering story. Over the past two months, ETH holders have experienced just one day of realized profits, which quickly reverted to losses. This near-total absence of profitable exits reflects a holder base that is overwhelmingly underwater on their positions.
Investors selling at a loss are exhibiting classic panic behavior rather than strategic repositioning. This persistent loss realization creates a negative feedback loop where selling pressure remains elevated regardless of short-term price gains. The bearish sentiment generated by two months of sustained losses will continue weighing on Ethereum’s recovery trajectory until holders meaningfully return to profitability.
Want more token insights like this? Sign up for Editor Harsh Notariya’s Daily Crypto Newsletter here.
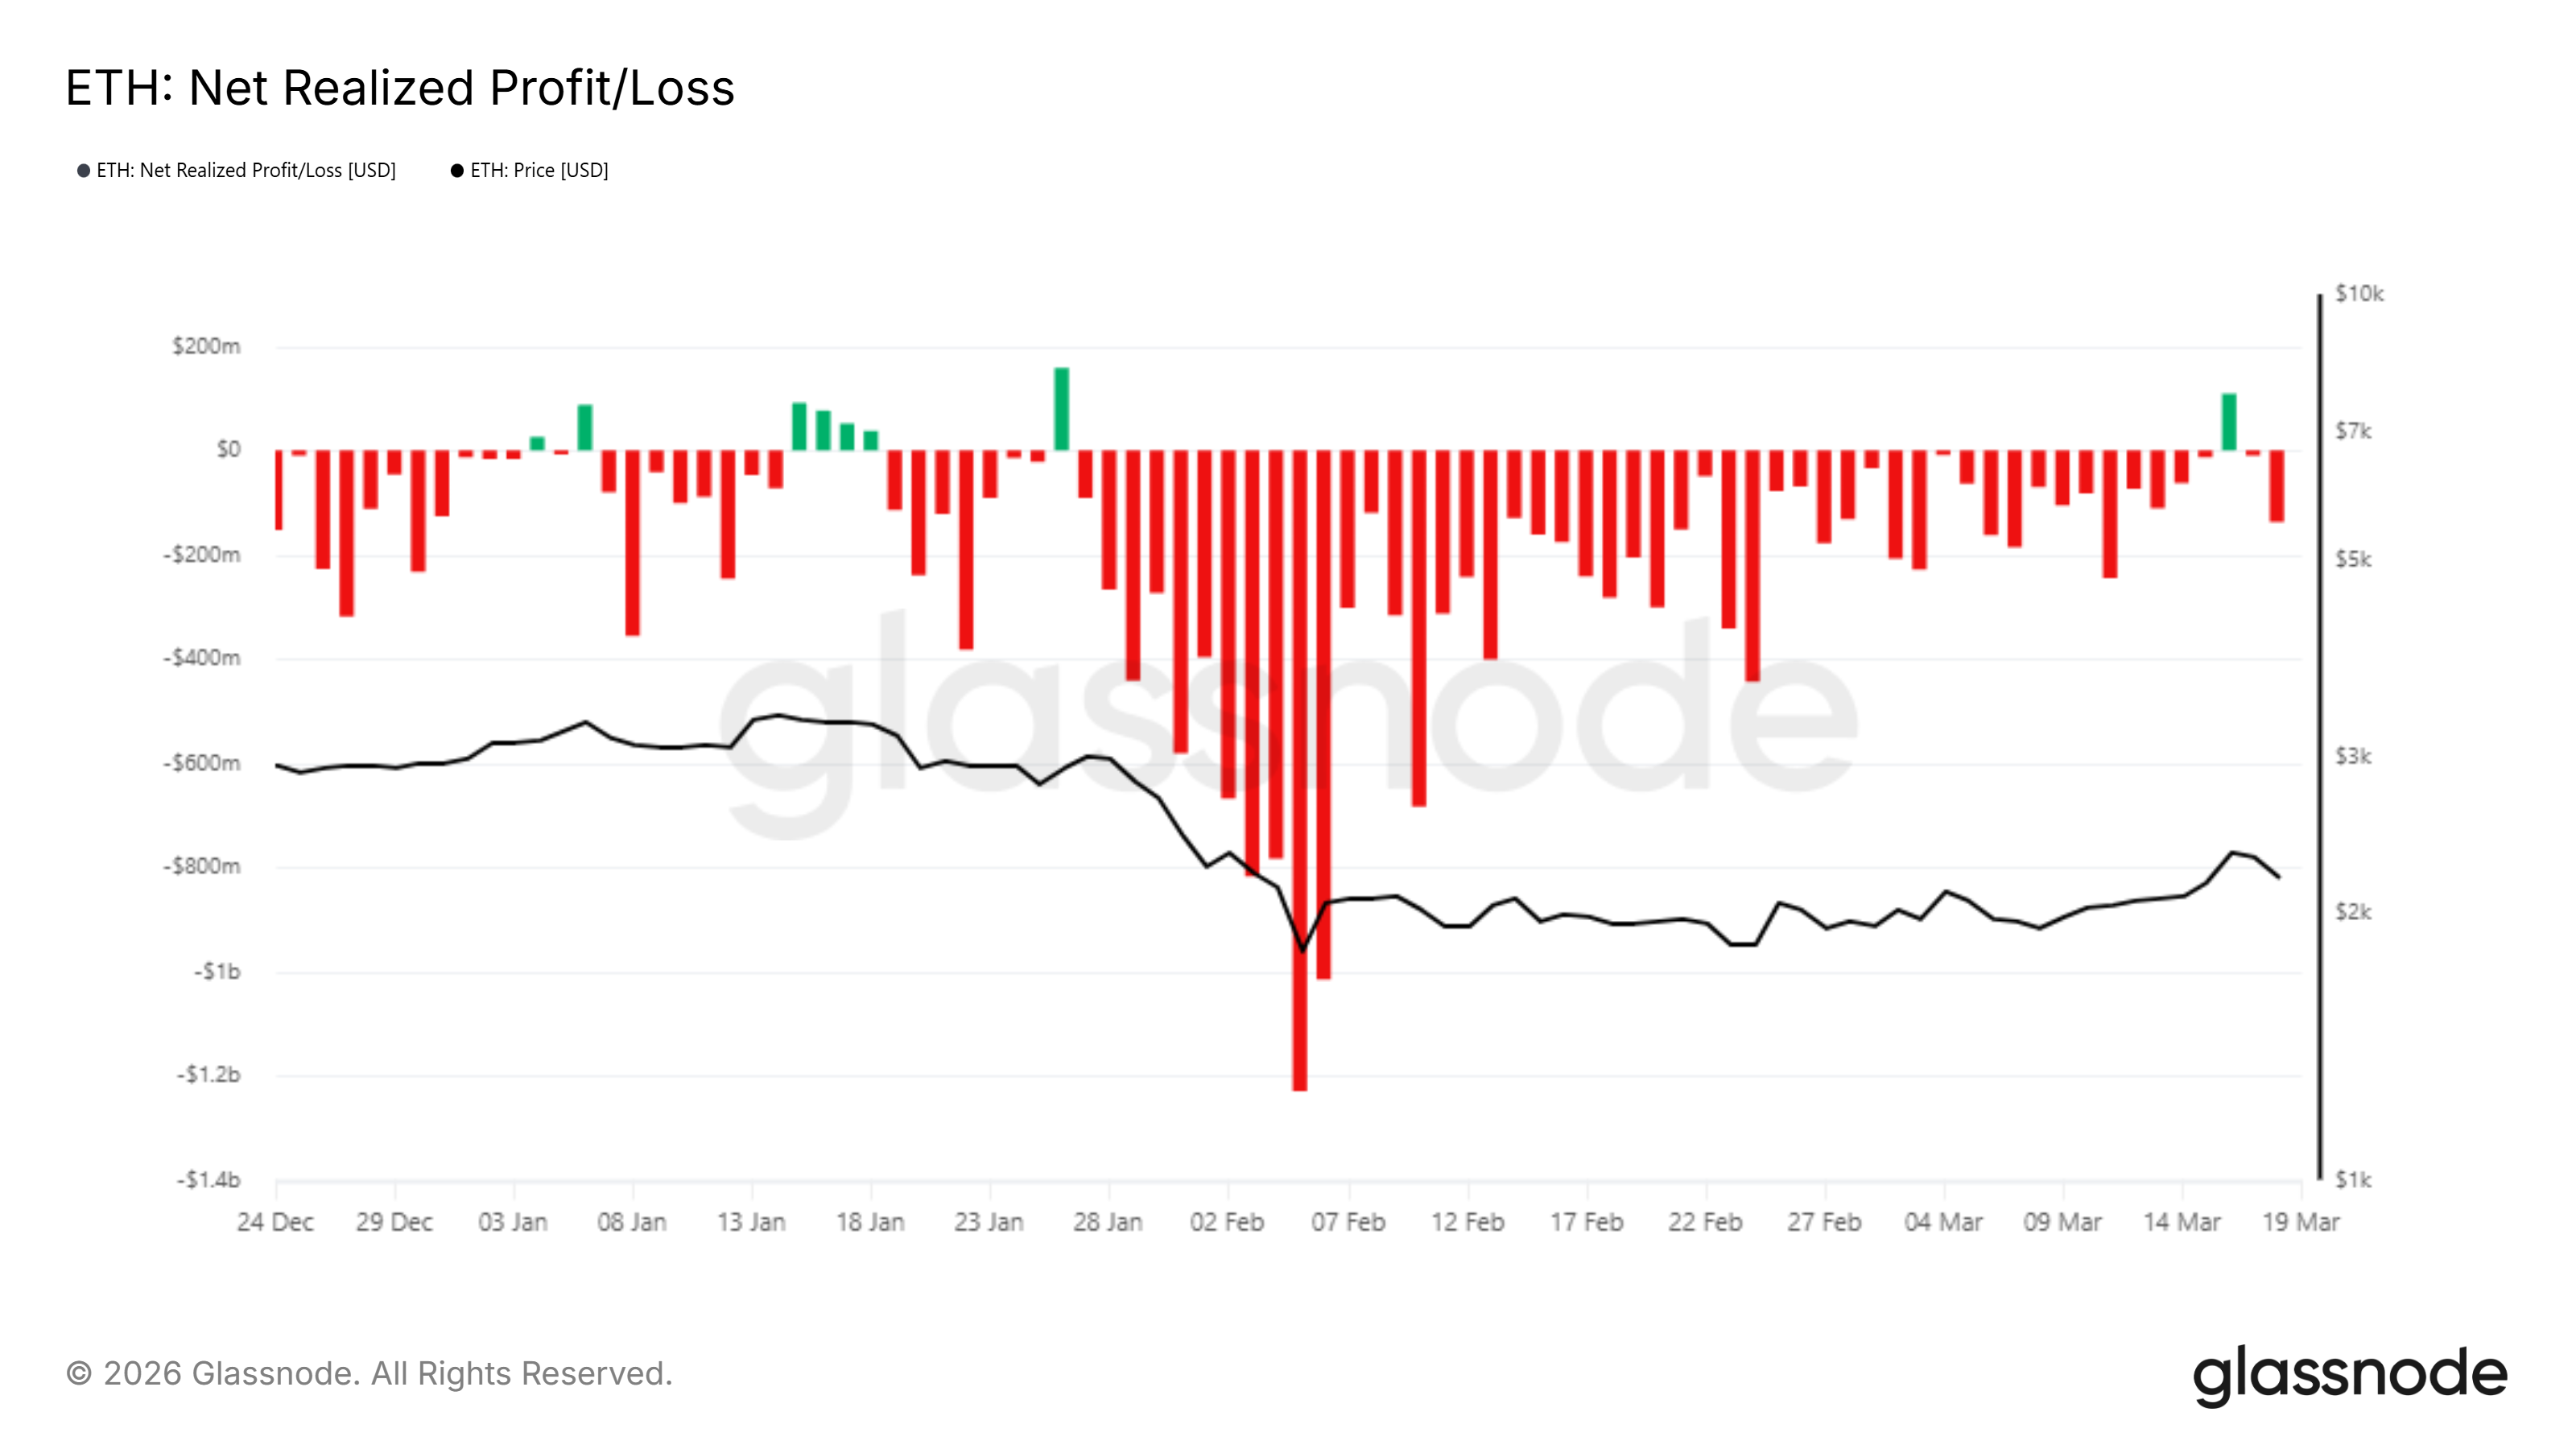 Ethereum Realized Profit/Loss. Source: Glassnode
New address creation on the Ethereum network has dropped 16%, reaching a near three-month low of 231,867. This decline signals that potential new investors are stepping back rather than entering the market. The consistent losses experienced by existing holders appear to be deterring fresh participation, as new entrants are reluctant to buy into a persistently loss-generating asset.
Declining new address growth directly impacts the flow of fresh capital into Ethereum. New addresses represent demand from first-time buyers, and their absence removes a critical source of incremental buying pressure. Without this fresh capital injection, Ethereum’s ability to sustain price advances above key resistance levels becomes increasingly dependent on existing holders changing their behavior, an unlikely near-term development.
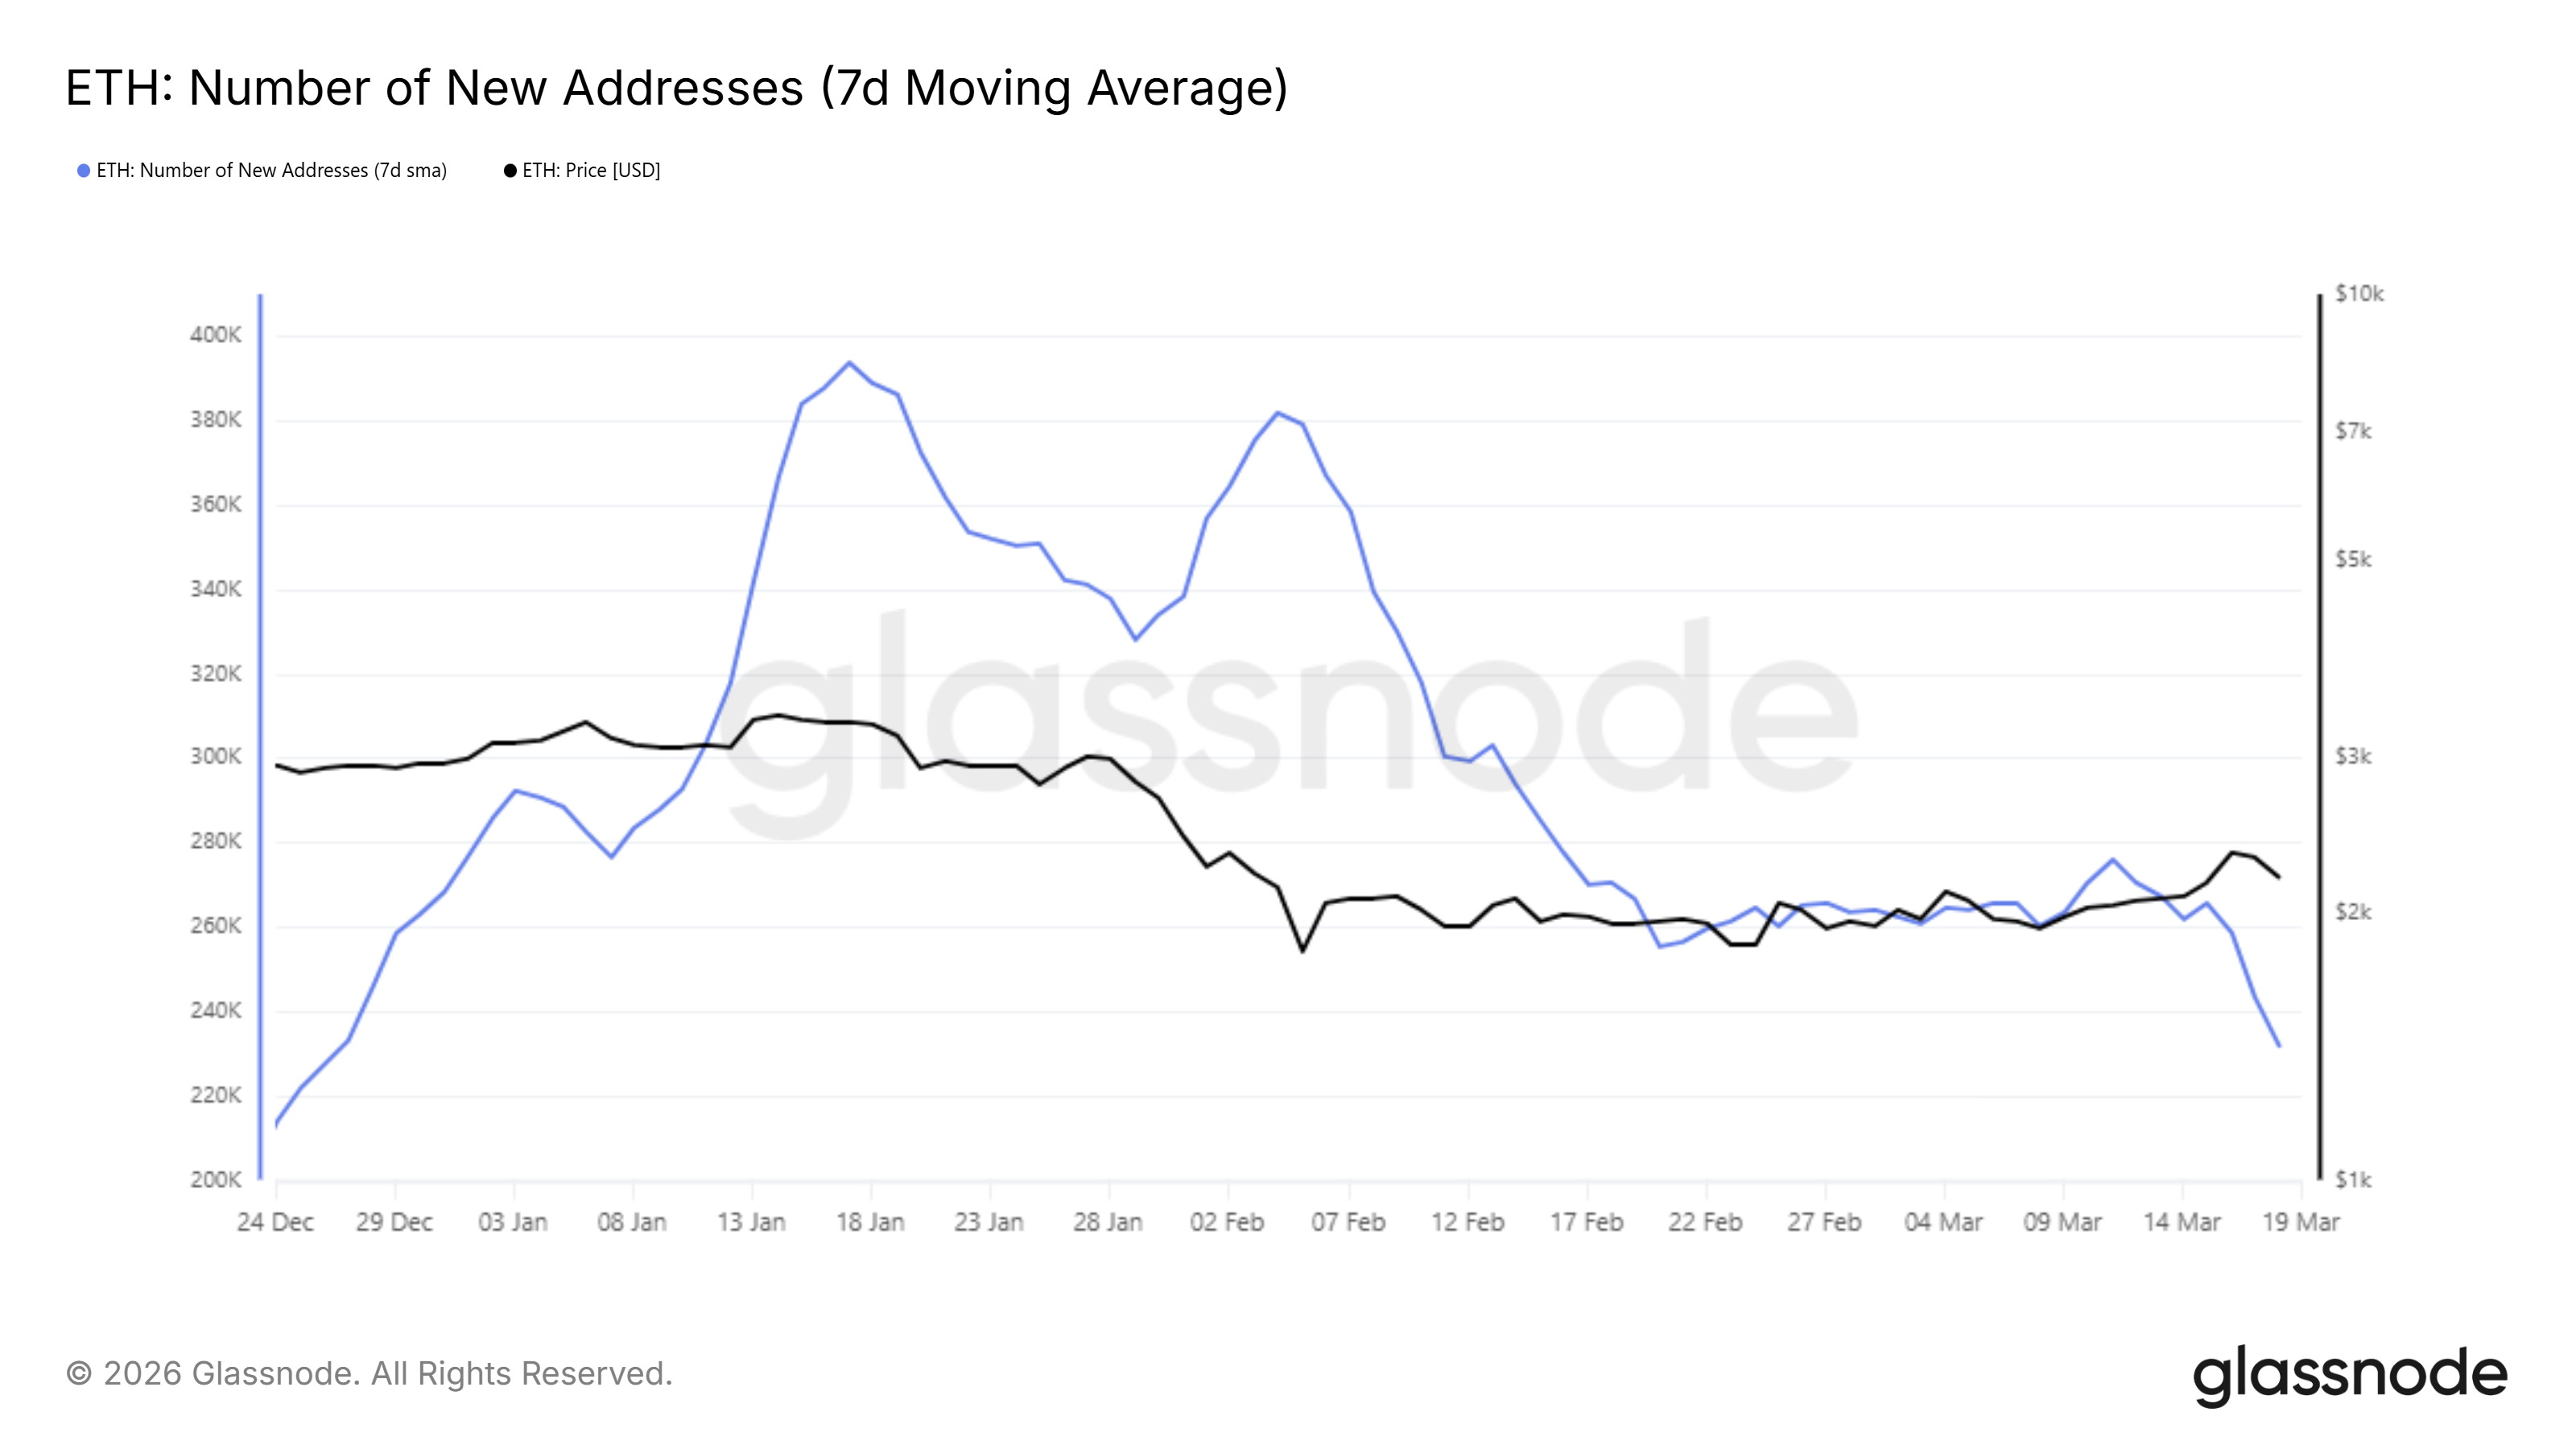 . Source: Glassnode
ETH Price Set To Lose Key Support
Ethereum is trading at $2,189, holding above the $2,158 support level after losing the 50-day exponential moving average as structural backing. The loss of EMA support is a technically significant development, confirming that the short-term trend has deteriorated. This structural weakness makes the $2,158 floor the last meaningful defense before a deeper decline.
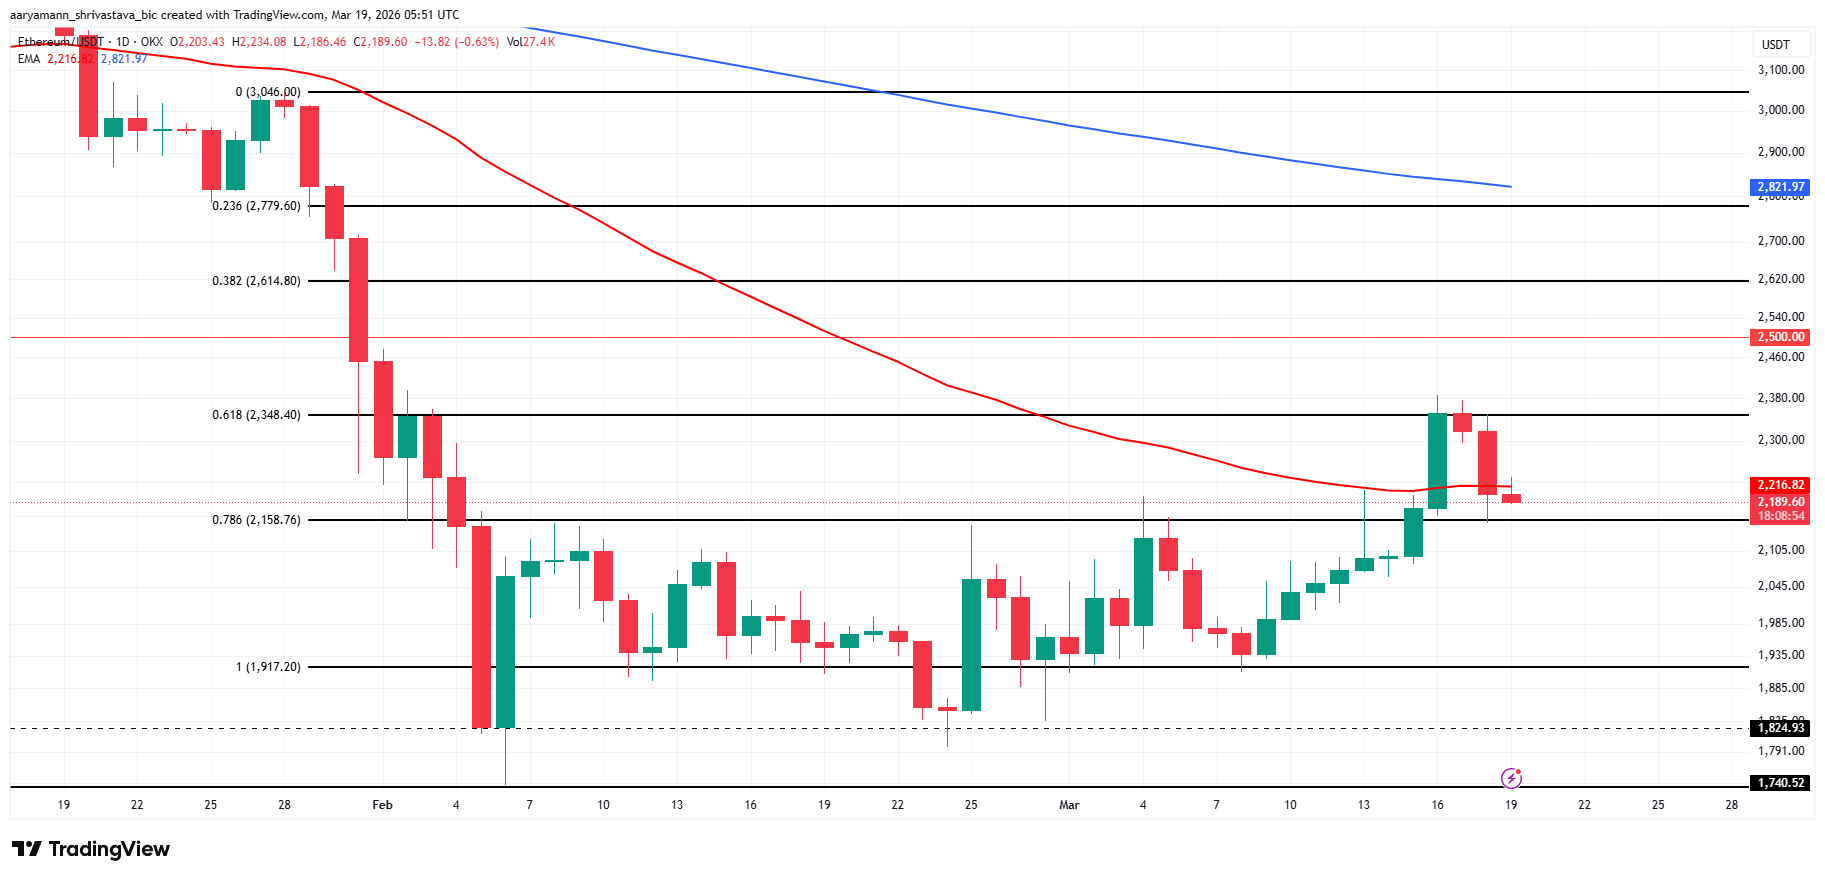 ETH Price Analysis. Source: TradingView
Continued selling pressure from underwater investors could breach the $2,158 support, exposing Ethereum to a decline toward $1,917. Whether this scenario materializes depends on whether holders choose to continue panic selling or stabilize their behavior at current levels. Sustained selling below $2,158 would confirm that the recovery attempt has failed.
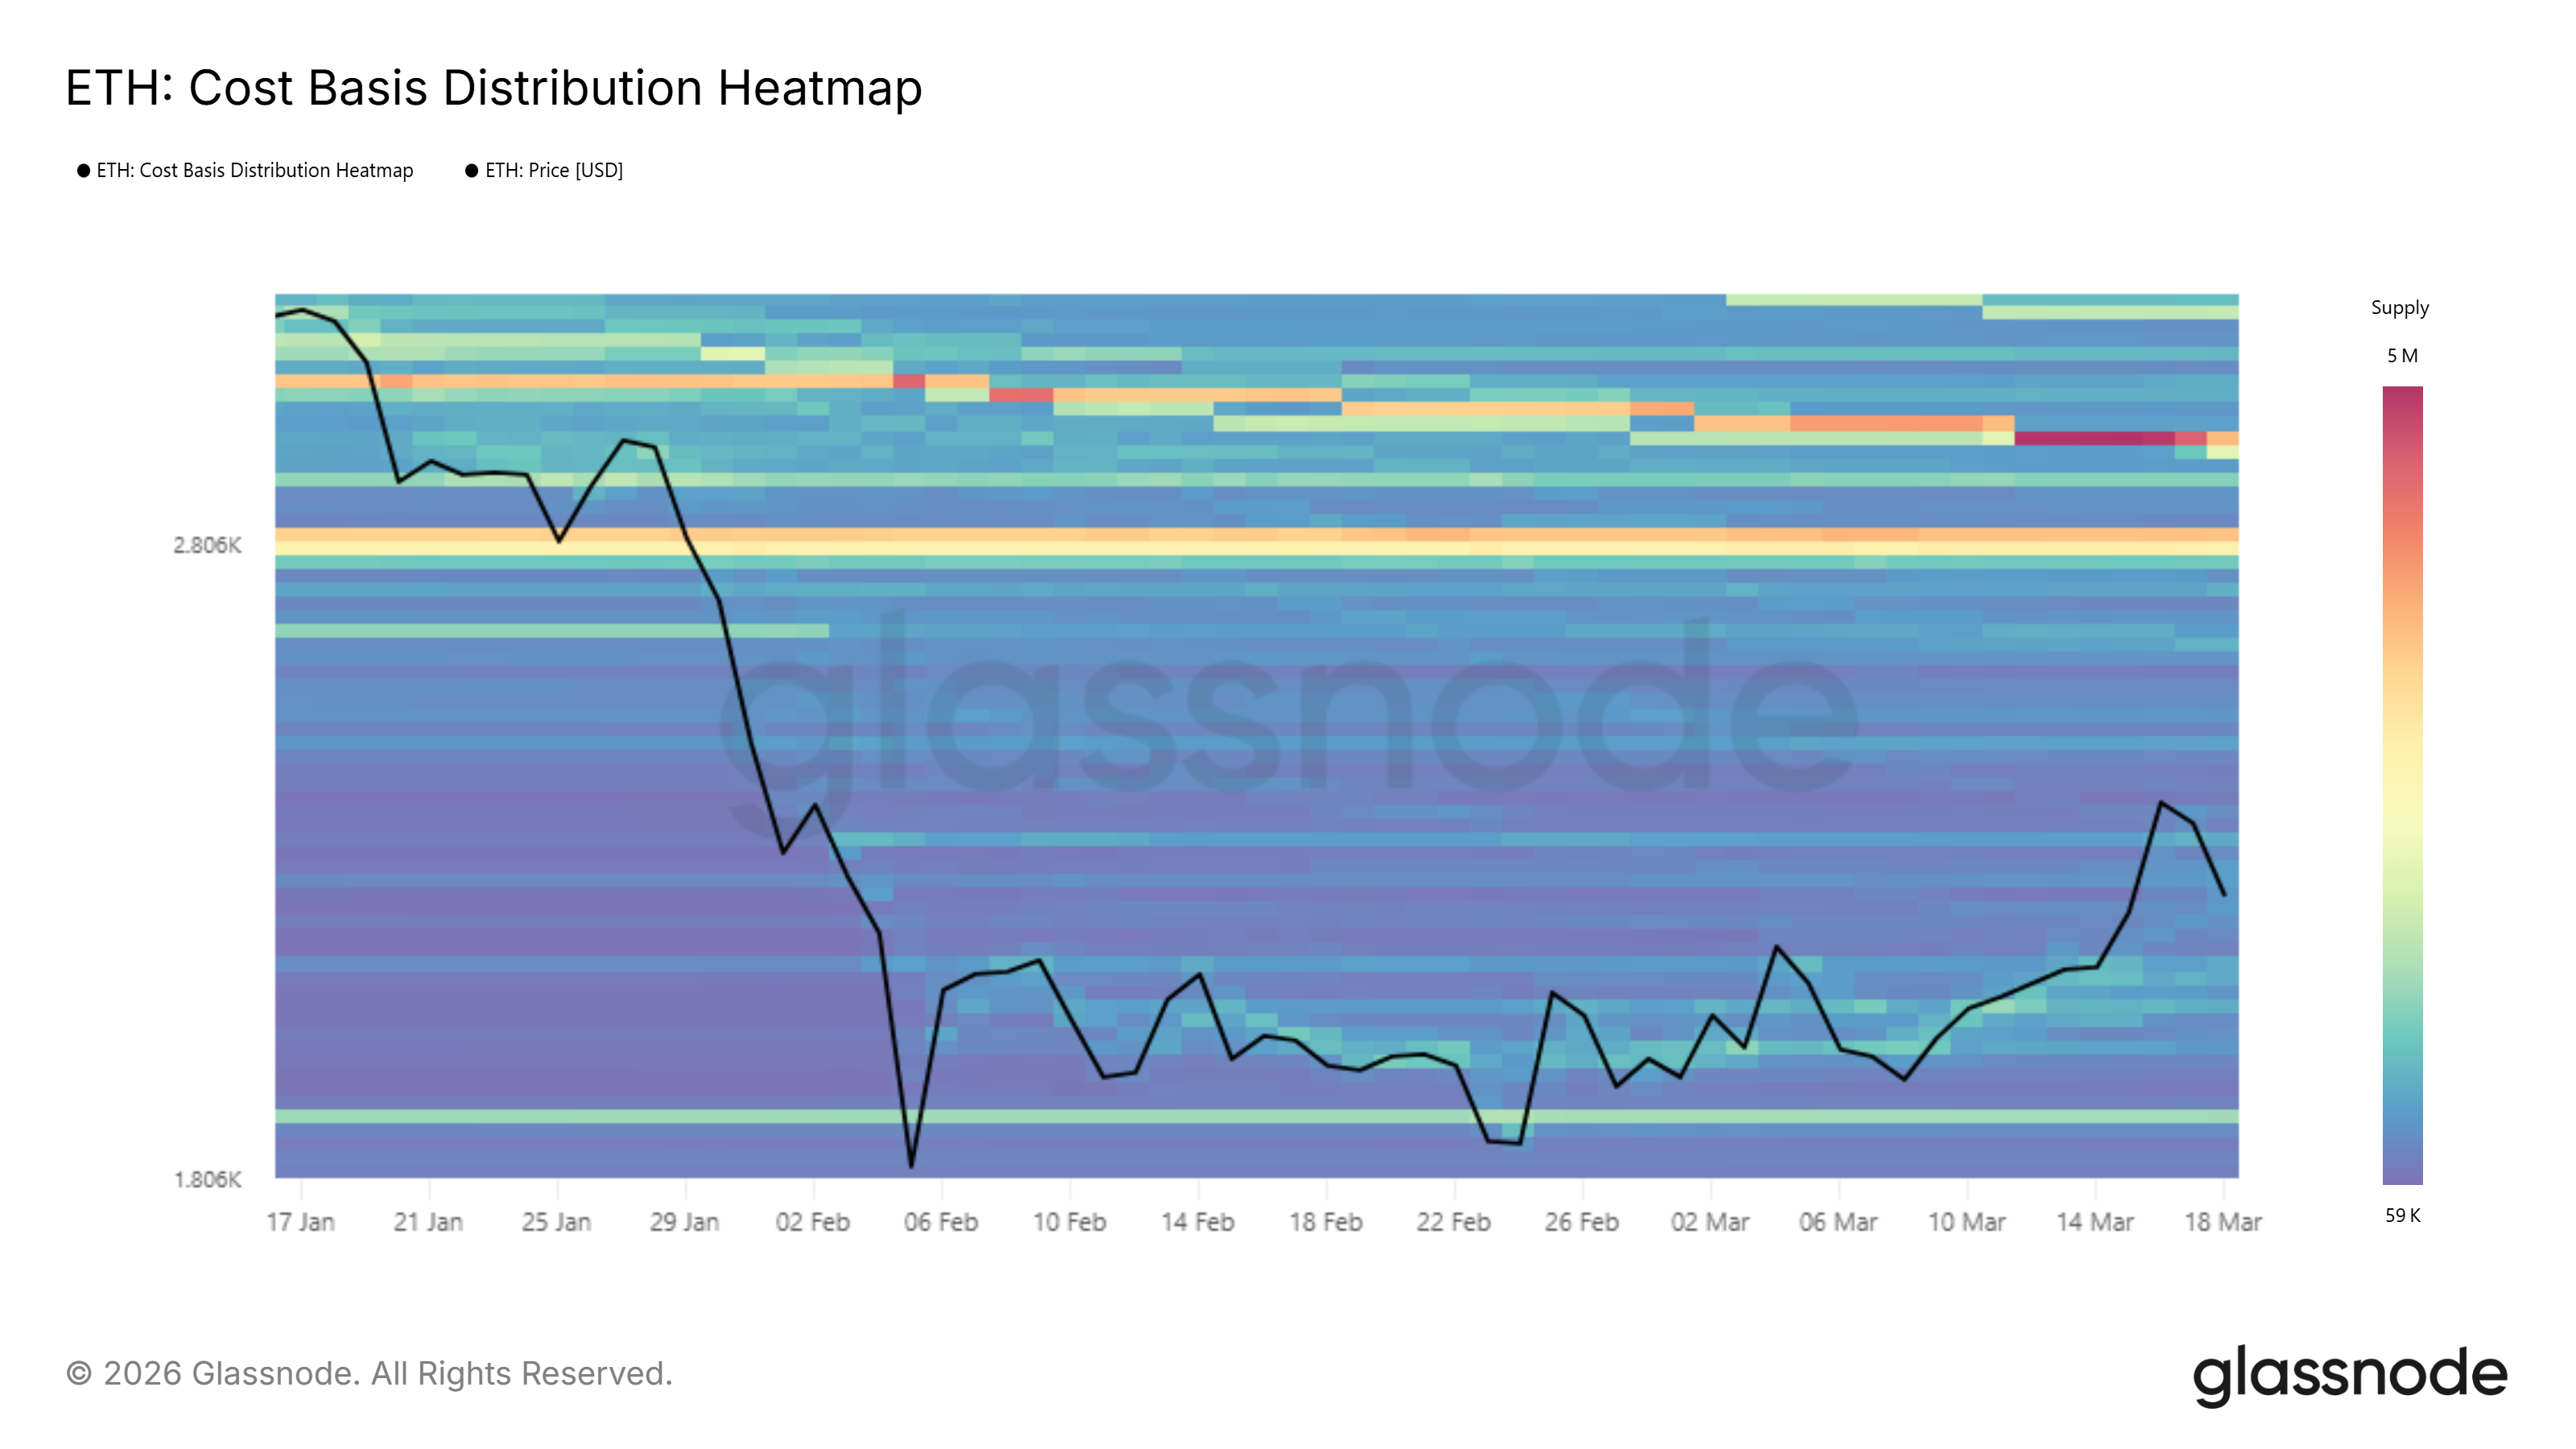 Ethereum CBD Heatmap. Source: Glassnode
A bounce off $2,158 that successfully flips the $2,348 resistance into support would change the outlook significantly. That structural shift would position Ethereum for a rally toward $2,500, invalidating the current bearish thesis. As the CBD Heatmap shows, Ethereum has no major supply wall until $2,850, giving it enough room to rally.
Recommended Articles


