Tron (TRX) Price Tests Resistance Zones as Momentum Shifts

Source Beincrypto

Tron (TRX) price is currently exhibiting signs of bullish momentum; however, its price is down, while all the other biggest coins in the market are positive today.

While various indicators show a bullish outlook, there are also signals that point to an important possible turning point for TRX.

TRX Ichimoku Cloud Shows a Bullish Momentum

The Ichimoku Cloud chart for TRX price reveals a generally favorable outlook. Currently, TRX price remains above the Kumo (cloud), which is typically a positive signal for bullish sentiment. The cloud itself is moderately thick, suggesting a reasonable level of support below the current price if a retracement were to occur.

Additionally, the green Senkou Span A, above the red Senkou Span B, forms a bullish cloud ahead, reinforcing optimism for further gains. The Kijun-sen (red line) lies below the current price, offering support, though its flat trajectory hints at a pause in momentum.

Meanwhile, the Tenkan-sen (blue line) closely follows price action, maintaining a positive outlook for short-term momentum, though a potential bearish signal could arise if it crosses below the Kijun-sen.

Read more: 7 Best Tron Wallets for Storing TRX
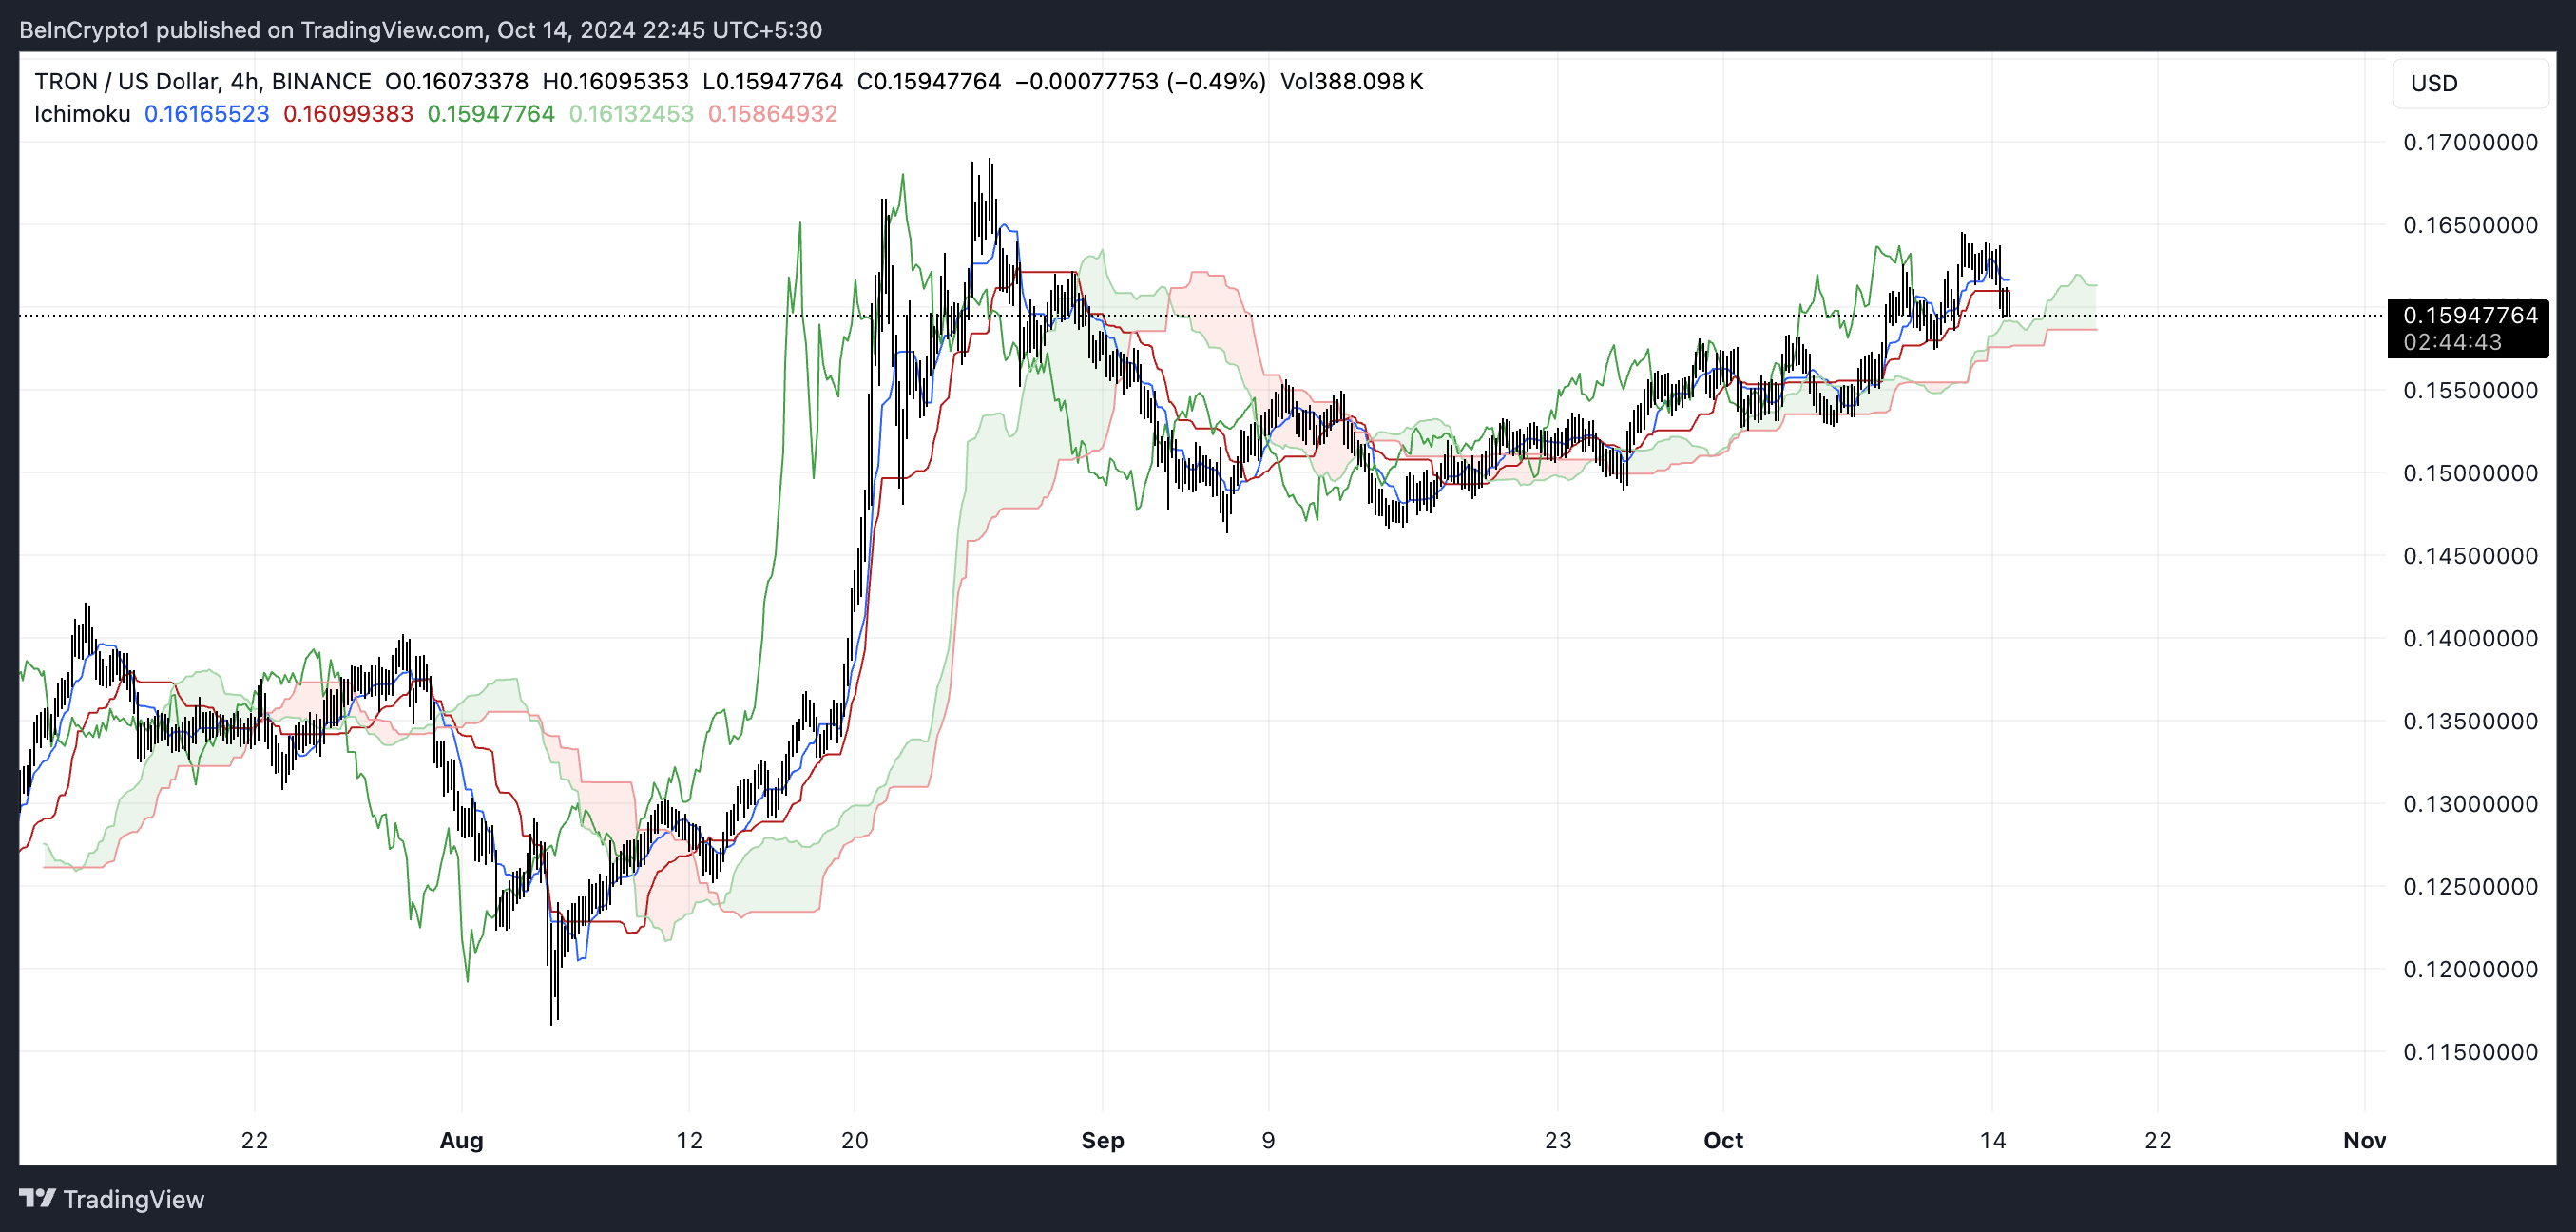
TRX Ichimoku Cloud.TRX Ichimoku Cloud. Source: TradingView

The Chikou Span (green lagging line), which is positioned above the price level from 26 periods ago, further confirms that TRX’s current trend is backed by positive momentum. However, as the Chikou Span nears the current price level, it signals that the ongoing bullish momentum might face challenges and could enter a consolidation phase.

While the broader sentiment for TRX remains bullish, the asset appears to be at a pivotal point, requiring either a breakout above resistance or strong support to sustain its upward trajectory.

DMI Suggests Moderate Trend Strength

The Directional Movement Index (DMI) for Tron (TRX) provides valuable insights into the current trend strength. The yellow line, representing the Average Directional Index (ADX), is currently around 23.8, suggesting a moderate trend strength, though not particularly strong.

The blue line (+DI), which measures the strength of positive price movements, is at 11.3, indicating relatively weak buying pressure at this point. Meanwhile, the red line (-DI), which measures the strength of negative price movements, is slightly higher at 13.3, suggesting that selling pressure currently outweighs buying pressure, though not by a significant margin.

TRX DMI. Source: TradingView

The ADX, which has fluctuated considerably in recent months, shows that TRX’s trend strength has varied, with some periods of high volatility followed by more subdued phases. The current positioning of the +DI and -DI lines below 20 indicates a lack of significant momentum for either bulls or bears, pointing to a range-bound or consolidative period.

For TRX to regain a more decisive upward trajectory, the +DI would need to cross above the -DI, combined with an increase in the ADX value above 25, to signal a strengthening trend. Overall, the DMI suggests that while the broader sentiment is slightly bearish, there is room for a potential shift, contingent on increased buying pressure and an improvement in trend strength.

TRX Price Prediction: Potential Trend Reversal in Play

TRX’s EMA lines are currently showing a bullish pattern, with short-term EMAs positioned above the long-term EMAs. This setup typically indicates positive momentum and a continuation of the uptrend.

However, the short-term EMA lines are starting to turn downward. This could suggest a potential reversal of the current trend. If this downward shift continues, it may indicate a weakening of buying pressure and a transition toward a more bearish phase for TRX.

Exponential Moving Averages (EMAs) are a type of moving average that gives more weight to recent data, making them more responsive to the latest price movements compared to Simple Moving Averages (SMAs). Short-term EMA lines reflect recent price behavior, while long-term EMA lines provide a broader view of the overall trend.

Read More: TRON (TRX) Price Prediction 2024/2025/2030

TRX EMA Lines and Support and ResistanceTRX EMA Lines and Support and Resistance. Source: TradingView

If the uptrend continues, TRX will likely test its next resistances at $0.166 and potentially even $0.169, suggesting room for further gains if buying pressure strengthens.

However, if the trend reverses, as implied by the recent movement of the EMA lines, TRX may test support levels at $0.155, $0.152, or even as low as $0.1462. These support zones could play a crucial role in determining whether the bearish momentum deepens or if a rebound is possible.

Disclaimer: For information purposes only. Past performance is not indicative of future results.
placeholder
Bitcoin's 2025 Gains Erased: Who Ended the BTC Bull Market?After slumping below $93,500, 2025 Bitcoin price gains have been completely wiped out. Investors are puzzled as to why its bull market, underpinned by political tailwinds, institutionaliz
Author  TradingKey
6 hours ago
After slumping below $93,500, 2025 Bitcoin price gains have been completely wiped out. Investors are puzzled as to why its bull market, underpinned by political tailwinds, institutionaliz
placeholder
Oil Extends Losses as Russian Port Resumes Operations, Easing Supply FearsOil prices fell further on Monday as market participants reacted to signs of resumed activity at Russia’s key Novorossiysk export terminal on the Black Sea, easing concerns over a prolonged supply disruption after a Ukrainian drone strike last week.
Author  Mitrade
10 hours ago
Oil prices fell further on Monday as market participants reacted to signs of resumed activity at Russia’s key Novorossiysk export terminal on the Black Sea, easing concerns over a prolonged supply disruption after a Ukrainian drone strike last week.
placeholder
Bitcoin slides deeper into red as bears lean on $96,600 wall and eye $90,000Bitcoin extends its decline after failing to reclaim $96,500, trading below $95,000, the 100-hour SMA and a bearish trend line near $96,600; unless bulls can force a decisive close back above $96,600–$97,200, the short-term path of least resistance stays lower, with $92,500, $90,000 and the main $88,500 support zone in focus.
Author  Mitrade
13 hours ago
Bitcoin extends its decline after failing to reclaim $96,500, trading below $95,000, the 100-hour SMA and a bearish trend line near $96,600; unless bulls can force a decisive close back above $96,600–$97,200, the short-term path of least resistance stays lower, with $92,500, $90,000 and the main $88,500 support zone in focus.
placeholder
Bitcoin briefly loses 2025 gains as crypto plunges over the weekend.Bitcoin experienced a sharp decline this weekend, briefly erasing its 2025 gains and dipping below its year-opening value of $93,507. The cryptocurrency fell to a low of $93,029 on Sunday, representing a 25% drop from its all-time high in October. Although it has rebounded slightly to around $94,209, the pressures on the market remain significant. The downturn occurred despite the reopening of the U.S. government on Thursday, which many had hoped would provide essential support for crypto markets. This year initially appeared promising for cryptocurrencies, particularly after the inauguration of President Donald Trump, who has established the most pro-crypto administration thus far. However, ongoing political tensions—including Trump's tariff strategies and the recent government shutdown, lasting a historic 43 days—have contributed to several rapid price pullbacks for Bitcoin throughout the year. Market dynamics are also being influenced by Bitcoin whales—investors holding large amounts of Bitcoin—who have been offloading portions of their assets, consequently stalling price rallies even as positive regulatory developments emerge. Despite these sell-offs, analysts from Glassnode argue that this behavior aligns with typical patterns seen among long-term investors during the concluding stages of bull markets, suggesting it is not indicative of a mass exodus. Notably, Bitcoin is not alone in its struggles, as Ethereum and Solana have also recorded declines of 7.95% and 28.3%, respectively, since the start of the year, while numerous altcoins have faced even steeper losses. Looking ahead, questions linger regarding the viability of the four-year cycle thesis, particularly given the increasing institutional support and regulatory frameworks now in place in the crypto landscape. Matt Hougan, chief investment officer at Bitwise, remains optimistic, suggesting a potential Bitcoin resurgence in 2026 driven by the “debasement trade” thesis and a broader trend toward increased adoption of stablecoins, tokenization, and decentralized finance. Hougan emphasized the soundness of the underlying fundamentals, pointing to a positive outlook for the sector in the longer term.
Author  Mitrade
14 hours ago
Bitcoin experienced a sharp decline this weekend, briefly erasing its 2025 gains and dipping below its year-opening value of $93,507. The cryptocurrency fell to a low of $93,029 on Sunday, representing a 25% drop from its all-time high in October. Although it has rebounded slightly to around $94,209, the pressures on the market remain significant. The downturn occurred despite the reopening of the U.S. government on Thursday, which many had hoped would provide essential support for crypto markets. This year initially appeared promising for cryptocurrencies, particularly after the inauguration of President Donald Trump, who has established the most pro-crypto administration thus far. However, ongoing political tensions—including Trump's tariff strategies and the recent government shutdown, lasting a historic 43 days—have contributed to several rapid price pullbacks for Bitcoin throughout the year. Market dynamics are also being influenced by Bitcoin whales—investors holding large amounts of Bitcoin—who have been offloading portions of their assets, consequently stalling price rallies even as positive regulatory developments emerge. Despite these sell-offs, analysts from Glassnode argue that this behavior aligns with typical patterns seen among long-term investors during the concluding stages of bull markets, suggesting it is not indicative of a mass exodus. Notably, Bitcoin is not alone in its struggles, as Ethereum and Solana have also recorded declines of 7.95% and 28.3%, respectively, since the start of the year, while numerous altcoins have faced even steeper losses. Looking ahead, questions linger regarding the viability of the four-year cycle thesis, particularly given the increasing institutional support and regulatory frameworks now in place in the crypto landscape. Matt Hougan, chief investment officer at Bitwise, remains optimistic, suggesting a potential Bitcoin resurgence in 2026 driven by the “debasement trade” thesis and a broader trend toward increased adoption of stablecoins, tokenization, and decentralized finance. Hougan emphasized the soundness of the underlying fundamentals, pointing to a positive outlook for the sector in the longer term.
placeholder
Gold Price Forecast: XAU/USD recovers above $4,100, hawkish Fed might cap gainsGold price (XAU/USD) recovers some lost ground to near $4,105, snapping the two-day losing streak during the early European session on Friday. The precious metal edges higher on the softer US Dollar (USD).  Traders will take more cues from the Fedspeak later on Monday.
Author  FXStreet
15 hours ago
Gold price (XAU/USD) recovers some lost ground to near $4,105, snapping the two-day losing streak during the early European session on Friday. The precious metal edges higher on the softer US Dollar (USD).  Traders will take more cues from the Fedspeak later on Monday.
goTop
quote