

Ethereum Price Forecast: ETH could decline to $2,200 amid rising US inflation and exchange reserves
Ethereum Price Today: $2,350
- Ethereum price breached the $2,395 level following the US CPI data release.
- Ethereum ETFs recorded zero flows for the second time this week as bearish sentiment prevails in the market.
- However, the total amount of staked ETH reaching 34.78 million indicates long-term bullish bias among investors.
Ethereum (ETH) plunged 3.8% on Thursday following a hike in US inflation data and rejection near its 50-day Simple Moving Average (SMA).
Ethereum bows in light of rising US inflation, stakers still bullish in the long term
Ethereum and the crypto market saw a second consecutive day of losses after the September US Consumer Price Index (CPI) data came in stronger than expected.
September's inflation fell to 2.4% — but above expectations of 2.3% — while core inflation data ticked by ten basis points from 3.2% to 3.3%.
Meanwhile, Ethereum ETFs posted zero flows for the second time this week on Wednesday, as the nine issuers didn't record any buy/sell activity. This marks the third time ETH ETFs have recorded zero flows since their launch on July 23. The weak flows reflect the current bearish sentiment surrounding Ethereum and the crypto market.
A similar trend is noticed in Ethereum exchange reserves, which have increased by over 170K ETH in the past six days. An increase in exchange reserves tends to negatively affect price as it reflects rising selling pressure.
-638641827935497516.png)
ETH Exchange Reserve
However, the growing amount of staked ETH shows investors may be bullish in the long term. According to IntoTheBlock's data, 28.9% of all ETH in circulation— i.e., about 34.78 million ETH — is staked across staking protocols. Notably, more than 15.3% of the 34.78 million ETH has been staked for over three years.
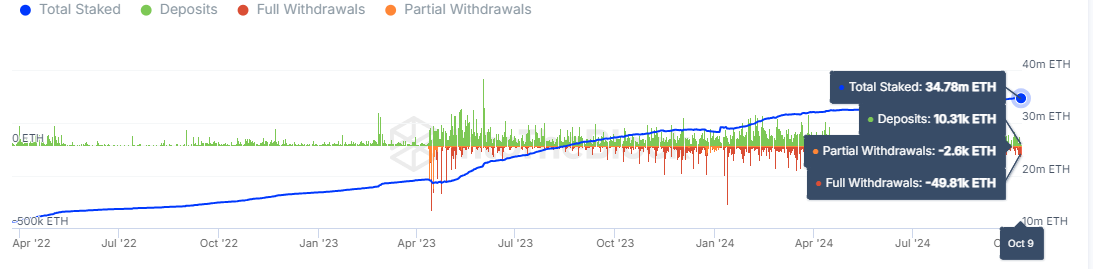
ETH Staking flows
Ethereum Price Forecast: ETH could bounce off the $2,310 support level
Ethereum trades around $2,350 on Thursday, down over 3% on the day, following $52.31 million in liquidations — with long and short liquidations accounting for $46.2 million and $6.11 million, respectively, per Coinglass data.
ETH breached the $2,395 support on Wednesday and has struggled to reclaim the level after faltering before the 50-day SMA resistance.
As a result, the top altcoin is attempting a decline toward $2,310. A failure to bounce off this level will send ETH to the support near the $2,200 psychological level.
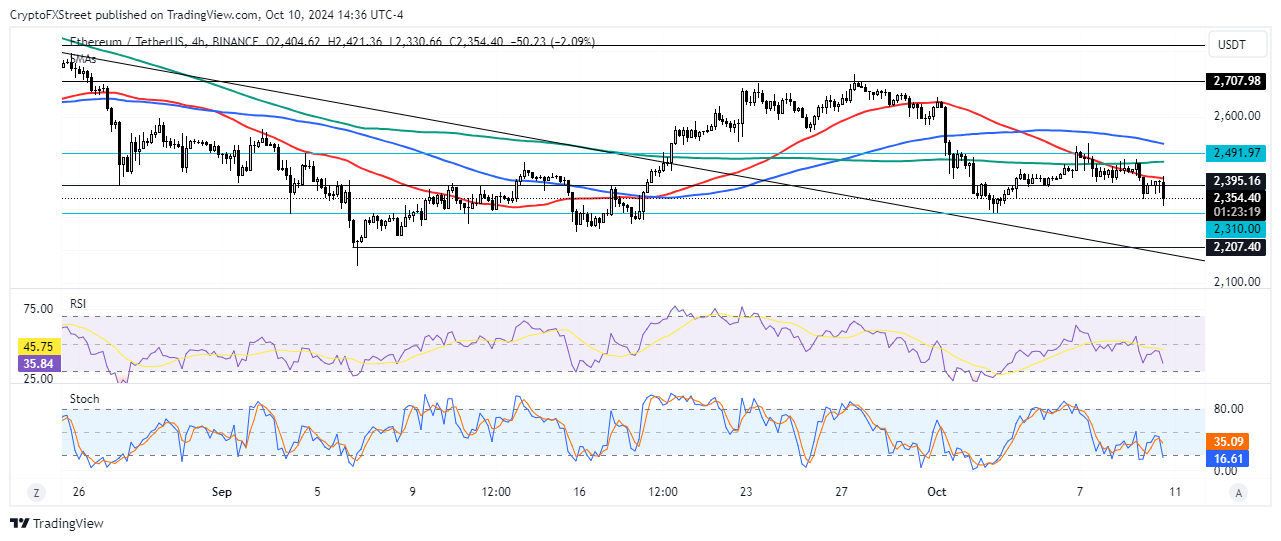
ETH/USDT 4-hour chart
The Relative Strength Index (RSI) is trending toward its oversold region below 30, while the Stochastic Oscillator (Stoch) is in oversold condition. This indicates a potential correction, and a bounce off the $2,310 level could be in the cards.
A daily candlestick close below the $2,200 psychological level will invalidate the thesis.
Ethereum FAQs
Ethereum is a decentralized open-source blockchain with smart contracts functionality. Its native currency Ether (ETH), is the second-largest cryptocurrency and number one altcoin by market capitalization. The Ethereum network is tailored for building crypto solutions like decentralized finance (DeFi), GameFi, non-fungible tokens (NFTs), decentralized autonomous organizations (DAOs), etc.
Ethereum is a public decentralized blockchain technology, where developers can build and deploy applications that function without the need for a central authority. To make this easier, the network leverages the Solidity programming language and Ethereum virtual machine which helps developers create and launch applications with smart contract functionality.
Smart contracts are publicly verifiable codes that automates agreements between two or more parties. Basically, these codes self-execute encoded actions when predetermined conditions are met.
Staking is a process of earning yield on your idle crypto assets by locking them in a crypto protocol for a specified duration as a means of contributing to its security. Ethereum transitioned from a Proof-of-Work (PoW) to a Proof-of-Stake (PoS) consensus mechanism on September 15, 2022, in an event christened “The Merge.” The Merge was a key part of Ethereum's roadmap to achieve high-level scalability, decentralization and security while remaining sustainable. Unlike PoW, which requires the use of expensive hardware, PoS reduces the barrier of entry for validators by leveraging the use of crypto tokens as the core foundation of its consensus process.
Gas is the unit for measuring transaction fees that users pay for conducting transactions on Ethereum. During periods of network congestion, gas can be extremely high, causing validators to prioritize transactions based on their fees.
Recommended Articles


