

Key Indicators Reveal Ethereum’s Price Is Poised for Recovery
Ethereum (ETH) price recently faced a 13% correction, bringing the altcoin down from local highs. However, the cryptocurrency is showing signs of recovery, having secured a crucial bear market support level.
With market sentiment slowly improving, ETH appears poised for a potential rebound, though challenges remain.
Ethereum Losses Trigger HODLing
Ethereum has seen a spike in realized losses, which typically signals untimed selling from investors who may have exited positions during the downturn. Interestingly, these upticks can also indicate a shift in investor behavior, with many opting for HODL rather than risk further losses. By holding onto their assets, investors are waiting for Ethereum’s price to rise, giving them an opportunity to sell for a profit later on.
This change in strategy could help stabilize Ethereum’s price, as the reduction in selling pressure may prevent additional declines. Long-term holders are likely holding out for a better market environment, which could contribute to Ethereum’s gradual recovery.
Read more: How to Invest in Ethereum ETFs?
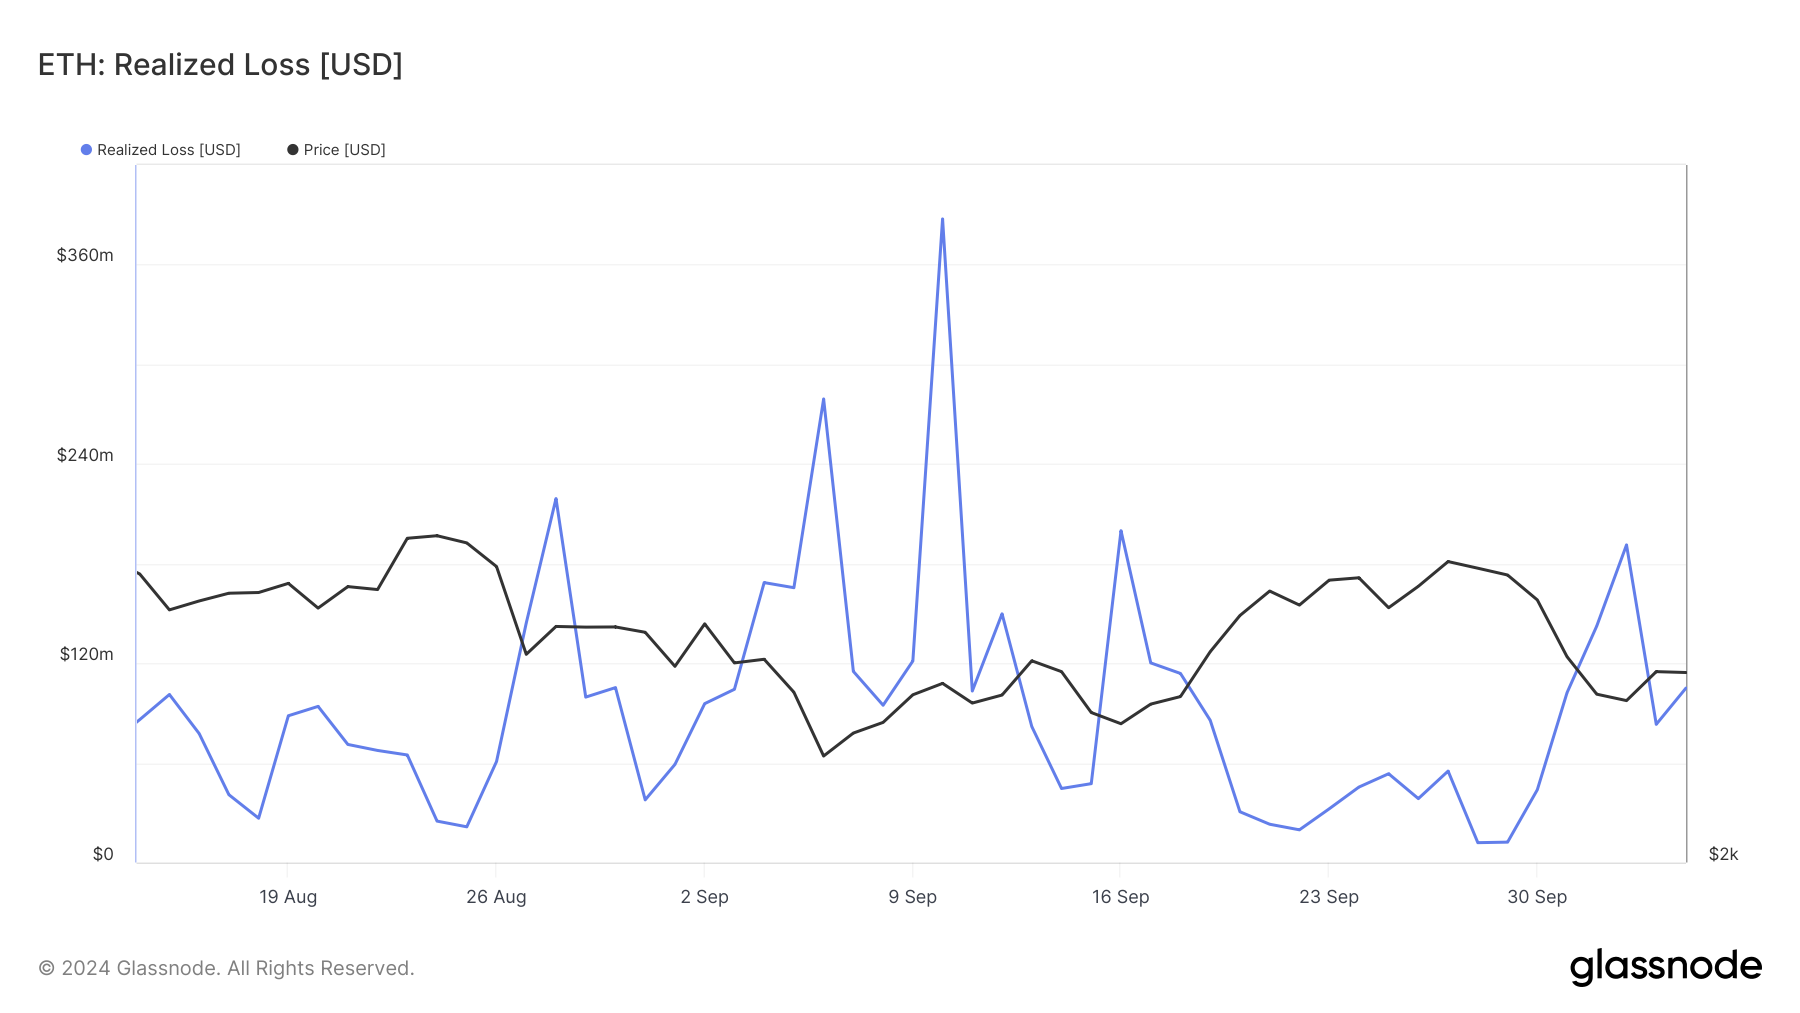 Ethereum Realized Losses. Source: Glassnode
The overall macro momentum for Ethereum is looking more favorable, especially when analyzing the exchanges’ net position change. This indicator tracks the flow of ETH into and out of exchanges, and the recent decline shows that inflows into exchanges have dropped. Lower inflows typically suggest reduced selling pressure, as fewer investors are moving their assets onto exchanges to sell.
This shift in momentum reflects a positive change in market sentiment. As selling activity decreases, Ethereum could gain some breathing room to recover from its recent decline. Investors are showing increased confidence in the asset, which may lead to upward price movement in the coming days.
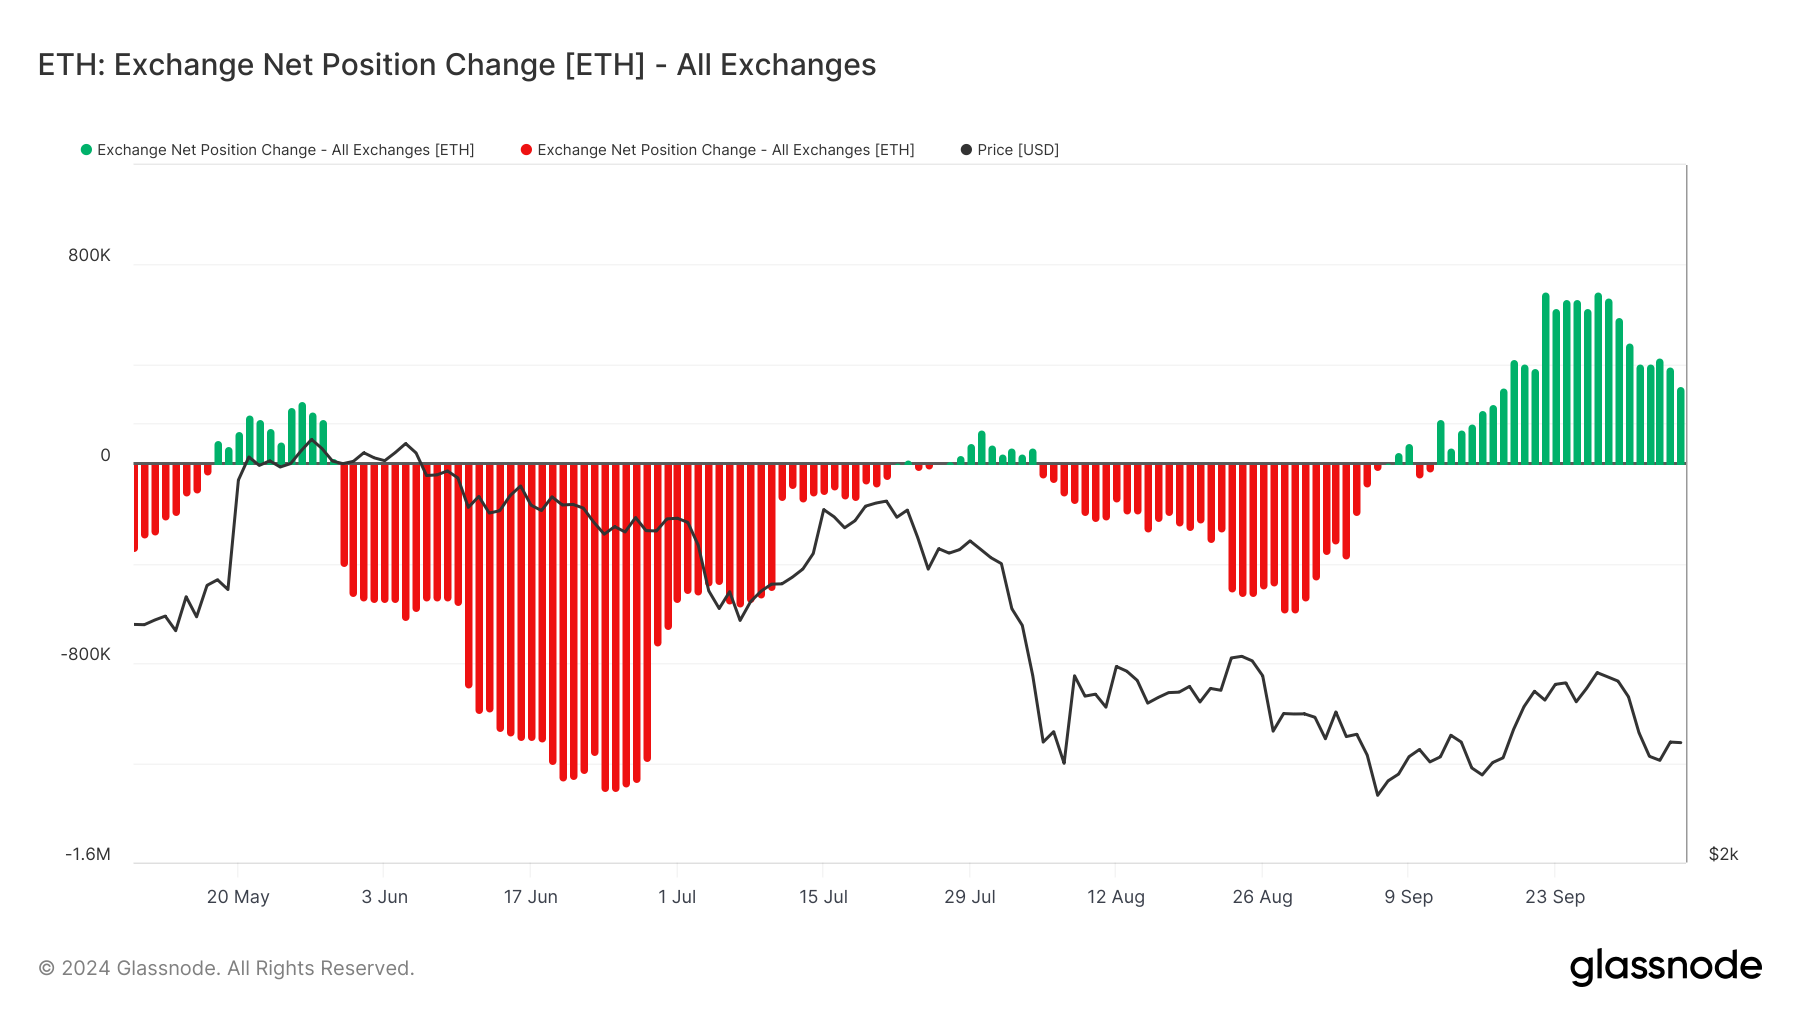 Ethereum Exchange Net Position Change. Source: Glassnode
ETH Price Prediction: Bouncing off Support
Ethereum’s price is currently trading at $2,428, recovering from its recent 13% decline. The cryptocurrency has successfully secured the 23.6% Fibonacci Retracement line at $2,401 as a support level, signaling a possible continuation of uptrend.
With the aforementioned market factors in play, Ethereum could potentially breach the $2,591 barrier, which coincides with the 38.2% Fibonacci line. A successful breakout would bring ETH above $2,600, allowing it to regain some of the ground lost during the correction.
Read more: Ethereum (ETH) Price Prediction 2024/2025/2030
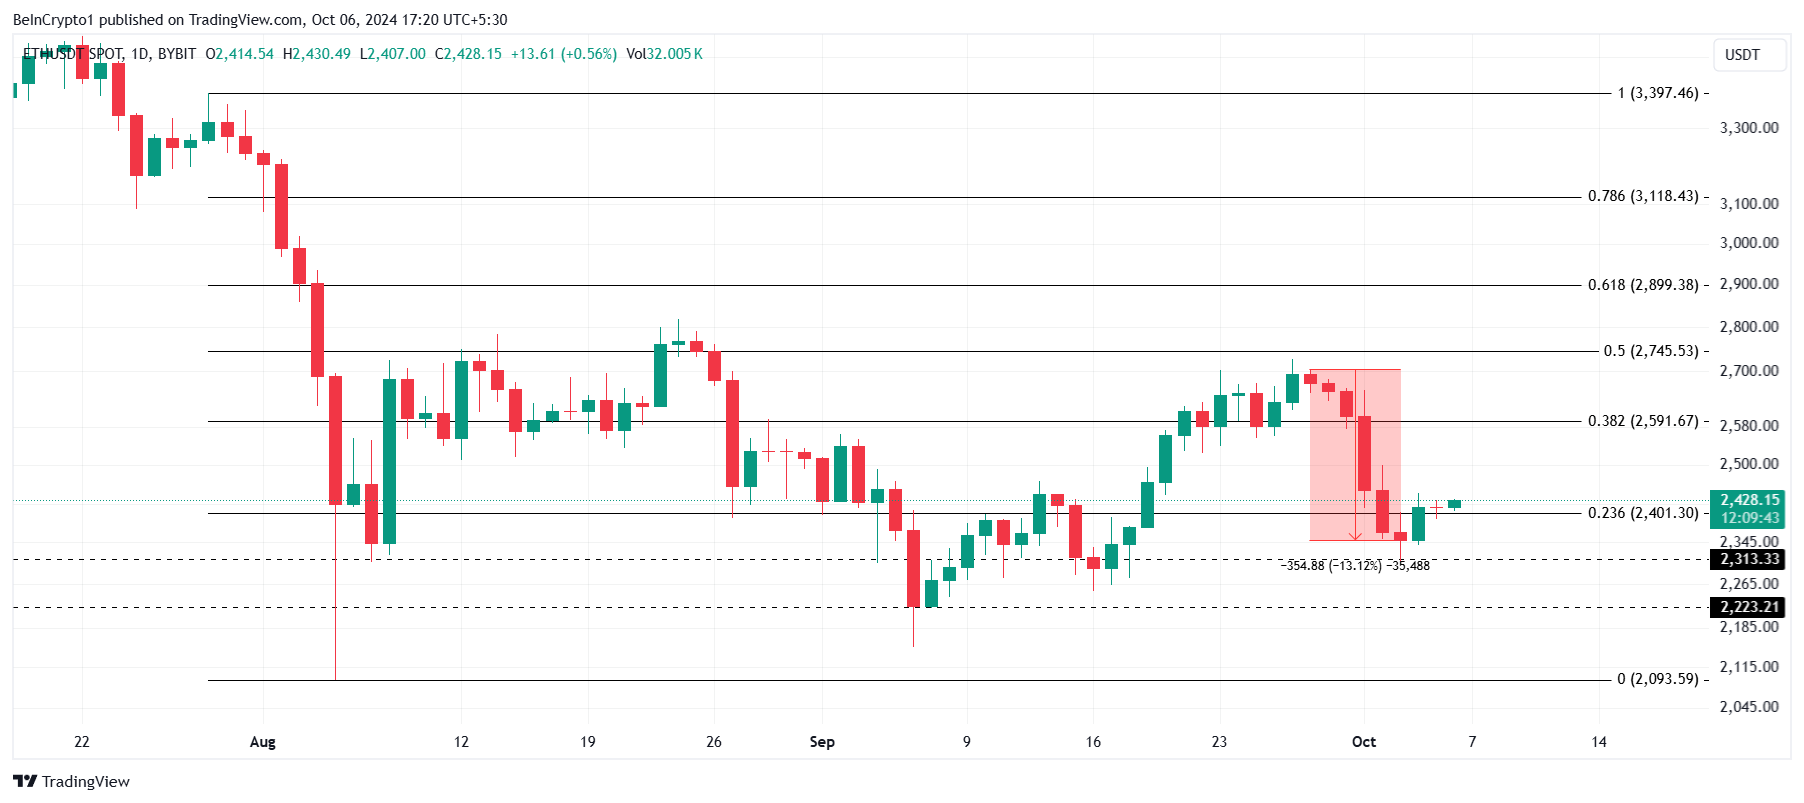 Ethereum Price Analysis. Source: TradingView
However, if Ethereum fails to breach $2,591, the altcoin may enter a period of consolidation, trading between $2,401 and $2,591. This would keep Ethereum subdued and invalidate the current bullish outlook, delaying any further price rallies in the near term.
Recommended Articles


