

Crypto Analyst Says Solana-Based BONK Is In Prime Position For Legendary Rally

Source Newsbtc

Lately, top meme based cryptocurrencies like Shiba Inu (SHIB) and Pepe (PEPE) have been witnessing a spike in their prices. This bullish trend appears to have extended to Solana based meme coin Bonk (BONK), as its price movements has been showing signs of an impending bullish surge. With respect to this, a crypto analyst has suggested that Bonk is currently well-positioned for a significant upward movement. 

Analyst Predicts Legendary Target At $0.000033

Bluntz, a prominent crypto trader and analyst has revealed the next bullish target for Bonk. In an X (formerly Twitter) post on September 30, Bluntz revealed that Bonk is currently in a prime position for a”turbo green week.”

He disclosed that the meme coin had experienced a quick and minor price dip during the week. However, the analyst sees this price decline as a positive sign, suggesting that it creates an opportunity for Bonk to enter a significantly bullish position, potentially triggering a legendary rally. 

Sharing a chart depicting Bonk’s price movements from the past month, Bluntz indicated in his price chart that the meme coin could experience an accelerated price increase to new highs. Presenting an illustration of his predictions of Bonk’s future price movements, the analyst disclosed that the meme coin would rise between the range of $0.000028 and $0.000027 before falling to the support level between $0.000026 and $0.000025. 

BONK 1

After this, Bonk is expected to skyrocket to $0.00003, before dropping back to $0.000028. For his final price surge in his projected turbo green week, Bluntz revealed that Bonk will reach a new price high of $0.000033. The analyst also revealed that for Bonk to experience a bullish price breakout, the meme coin will have to undergo three days of essential sideways trading. 

Presently the price of Bonk is trading at $0.00002, reflecting a slight increase of 3.86% in the past week. A jump to projected highs at $0.000033 would require the meme coin to rise by approximately 65% from its current price. 

BONK Set To Outperform PEPE

While maintaining an optimistic outlook on Bonk’s price, Bluntz disclosed that the meme coin may be taking out the meme coin leadership from Pepe. This suggests that as Bonk is gaining more momentum, Pepe’s performance is slowing down after experiencing a significant price increase. 
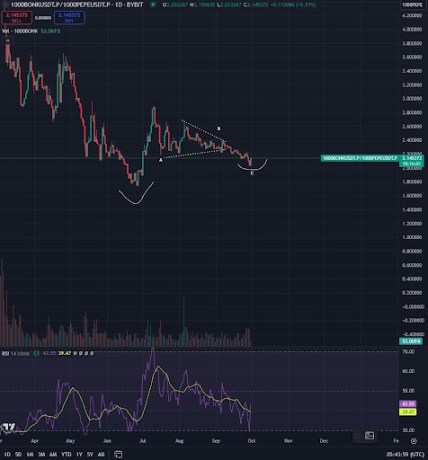
BONK 2

The analyst has identified a “higher low” on the BONK/PEPE chart, which indicates that Bonk is positioning itself for a stronger price rally than Pepe. Typically, a higher low occurs when the price of a cryptocurrency pulls back but maintains its value above its previous low level, signaling a potential continuation of an uptrend.

In the case of Bonk, Bluntz has revealed that it is currently among top meme coins like Dogwifhat (WIF), and Pepe which are presently showing signs of a strong bullish development. Despite this analysis, the cryptocurrency has declined by over 10% in the past 24 hours. 

BONK price chart from Tradingview.com
Disclaimer: For information purposes only. Past performance is not indicative of future results.
placeholder
WTI (USOIL) Is down 2.03% on Sep 25: Here Is WhyWTI (USOIL) is down 2.03% at Sep 24 22:20(UTC+0), now at $92.517, with a 7-day down of 3.63%.What is driving WTI (USOIL)’s stock price down today?The drop in WTI crude oil prices was primarily driven by
Author  TradingKey
Yesterday 04: 57
WTI (USOIL) is down 2.03% at Sep 24 22:20(UTC+0), now at $92.517, with a 7-day down of 3.63%.What is driving WTI (USOIL)’s stock price down today?The drop in WTI crude oil prices was primarily driven by
placeholder
Silver Price Forecast: XAG/USD remains steady near $64.00 as oil prices easeSilver price (XAG/USD) inches higher after two days of losses, trading around $63.90 per troy ounce during Asian hours on Friday. Non-yielding Silver is finding underlying support as inflation concerns ease following a pullback in crude oil prices.
Author  FXStreet
Yesterday 03: 30
Silver price (XAG/USD) inches higher after two days of losses, trading around $63.90 per troy ounce during Asian hours on Friday. Non-yielding Silver is finding underlying support as inflation concerns ease following a pullback in crude oil prices.
placeholder
Gold Price Forecast: Gold Drops Below $4,300, Will It Continue to Fall? As of the European session on September 24, gold prices (XAUUSD) extended their correction, dipping below $4,300 intraday to hit a low of $4,262.45. After previously rebounding close to $
Author  TradingKey
Sep 24, Thu
As of the European session on September 24, gold prices (XAUUSD) extended their correction, dipping below $4,300 intraday to hit a low of $4,262.45. After previously rebounding close to $
placeholder
Yen touches 158.37 as Tokyo reopens, then slips back — ¥15.4 trillion of intervention and the 200-day line stand between here and 160USD/JPY reached 158.37 overnight, its highest since early September, then eased to 157.88 as Japanese markets reopened after a three-day holiday. The Ministry of Finance has spent ¥15.4 trillion defending the yen since late July and the BOJ ran a rate check on September 18. The 200-day average sits at 158.43.
Author  Irene Q.
Sep 24, Thu
USD/JPY reached 158.37 overnight, its highest since early September, then eased to 157.88 as Japanese markets reopened after a three-day holiday. The Ministry of Finance has spent ¥15.4 trillion defending the yen since late July and the BOJ ran a rate check on September 18. The 200-day average sits at 158.43.
placeholder
US input costs rose at the fastest pace in four years — the September flash PMI beat is an inflation story, not a growth storyUS September flash PMIs came in far above expectations, with the composite at 58.4, a five-year high. But the detail that moved markets was input cost inflation at its fastest since October 2022, driven by fuel, transport and supply shortages. Brent is back above $100 and the 10-year Treasury yield has hit its highest since 2007.
Author  Suzie
Sep 24, Thu
US September flash PMIs came in far above expectations, with the composite at 58.4, a five-year high. But the detail that moved markets was input cost inflation at its fastest since October 2022, driven by fuel, transport and supply shortages. Brent is back above $100 and the 10-year Treasury yield has hit its highest since 2007.
goTop
quote