Can DYDX price overcome two critical hurdles and rally 25%?

Source Fxstreet
  • DYDX price approaches the $2.84 resistance, hoping for a breakout.
  • A successful flip into a support floor could trigger a 25% rally to $3.60.
  • A daily candlestick close below $2.58 will invalidate the bullish thesis for DYDX. 

DYDX price is making another comeback that could lead to handsome gains if it is successful. Investors need to watch out for the 12-hour momentum indicators, which clearly signal an imminent explosive upward move for the altcoin. 

Read more: DYDX Price Forecast: dYdX holders likely to witness 20% gains

DYDX price edges closer to breakout

DYDX price created a range, extending from $2.84 to $4.36, as it shed 35% of its value between November 15 and 21. The range low at $2.84 played a key role in supporting the price action up to January 3. But a sudden selling pressure spike back then pushed the altcoin to breach the support floor and flip it into a resistance level.

Since then, DYDX price has been hovering below it for nearly a month, with one failed attempt at a breakout. 

The Relative Strength Index (RSI) has cleared the 50 mean level and is now waiting on the Awesome Oscillator (AO) to do the same. A successful flip of the AO above its mean level will confirm the start of a bull rally. 

Often, the 12-hour time frame is regarded as key by day traders, and they take lower time frame actions based on the signals spotted here. As an example, investors can take a look at the AO flipping above the zero line and its effect on the DYDX price.

On December 22, DYDX price rallied 10% as the AO flipped above the zero line. Similarly, a 13.5% move was spotted between January 14 and 18 as the momentum indicator climbed above the baseline. 

Hence, a similar breakout, if accompanied by a flip of the $2.84 level into a support floor, will add wings to the rally. This move could potentially trigger an extension of the upswing to the aforementioned range’s midpoint at $3.60. However, this upswing needs to overcome the declining resistance level that connects the November 25 and December 27 swing highs. 

In total, this move would constitute a 25% gain from the $2.84 level. 
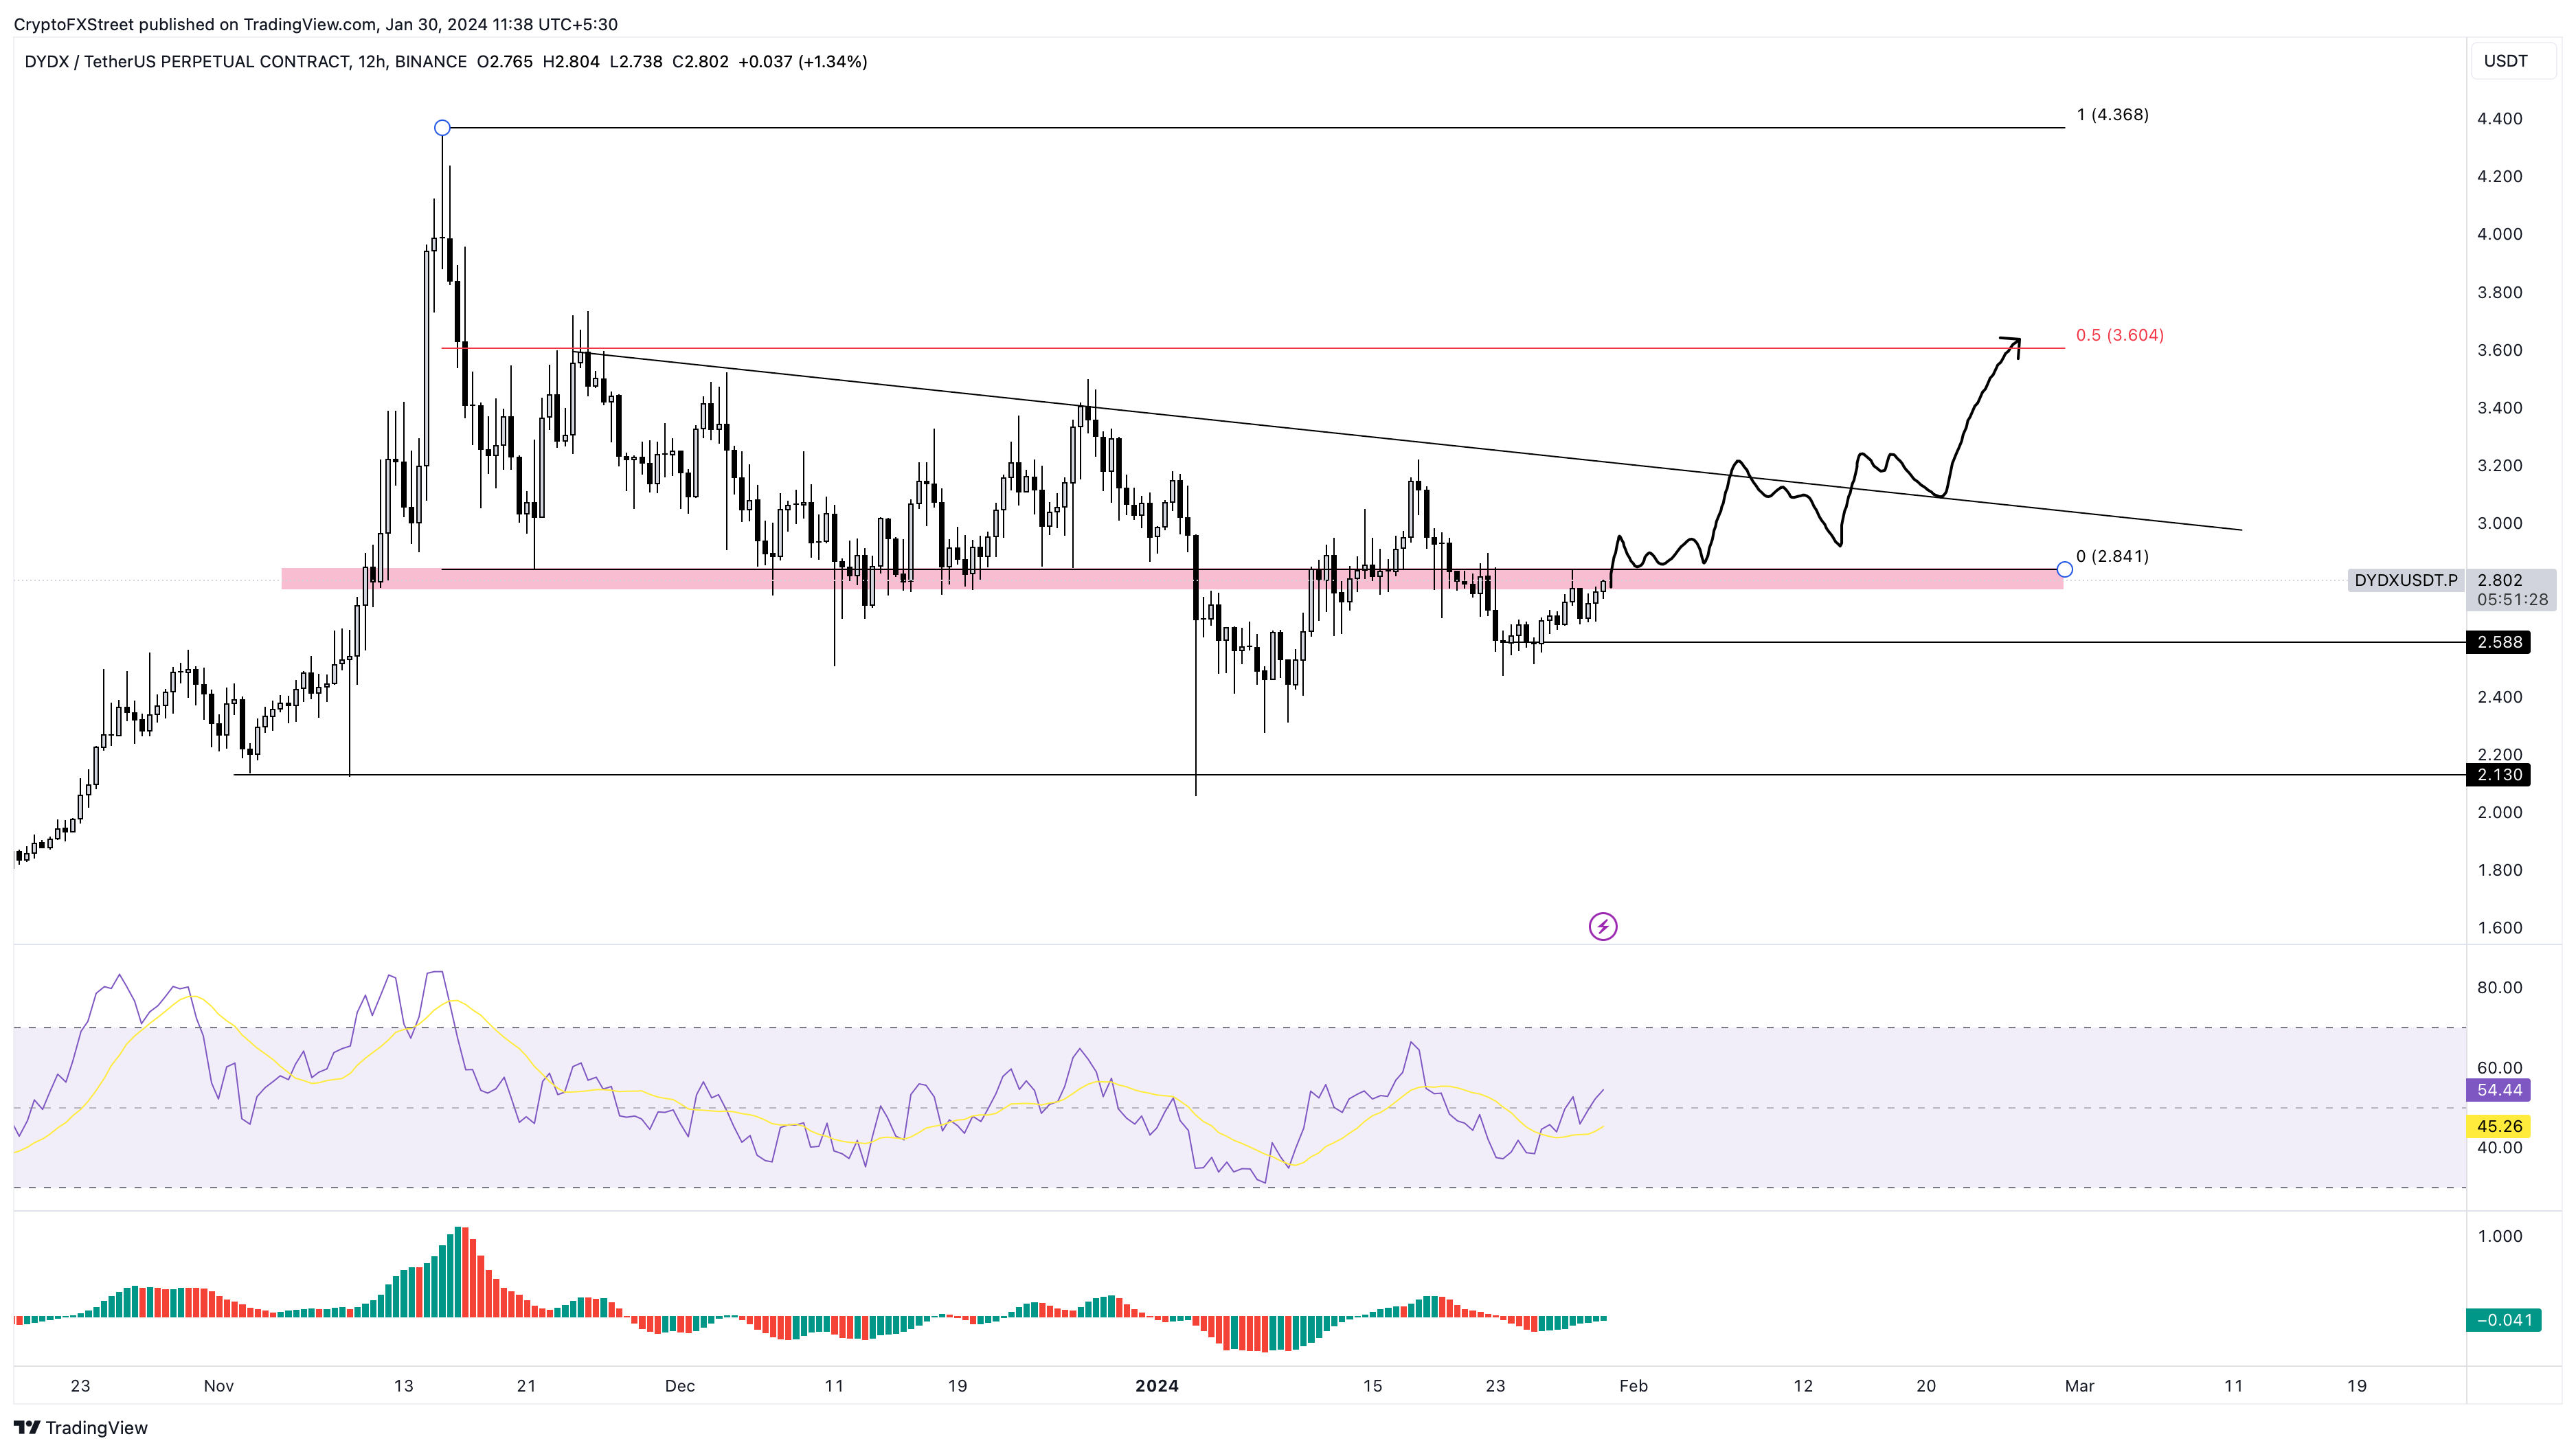
DYDX/USDT 12-hour chart

DYDX/USDT 12-hour chart

On the other hand, if DYDX price fails to overcome the $2.84 hurdle and instead gets rejected, investors should expect a retest of the $2.58 support floor. A daily candlestick close below this level will create a lower low and invalidate the bullish thesis.

Such a development could see DYDX price trigger an 18% correction to the next key foothold at $2.13, especially if the selling pressure fails to cease. 

Also read: Four altcoins most likely to bounce during Christmas holidays: LTC, STORJ, ILV, DYDX

Disclaimer: For information purposes only. Past performance is not indicative of future results.
placeholder
Gold Price Forecast: XAU/USD declines below $4,050 on USD strength and hawkish Fed comments Gold price (XAU/USD) extends the decline to around $4,030 during the early Asian session on Tuesday. The precious metal edges lower as traders dialed back expectations of a US interest rate cut next month.
Author  FXStreet
Nov 18, Tue
Gold price (XAU/USD) extends the decline to around $4,030 during the early Asian session on Tuesday. The precious metal edges lower as traders dialed back expectations of a US interest rate cut next month.
placeholder
Bitcoin Volatility Spikes: Is Options-Driven Pricing Making a Comeback?Bitcoin's volatility is surging, suggesting a shift back to options-driven price action seen before Bitcoin ETFs were launched.
Author  Mitrade
Nov 24, Mon
Bitcoin's volatility is surging, suggesting a shift back to options-driven price action seen before Bitcoin ETFs were launched.
placeholder
2025 Black Friday is coming! Which stocks may see volatility?Coming on the day right after Thanksgiving in the United States, Back Friday marks the start of the holiday shopping season. Sales data from this shopping frenzy day reflects investor confidence and consumer trends. The National Retail Federation (NRF) predicts that holiday season (Nov and Dec) retail sales in 2025 will likely exceed $1 trillion for the very first time, which represents a year-over-year increase of 3.7 to 4.2 percent. Historic data from the past decade show that the retail sector has generally outperformed the S&P 500 during the weeks before and after Black Friday. The following retailing companies are expected to be big winners:
Author  Insights
Nov 24, Mon
Coming on the day right after Thanksgiving in the United States, Back Friday marks the start of the holiday shopping season. Sales data from this shopping frenzy day reflects investor confidence and consumer trends. The National Retail Federation (NRF) predicts that holiday season (Nov and Dec) retail sales in 2025 will likely exceed $1 trillion for the very first time, which represents a year-over-year increase of 3.7 to 4.2 percent. Historic data from the past decade show that the retail sector has generally outperformed the S&P 500 during the weeks before and after Black Friday. The following retailing companies are expected to be big winners:
placeholder
Bitcoin Bleeds to $86K, But This Key Indicator Screams "The Top Isn't In"Bitcoin’s adjusted Spent Output Profit Ratio (aSOPR) has spent nearly two years coiling below the extremes seen at past bull-market peaks, even as BTC trades around $86,300 and down 9% on the week — a setup that leaves open the possibility that this cycle’s true top may still lie ahead.
Author  Mitrade
Nov 25, Tue
Bitcoin’s adjusted Spent Output Profit Ratio (aSOPR) has spent nearly two years coiling below the extremes seen at past bull-market peaks, even as BTC trades around $86,300 and down 9% on the week — a setup that leaves open the possibility that this cycle’s true top may still lie ahead.
placeholder
Bitcoin Price Rebound Gains Traction with $90K Break in SightBitcoin is trading above $87,000 and its 100-hour SMA after rebounding from $83,500, with a bearish trend line at $88,200 and resistance at $89,000–$90,000 now in focus as BTC either breaks higher toward $91,750–$94,000 or slips back toward $86,700, $85,000 and lower supports.
Author  Mitrade
Yesterday 02: 58
Bitcoin is trading above $87,000 and its 100-hour SMA after rebounding from $83,500, with a bearish trend line at $88,200 and resistance at $89,000–$90,000 now in focus as BTC either breaks higher toward $91,750–$94,000 or slips back toward $86,700, $85,000 and lower supports.
goTop
quote