

Crypto traders turn greedy, Uniswap leads, XRP lags top 20 altcoins in last 24 hours
- Uniswap leads gains in top 20 cryptocurrencies in the Coindesk20 Index, 8% gains in 24 hours.
- XRP and Aptos lag with 0.90% and -0.13% yield in the same timeframe.
- Crypto Fear and Greed Index signals “greed” after long standing fear and neutral sentiment among traders.
The CoinDesk20 Index measures the performance of the 20 largest cryptocurrencies by market capitalization from the CoinDesk Market Index (CMI). In the last 24 hours, the altcoins in the top 20 yielded gains for holders with Uniswap (UNI) leading at 8% and XRP, Aptos (APT) lagging at 0.99% and -0.10% respectively.
As altcoin performance improves, the Crypto Fear & Greed Index used to measure the sentiment among traders on a scale of 0 to 100, flashed “greed” after nearly a month of fear and neutral readings.
Uniswap leads the pack of top 20 cryptocurrencies with 8% gains
UNI, the governance token of the DeFi protocol Uniswap rallied nearly 8% in the last 24 hours, alongside other altcoins in the top 20 list. The CoinDesk20 Index is considered a pulse of the performance of the crypto market, with the majority of the assets yielding gains, it is indicative of positive performance and improving sentiment among traders.
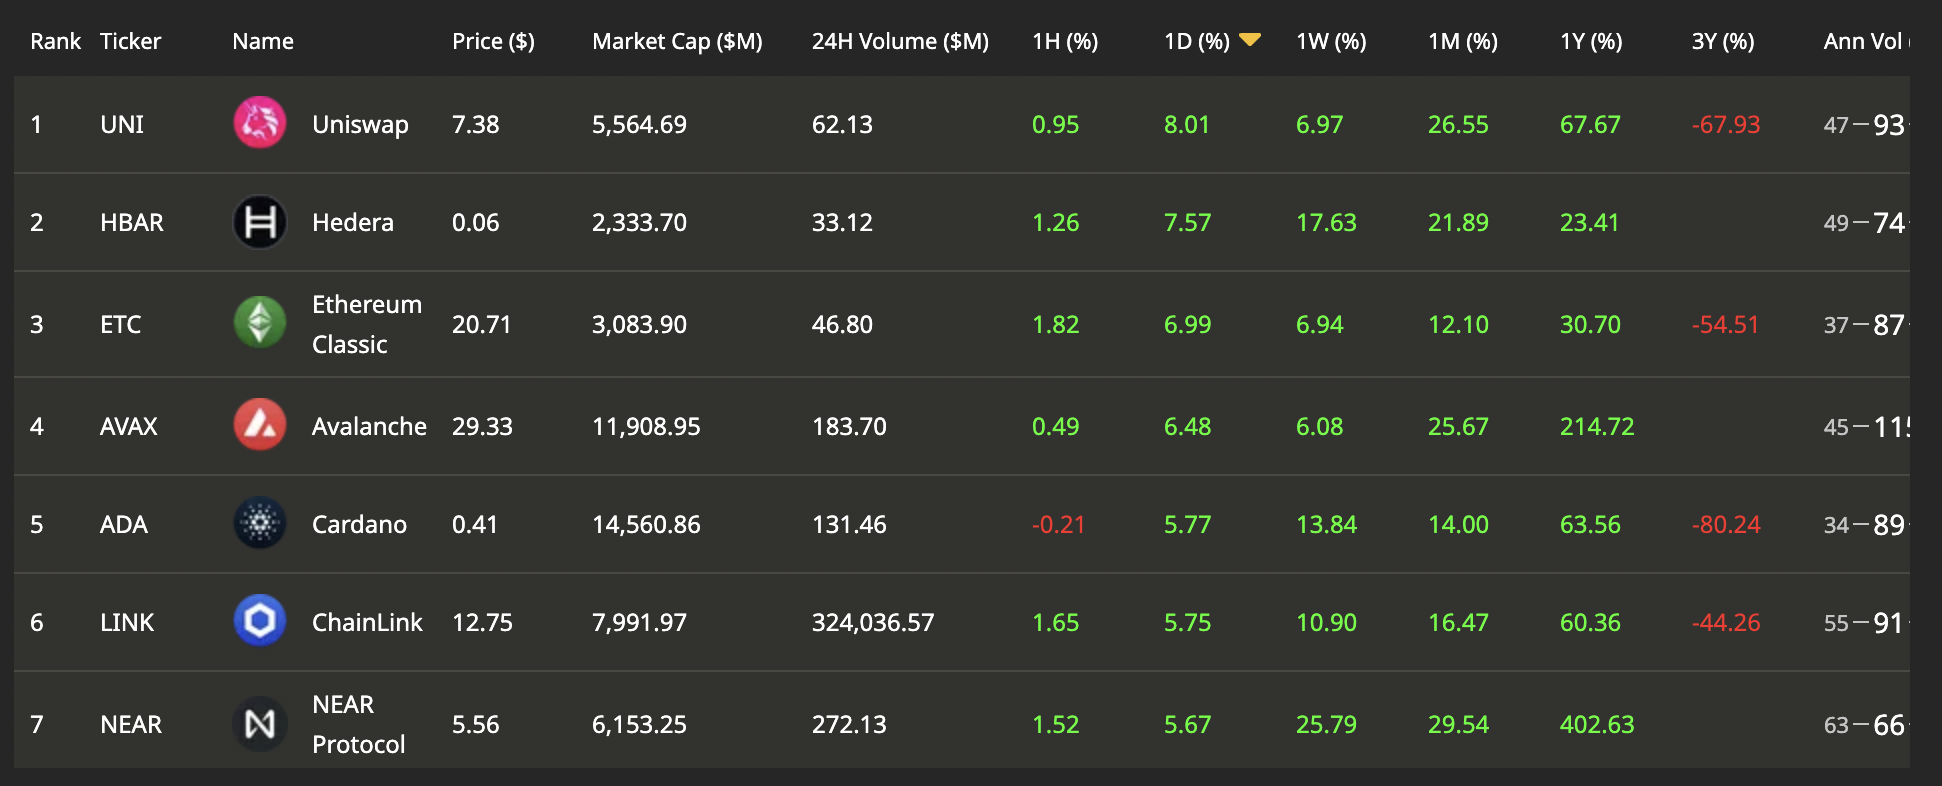
Uniswap leads Coindesk20 in gains
XRP trades at $0.59 and Aptos at $8.24 at the time of writing. These two altcoins rank among the lowest performers with 0.90% and -0.13% returns in the 24 hour timeframe. Other altcoins ranged between 3% and 5% as seen in the CoinDesk20 Index.
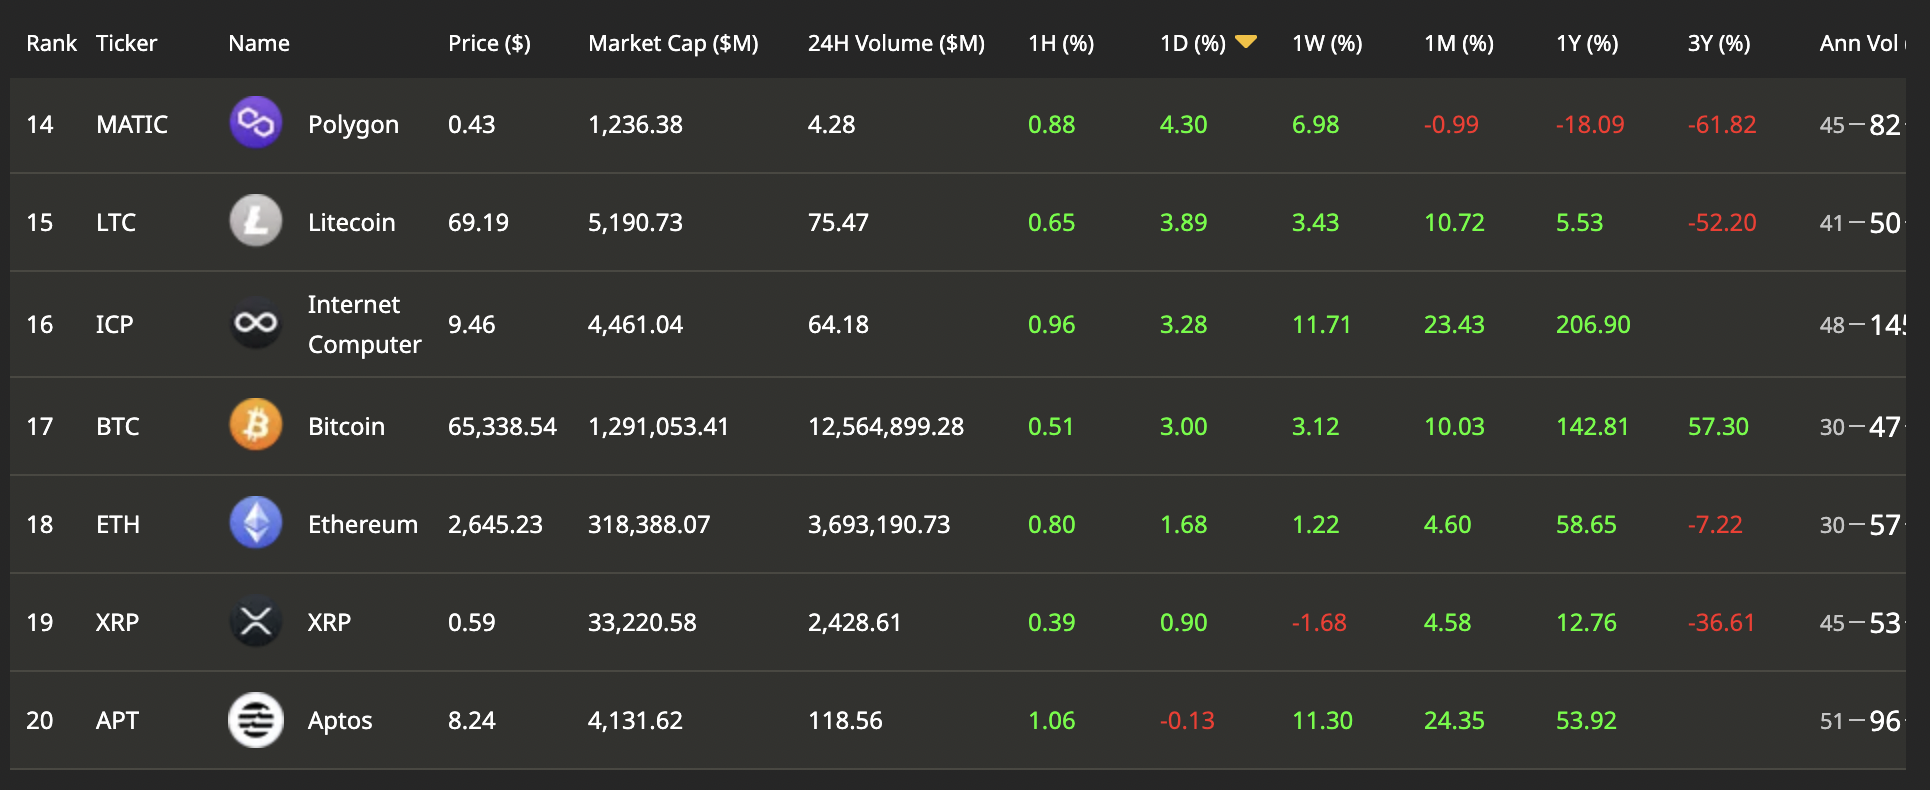
XRP and Aptos lag in performance
The Crypto Fear & Greed Index turned to “greed,” as the reading climbs to 61 on a scale of 0 to 100. The sentiment among traders has shifted from “fear” last month to a neutral reading this month and now “greed.”
Typically, when investors get too greedy the market is due for a price correction. Traders keep their eyes peeled for a change in the index’s reading.
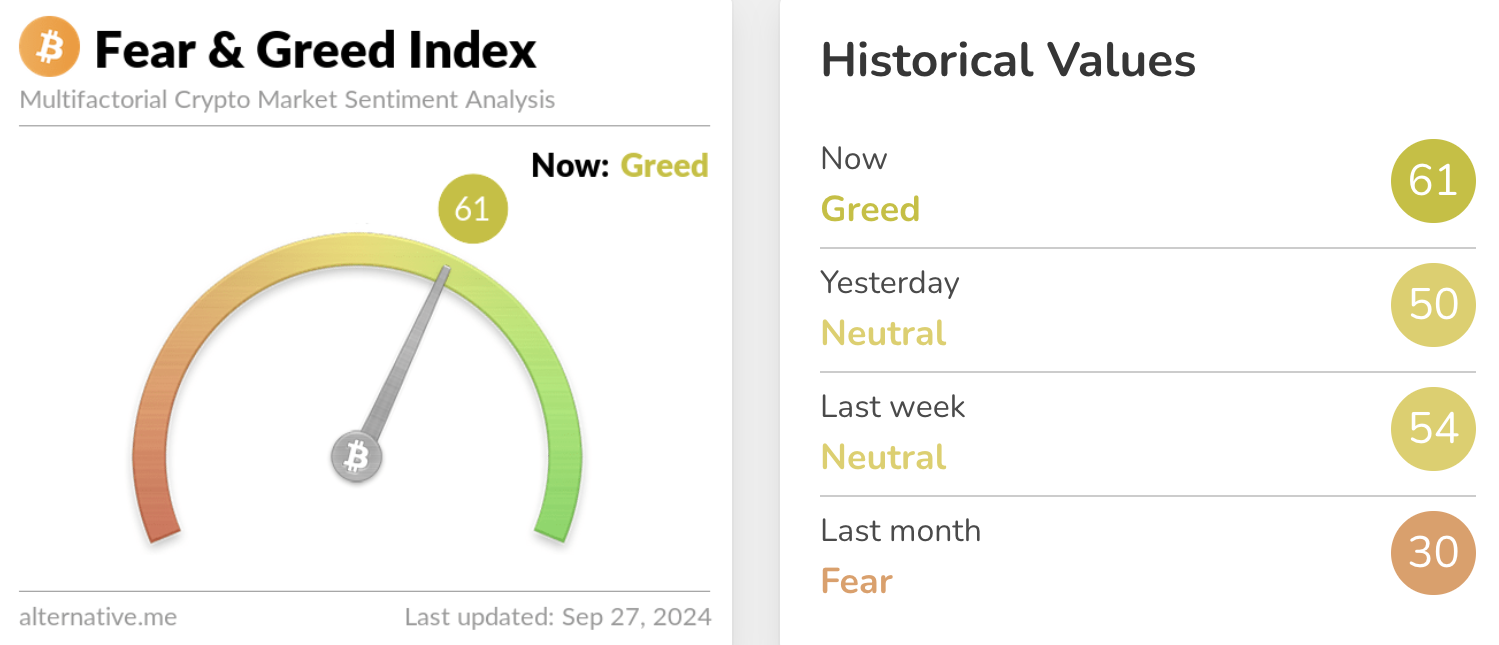
Crypto Fear & Greed Index
Bitcoin sustains above $65,000 as altcoins push higher, early on Friday.
Bitcoin, altcoins, stablecoins FAQs
Bitcoin is the largest cryptocurrency by market capitalization, a virtual currency designed to serve as money. This form of payment cannot be controlled by any one person, group, or entity, which eliminates the need for third-party participation during financial transactions.
Altcoins are any cryptocurrency apart from Bitcoin, but some also regard Ethereum as a non-altcoin because it is from these two cryptocurrencies that forking happens. If this is true, then Litecoin is the first altcoin, forked from the Bitcoin protocol and, therefore, an “improved” version of it.
Stablecoins are cryptocurrencies designed to have a stable price, with their value backed by a reserve of the asset it represents. To achieve this, the value of any one stablecoin is pegged to a commodity or financial instrument, such as the US Dollar (USD), with its supply regulated by an algorithm or demand. The main goal of stablecoins is to provide an on/off-ramp for investors willing to trade and invest in cryptocurrencies. Stablecoins also allow investors to store value since cryptocurrencies, in general, are subject to volatility.
Bitcoin dominance is the ratio of Bitcoin's market capitalization to the total market capitalization of all cryptocurrencies combined. It provides a clear picture of Bitcoin’s interest among investors. A high BTC dominance typically happens before and during a bull run, in which investors resort to investing in relatively stable and high market capitalization cryptocurrency like Bitcoin. A drop in BTC dominance usually means that investors are moving their capital and/or profits to altcoins in a quest for higher returns, which usually triggers an explosion of altcoin rallies.
Recommended Articles


