

Week Ahead: Bitcoin price likely to support these altcoin narratives this week
This week is packed with important macroeconomic and crypto events. Let’s take a look at important altcoins that might trend this week and how Bitcoin price might affect the performance of these cryptocurrencies.
Last week’s newsletter: Week Ahead: This week’s altcoin narrative and Bitcoin's fourth halving targets
Events this week
January 30
- Stellar Protocol (XLM) 20 upgrade vote
- Optimism (OP) is also set to flood the markets with $73.93 million OP tokens.
January 31
- Fed Interest Rate decision at 7:00 GMT
- Fed press conference at 7:30 GMT
- Ethereum Classic (ETC) Spiral Network Upgrade
- ImmutableX (IMX) zkEVM mainnet launch
- Render (RNDR) fee coverage ends
- Sui (SUI) is also unlocking $54.45 million tokens
February 1
- dYdX Protocol (DYDX) to unlock $91 million worth of tokens
February 2
- Non-Farm Payrolls at 1:30 GMT
Read more: SUI, YGG and AGIX holders gear up for $11 million worth of token unlocks this weekend
With these major events, altcoins are likely going to experience volatile movements, giving day traders a bunch of opportunities. At the end of the day, altcoins’ performance depends on Bitcoin price.
Bitcoin price - one crypto to rule them all
As noted in our previous publication, Bitcoin price’s weekly perspective has improved vastly after a bullish Swing Failure Pattern (SFP) below $39,851. But BTC is not out of the woods yet due to the nasty bearish SFP noted on January 8.
Read more: Bitcoin Weekly Forecast: As monthly close draws near, significance of $43,750 grows
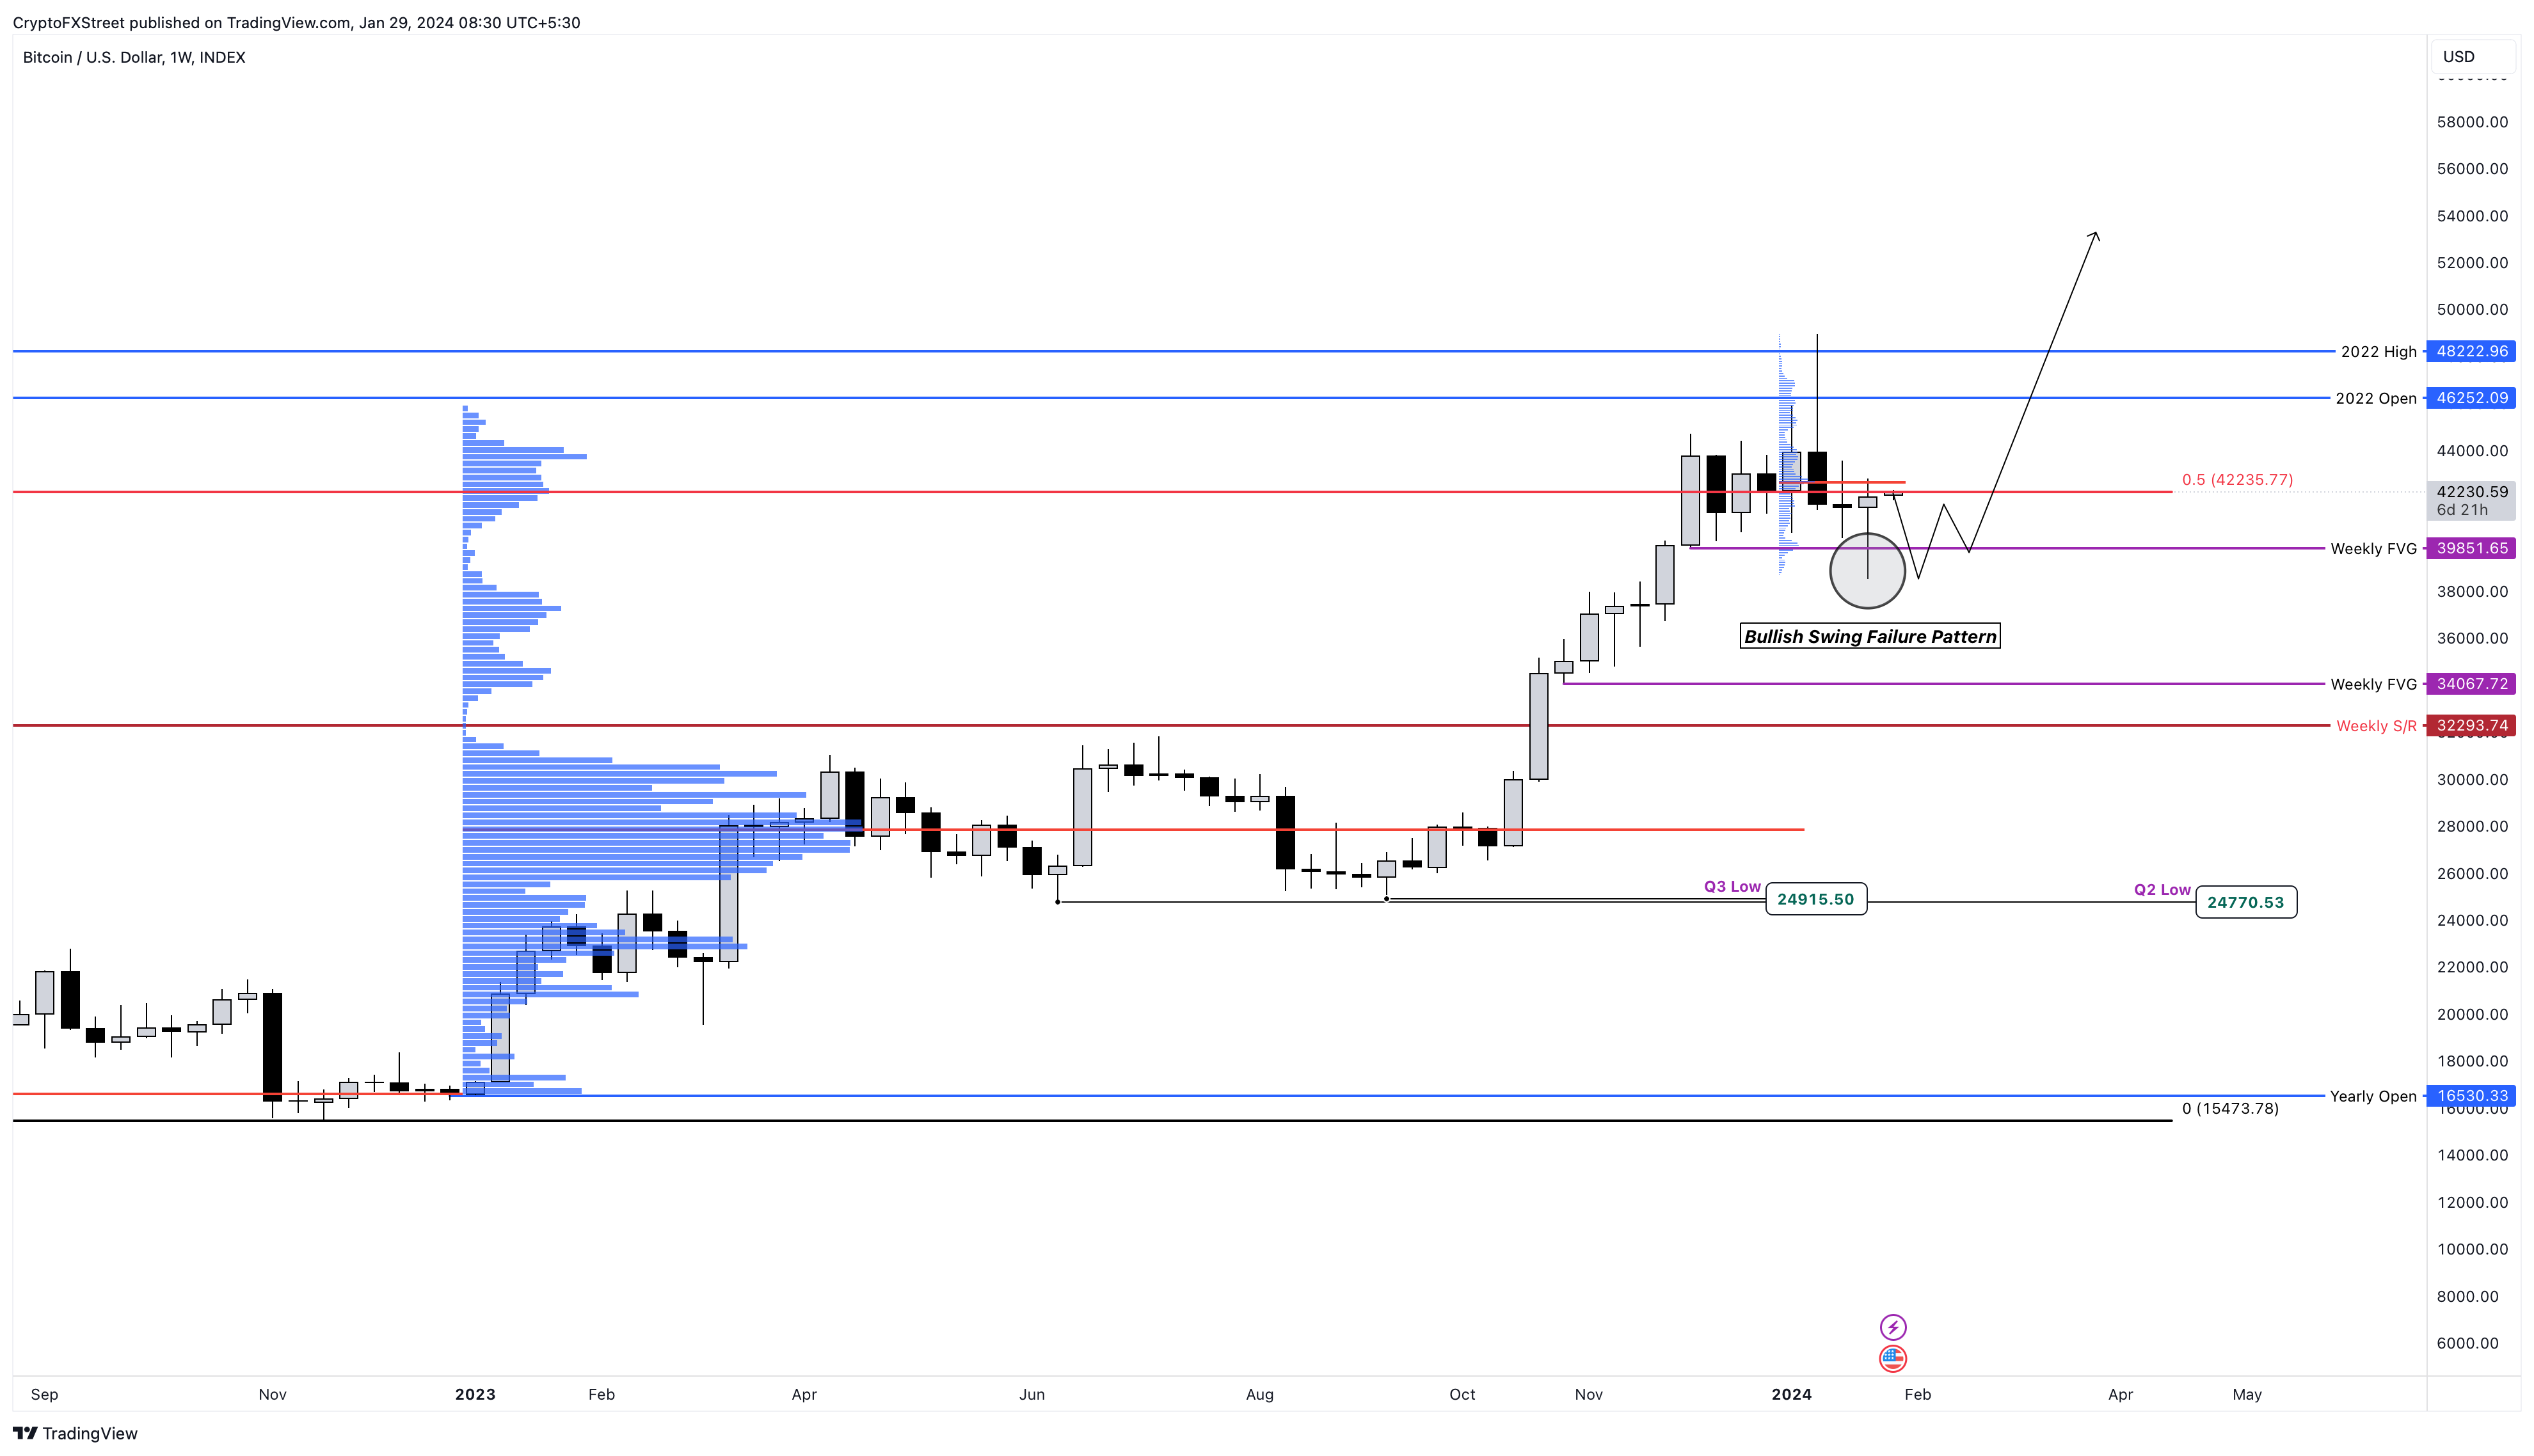
BTC/USDT 1-week chart
So, what does BTC need to do?
On the daily chart, Bitcoin price has created the first higher high after nearly two weeks of downtrend. This development notes a potential start of an uptrend. But for BTC to be out of the woods from the high timeframe perspective, it needs to produce a daily candlestick close above $48,222. This development needs to be subsequently supported by a weekly candlestick close as well.
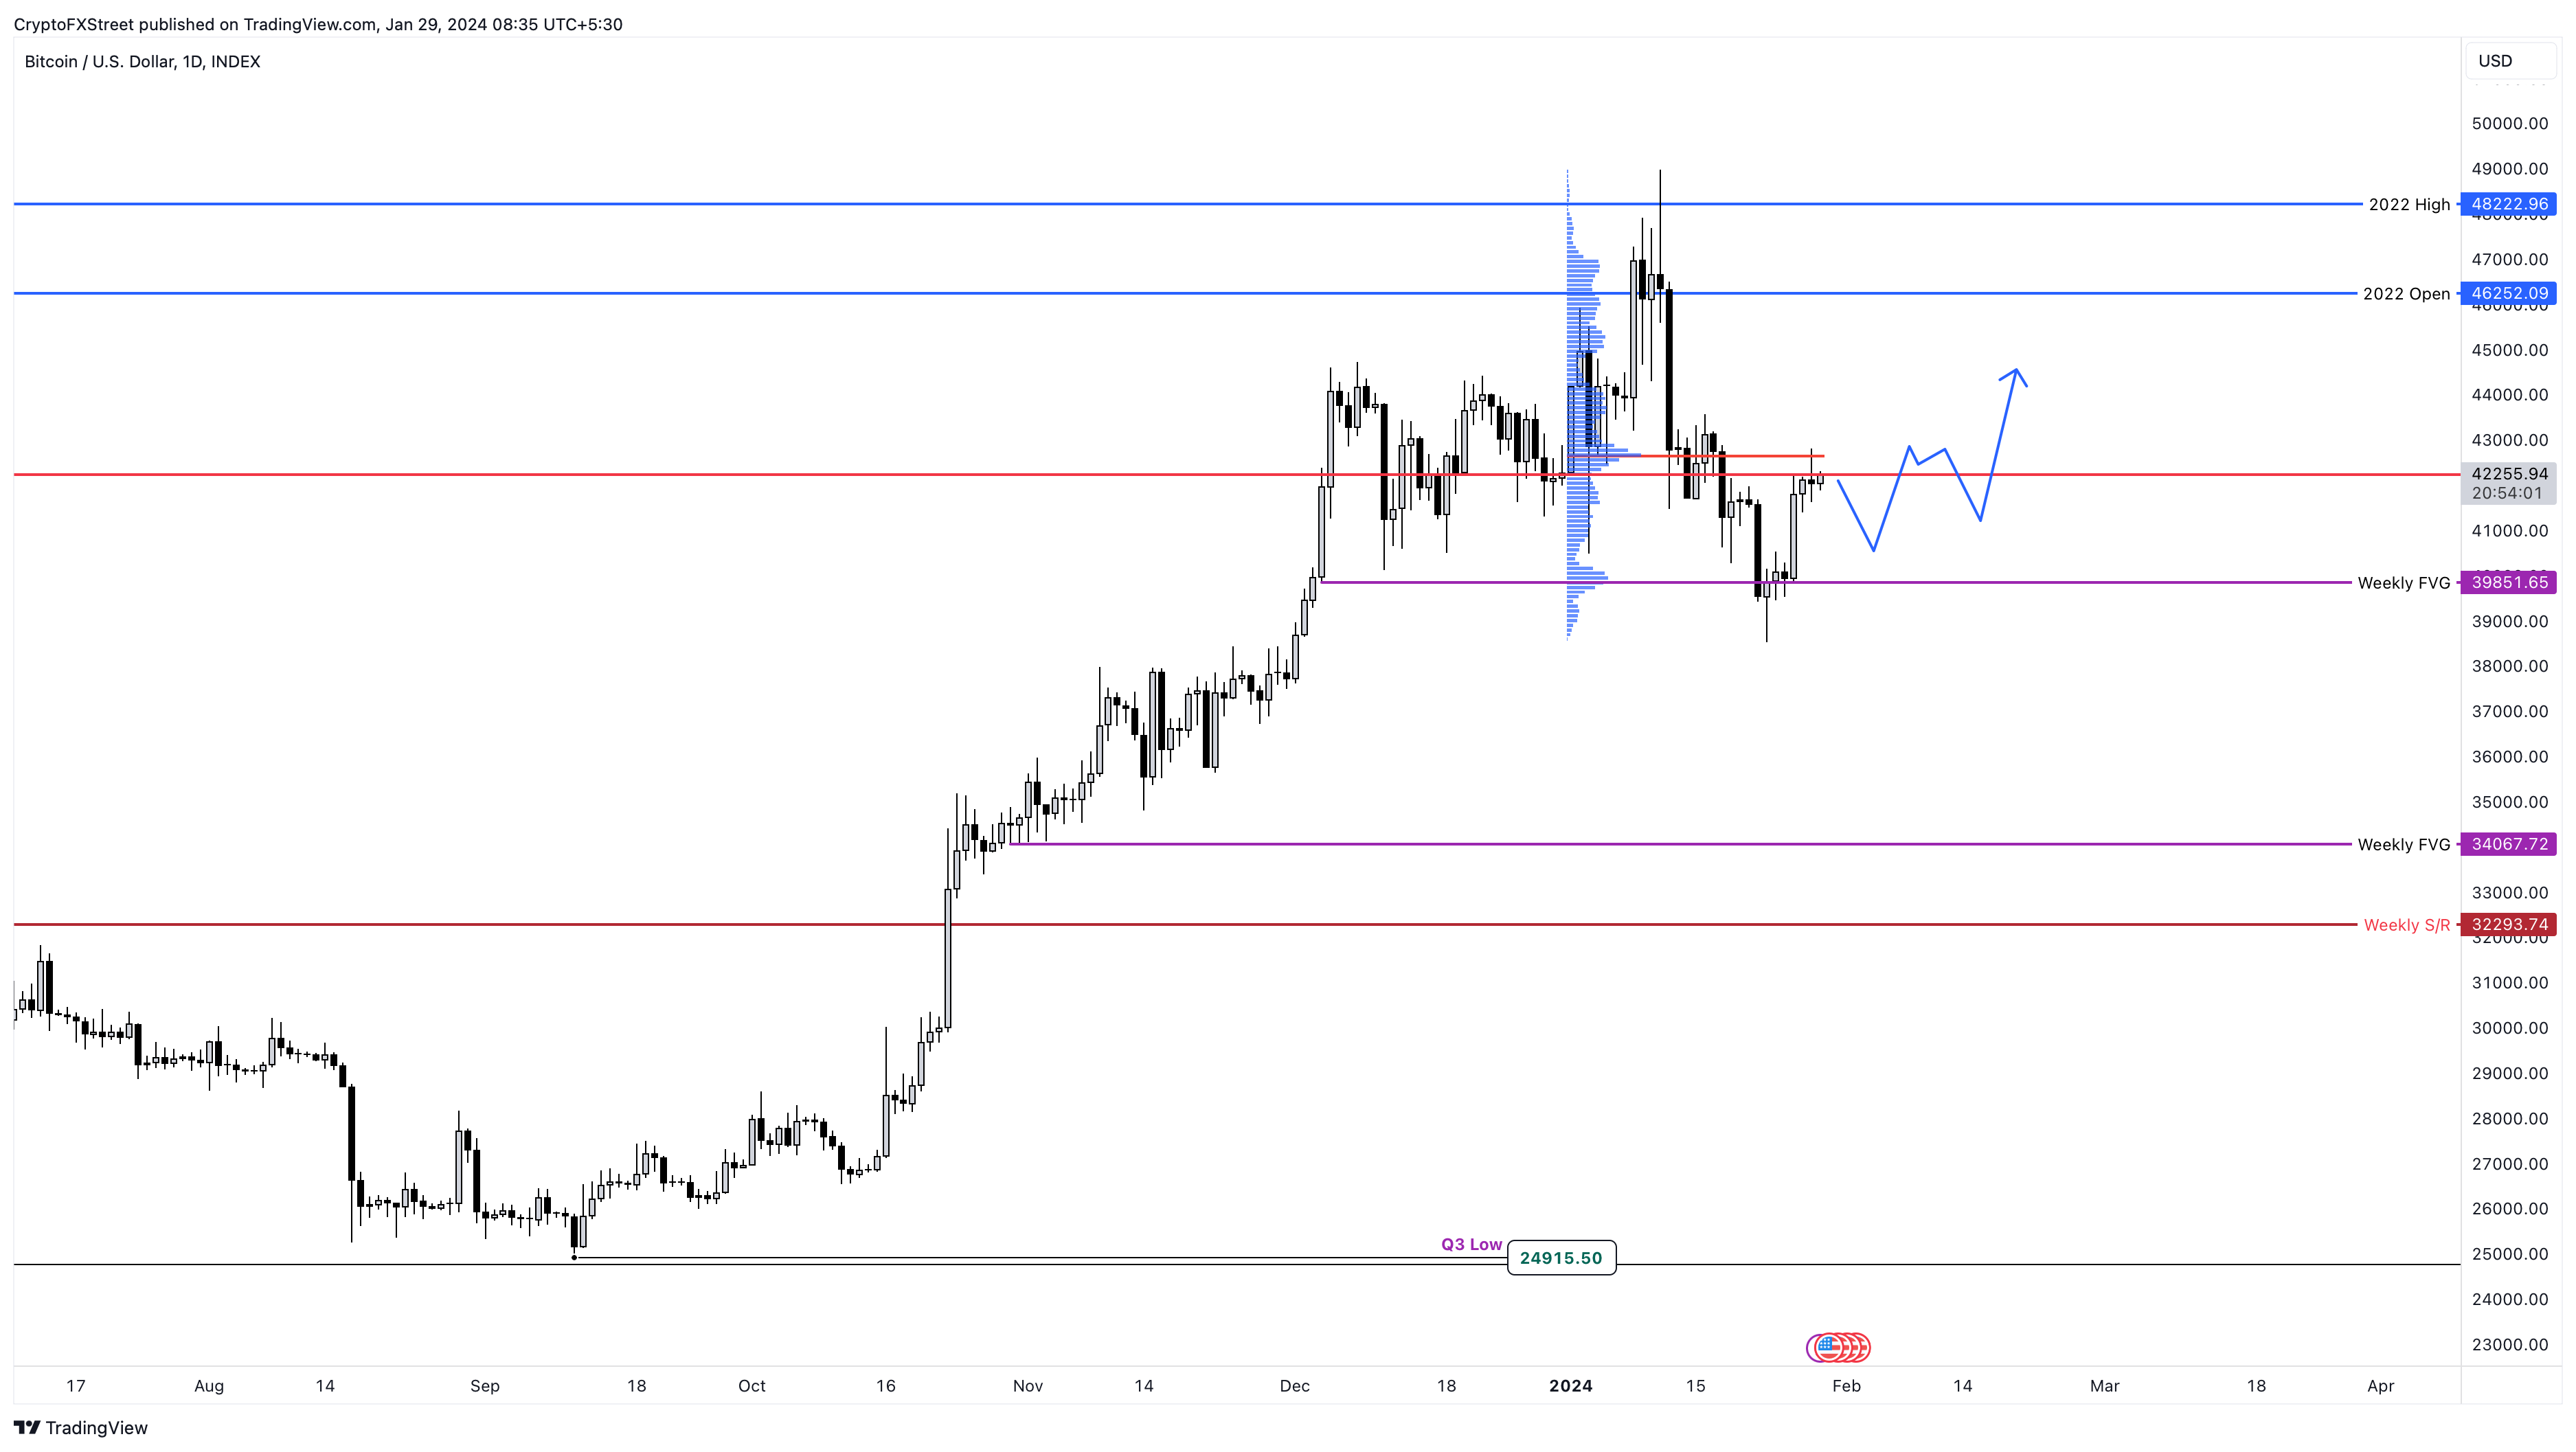
BTC/USDT 1-day chart
For now, investors can expect a minor pullback to $41,461 after creating Monday’s high. These dips are worth buying as investors can expect a bullish comeback for BTC this week, which will reflect positively on altcoins as well.
Altcoins to focus on this week
Read more: Binance Coin price approaches critical mass, 18% move ahead for BNB
- The usual Layer 1 suspects, like Avalanche (AVAX) and Solana (SOL), have made a nice comeback, with Polkadot (DOT) and Polygon (MATIC), Near Protocol (NEAR) rising alongside.
- Among the hot coins, Sui (SUI) seems to be leading the pack and is followed closely by LidoDAO (LDO).
- Conflux (CFX) and Silly Dragon (SILLY), a meme coin, have taken center stage due to the upcoming Chinese New Year narratives.
Also read: Near Protocol Price Forecast: NEAR leads recovery, eyes 100% upswing
Recommended Articles


