

TON price prediction 2024-2030: Will TON reach $100?
Key takeaways:
- Our TON price prediction anticipates a high of $7.38 by the end of 2024.
- In 2025, it will range between $3.53 and $4.45, with an average price of $3.66.
- In 2030, it will range between $23.35 and $28.25, with an average price of $24.18.
Toncoin (TON) has dropped 24% over the last 30 days and is up 1,295% since inception. Looking ahead, TON is anticipated to trade higher. It will cross the $10 mark in 2028 and $20 in 2030.
TON (The Open Network) is a decentralized protocol designed by Telegram and created by the community. The protocol is designed as a distributed supercomputer, or “super server,” that consists of TON Blockchain, TON DNS, TON Storage, and TON Sites. The native token for the network is called Toncoin.
“Will TON ever go up? Can TON reach the $10 mark? Where will TON be in five years?” These are the questions traders and investors ask. Let’s answer them and more in our Toncoin price prediction.
Overview
| Cryptocurrency | Toncoin |
| Ticker | TON |
| Current price | $5.71 |
| Market cap | $14,471,038,682 |
| Trading volume | $302,081,685 |
| Circulating supply | 2,535,825,628 |
| All-time high | $8.24 on Jun 15, 2024 |
| All-time low | $0.3906 on Sep 20, 2021 |
| 24-hour high | $5.81 |
| 24-hour low | $5.57 |
Toncoin price prediction: Technical analysis
| Metric | Value |
| Volatility (30-day variation) | 6.19% |
| 50-day SMA | $5.85 |
| 200-day SMA | $5.55 |
| Sentiment | Bearish |
| Fear and greed | 59 (Greed) |
| Green days | 16/30 (53%) |
Toncoin price analysis
Following Pavel Durov’s condemnation of his arrest and release, market sentiment has shifted positively towards Toncoin. The value of the Telegram-linked asset has surged 1.85% over the past 24 hours.
TON’s surge aligns with the percentage of its total supply held in profit, now at a monthly high, rising by almost 50% from the month’s low registered on September 8. The recovery came as a correction following Durov’s arrest in August.

Toncoin supply in profit. Source: Santiment
A surge in an asset’s supply in profit indicates that a significant portion of its circulating supply is now valued higher than when it was originally acquired. Data from IntoTheBlock further strengthens the sentiment, showing that most addresses that bought the cryptocurrency last month are hodling it, resisting the urge to sell.
Defillama shows TON’s total value locked (TVL) is now rising from a recent drop to $324 million. It is now at $428 million, still shy of the year’s high of $774 million.
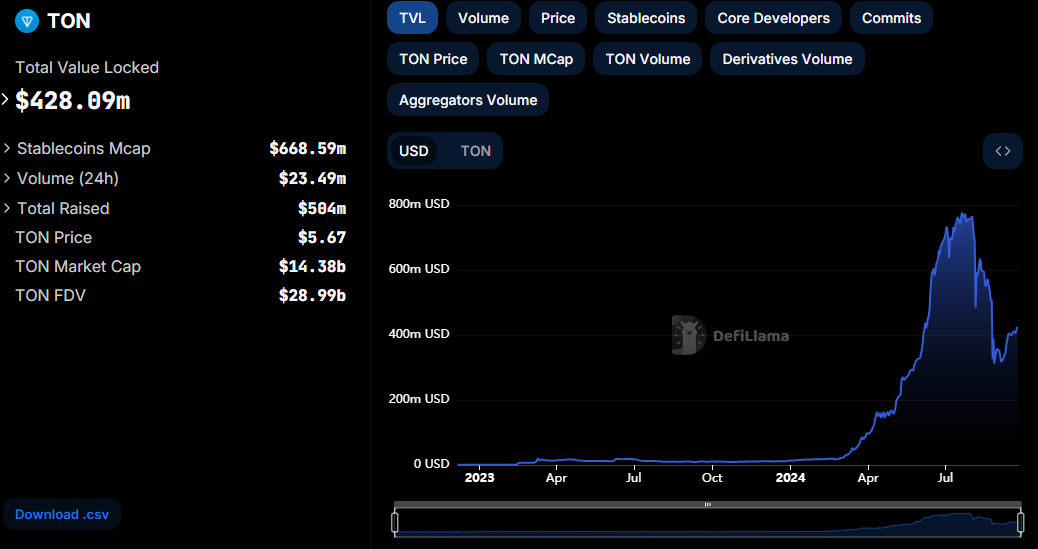
TON Total Value Locked. Source: Defillama
TON/USD 1-day chart price analysis

TON/USD 1-day chart. Image source: TradingView
The daily chart highlights TON’s recovery after Durov’s arrest and release with the formation of green engulfing candles. Notably, its volatility is dropping, as shown by the converging William Alligator trendlines, and has registered positive momentum over the last eleven days.
Toncoin technical indicators: Levels and action
Daily simple moving average (SMA)
| Period | Value ($) | Action |
| SMA 3 | 6.02 | SELL |
| SMA 5 | 5.76 | SELL |
| SMA 10 | 5.65 | BUY |
| SMA 21 | 5.44 | BUY |
| SMA 50 | 5.85 | SELL |
| SMA 100 | 6.46 | SELL |
| SMA 200 | 5.55 | BUY |
Daily exponential moving average (EMA)
| Period | Value ($) | Action |
| EMA 3 | 5.60 | BUY |
| EMA 5 | 5.78 | SELL |
| EMA 10 | 6.04 | SELL |
| EMA 21 | 6.25 | SELL |
| EMA 50 | 6.54 | SELL |
| EMA 100 | 6.48 | SELL |
| EMA 200 | 5.73 | SELL |
What to expect from TON price analysis next?
Our analysis shows the current sentiment is bearish, while the Fear and Greed Index shows greed among investors. Further analysis shows that TON is moving into consolidation after a bullish run in the last few days.
Is TON a good investment?
The Open Network enables rapid transactions and supports various decentralized applications. The network’s association with Telegram is fast-tracking the onboarding of new users into web3. According to our price predictions, TON is set to make more records in the future.
What can we expect from APT price analysis next?
Our analysis shows the current sentiment is bearish, while the Fear and Greed Index shows extreme fear among investors. The charts show TON is extending a bear run.
Why is TON down?
TON is trading at its lowest this month, and the rest of the crypto market also dropped below $2 trillion capitalization. The drop in TON value could be attributed to the slump in the crypto market.
Will TON reach $10?
Yes, TON should rise above $10 in 2028. The move will come as the market recovers to previous highs.
Will TON reach $100?
Per the Cryptopolitan price prediction, TON is unlikely to reach $100 before 2030.
Will TON reach $1000?
Per the Cryptopolitan price prediction, TON is unlikely to reach $1000 before 2030.
Does TON have a good long-term future?
According to Cryptopolitan price predictions, TON is set to trade higher in years to come. However, factors like market crashes or difficult regulations could invalidate this bullish theory.
Recent news/ opinions
Bitget and Foresight Ventures have revealed they are committed to a record $30 million investment into The Open Network to propel its ecosystem forward. The investment will entail buying TON tokens and aligning them with the network’s governance and vision of quickly expanding new dapps to the marketplace.
TON price prediction September 2024
TON will break above the $8 resistance. The TON September price prediction will range between $5.21 and $7.38. It will average at $5.78.
| Month | Potential Low ($) | Potential Average ($) | Potential High ($) |
| September | 5.21 | 5.78 | 7.38 |
TON price prediction 2024
As the second half of 2024 unfolds, TON remains bullish, as evidenced by the price registering higher highs. The price will range between $2.51 and $7.38. The average price for the month will be $5.62.
| Year | Potential Low ($) | Potential Average ($) | Potential High ($) |
| 2024 | 2.51 | 5.62 | 7.38 |
TON price prediction 2025 – 2030
| Year | Potential Low ($) | Potential Average ($) | Potential High ($) |
| 2025 | 3.53 | 3.66 | 4.45 |
| 2026 | 5.24 | 5.42 | 6.19 |
| 2027 | 7.74 | 7.96 | 8.97 |
| 2028 | 11.02 | 11.34 | 13.45 |
| 2029 | 16.18 | 16.64 | 19.17 |
| 2030 | 23.35 | 24.18 | 28.25 |
TON price prediction 2025
The Toncoin price forecast for 2025 set the high at $4.45. However, when the market corrects, TON will reach a minimum price of $3.53 and an average of $3.66.
TON price prediction 2026
The year 2026 will experience more bullish momentum. According to the TON price prediction, it will range between $5.24 and $6.19, with an average trading price of $5.42.
TON price prediction 2027
The TON prediction climbs even higher into 2027. According to the prediction, Toncoin’s price will range between $7.74 and $8.97, with an average price of $7.96.
TON price prediction 2028
The analysis suggests a further acceleration in TON’s price. TON will trade between $11.02 and $13.45. It will average at $11.34.
TON price prediction 2029
According to the TON price prediction for 2029, the price of TON will range between a minimum of $16.18, a maximum of $19.17, and an average of $16.64.
TON price prediction 2030
The TON price prediction for 2030 indicates the price will range between $23.35 and $28.25. The average price of Toncoin will average at $24.18.

TON price prediction 2024-2030
TON market price prediction: Analysts’ TON price forecast
| Firm | 2024 | 2025 | 2026 |
| DigitalCoinPrice | $12.43 | $14.53 | $20.21 |
| Swapspace | $6.17 | $7.48 | $2.95 |
| Gate.io | $5.52 | $5.93 | $6.85 |
Cryptopolitan’s TON price predictions
Our predictions show TON will achieve a high of $7.38 in the second half of 2024. In 2025, it will range between $3.53 and $4.45, with an average of $3.66. In 2030, it will range between $23.35 and $28.25, with an average of $24.18. Note the predictions are not investment advice. Seek independent professional consultation or do your research.
TON historic price sentiment
- Toncoin launched in 2018 as the Telegram Open Network (TON) but was later renamed “The Open Network” and taken over by the TON Foundation.
- In June 2020, all Toncoin tokens (98.55% of the total supply) became available for mining.
- The tokens were placed in special Giver smart contracts, enabling anyone to mine until 28 June 2022. Users mined around 200,000 TON daily.
- All the tokens were mined in two years, marking the completion of the distribution event.
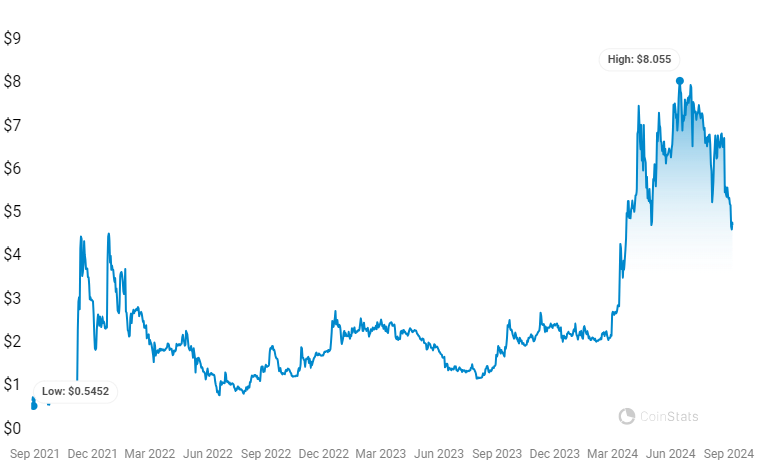
- On September 20, 2021, TON registered its all-time low price at $0.3906.
- Its first significant break came in November 2021. In days, the coin slid from $0.8 to $4.5.
- It corrected in 2022, reaching a low of $0.9.
- In 2023, it ranged between $1.1 and $2.5.
- In 2024, it registered another bull run, rising from $2.11 to its all-time high of $8.24 on Jun 15, 2024.
- It corrected later and trades at $4.7 mark.
Recommended Articles


