

Bitcoin Weekly Forecast: As monthly close draws near, significance of $43,750 grows

Source Fxstreet
  • Bitcoin price is nurturing a recovery rally after a 20% slump from the January 11 high of $48,969.
  • BTC could climb 5% into protective custody of the ascending parallel channel as a buy signal beckons.
  • Invalidation of the bullish outlook will occur upon a weekly candlestick close below $40,726.

Bitcoin (BTC) price broke consolidation on the weekly time frame on Friday, but the daily time frame shows a steep downtrend. However, recovery efforts appear underway after investment firm JPMorgan said profit-taking on GBTC has largely concluded.

Also Read: Bitcoin price downtrend likely capped, JPMorgan says, as profit-taking on GBTC largely concludes

Grayscale GBTC redemptions is most overblown narrative 

Bitcoin (BTC) price downtrend has been heavily associated with Grayscale Bitcoin Trust (GBTC) redemptions. Before the GBTC was converted into an ETF on January 11, it was one of the few ways for US-based investors to gain exposure to BTC without owning the underlying cryptocurrency.

However, following landmark approval on January 10, investors seized the opportunity to redeem their GBTC, taking profits on their trades. This meant money leaving the crypto market, hence the downward pressure on Bitcoin price. Many macro bears eye a $35,000 target for Bitcoin price or even lower.

On the flip side, there are other entities committed to accumulating with no signs of slowing. This highlights an important concern with the macro or long-term bearish forecasts making the rounds. It shows that in most instances, major market movements follow the whim of a few large players who cannot be predicted.

With the landmark approval of spot BTC ETFs, which has brought TC to Wall Street, the chances of large new entities suddenly entering the market has changed entirely. The ETFs improve the accessibility, visibility and legitimacy of Bitcoin for the more conservative players such as funds and governments. 

In most cases, this could be what is needed for some market players to add BTC to their balance sheet for the first time. This explains why despite the negative price movement, Bitcoin held in addresses with over 1,000 BTC has reached a new yearly high.

Read: Grayscale Dumps BTC Explained: Understanding short-term bearish but mid and long term bullish spot ETFs

Bitcoin price fate hangs on monthly close and critical levels of $43,750 and $42,726

This weekend is important, as it ushers in the last week of the month. Meanwhile, Bitcoin price is coming up to $43,750, which is a massive level from a trend point of view, followed by $48,000.

If Bitcoin price is able to flip the $43,750 level into support, it would signify a trend reclaimed on the weekly timeframe, shoving BTC back into the confines of the ascending channel. This, coupled with a bullish weekly candle, would likely set us up to smoke $48,000 and then see new highs.
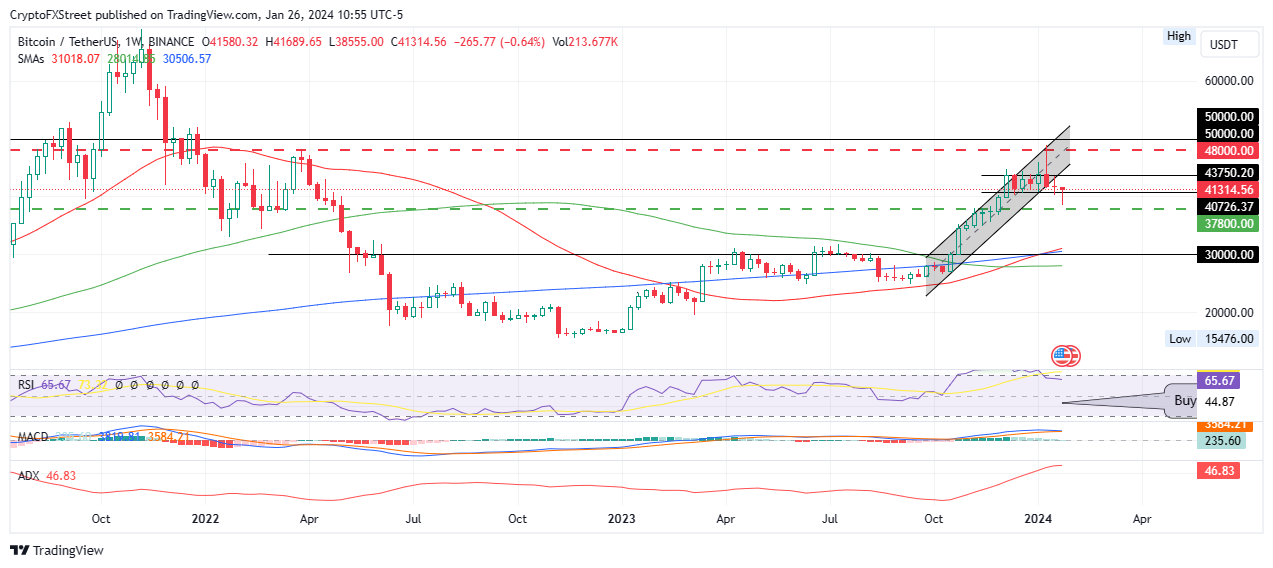
BTC/USDT

Conversely, if Bitcoin price fails to breach the $43,750 blockade, or records a weekly candlestick close below the $40,726 support, it could solidify the trend shift on the weekly time frame, ushering in an ugly weekly candle that would typically set precedence for a high time frame reversal.

Also Read: Top 3 Price Prediction Bitcoin, Ethereum, Ripple: BTC defies respectable correction, restores above $40,000

Disclaimer: For information purposes only. Past performance is not indicative of future results.
placeholder
Fed hike odds near 90% into Wednesday's decision — how to trade the dollar, gold and the S&P 500A 0.3% monthly core CPI print has lifted the market-implied probability of a 25bp Fed hike on 16 September to roughly 86.5% ~ 90%, which would be the first increase since July 2023. Here is the decision timeline, the pricing versus the forecasts, both scenarios, and the key levels for the dollar, gold and the S&P 500.
Author  Suzie
Sep 14, Mon
A 0.3% monthly core CPI print has lifted the market-implied probability of a 25bp Fed hike on 16 September to roughly 86.5% ~ 90%, which would be the first increase since July 2023. Here is the decision timeline, the pricing versus the forecasts, both scenarios, and the key levels for the dollar, gold and the S&P 500.
placeholder
【Daily Brief】10-year Treasury yield briefly tops 5%, S&P 500 slips to 7,602 and the dollar firms at 99.3 as the Fed's decision eve beginsThe 10-year Treasury yield touched 5.014% on Monday — its first print above 5% since October 2023 — while the S&P 500 closed 0.48% lower at 7,619.98 and the dollar index firmed to 99.3. Here is the full market wrap ahead of Wednesday's FOMC decision, the dot plot and the August retail sales report, plus today's CLARITY Act Senate vote.
Author  Irene Q.
Sep 15, Tue
The 10-year Treasury yield touched 5.014% on Monday — its first print above 5% since October 2023 — while the S&P 500 closed 0.48% lower at 7,619.98 and the dollar index firmed to 99.3. Here is the full market wrap ahead of Wednesday's FOMC decision, the dot plot and the August retail sales report, plus today's CLARITY Act Senate vote.
placeholder
Silver breaks $64 as precious metals rebound — can gold hold the $4,280 line into the Fed decision?Silver has climbed back above $64 an ounce for the first time this week, leading a broad rebound across precious metals hours before the Federal Reserve delivers what is expected to be its first rate hike since 2023. Spot silver was last at $64.64, up 1.49% on the day, while gold reclaimed $4,300 and platinum and palladium both advanced. The question now is whether the bounce is a genuine turn — or a pause before the Fed's dot plot decides the next move.
Author  Suzie
Yesterday 08: 40
Silver has climbed back above $64 an ounce for the first time this week, leading a broad rebound across precious metals hours before the Federal Reserve delivers what is expected to be its first rate hike since 2023. Spot silver was last at $64.64, up 1.49% on the day, while gold reclaimed $4,300 and platinum and palladium both advanced. The question now is whether the bounce is a genuine turn — or a pause before the Fed's dot plot decides the next move.
placeholder
Bitcoin falls below $75,000 as the CLARITY Act fails in the Senate — what the vote means for cryptoThe US Senate blocked the Digital Asset Market CLARITY Act in a 49-50 procedural vote, sending Bitcoin briefly below $75,000 — its biggest one-day drop since June. Ethereum fell more than 8%, Coinbase slid 10% and $75 billion of crypto market value evaporated. Here is what the vote was, why it failed, and the levels that matter now.
Author  Suzie
23 hours ago
The US Senate blocked the Digital Asset Market CLARITY Act in a 49-50 procedural vote, sending Bitcoin briefly below $75,000 — its biggest one-day drop since June. Ethereum fell more than 8%, Coinbase slid 10% and $75 billion of crypto market value evaporated. Here is what the vote was, why it failed, and the levels that matter now.
placeholder
Dow drops 631 points as the Fed hikes — but futures are rebounding: what's next for US stocks?The Dow fell 631 points and the S&P 500 closed below 7,600 after the Fed hiked rates for the first time since 2023, with the dot plot showing 16 of 18 officials expect more tightening. Asia-session futures are already recovering — here are the levels and analyst views that decide whether 7,500 holds.
Author  Irene Q.
5 hours ago
The Dow fell 631 points and the S&P 500 closed below 7,600 after the Fed hiked rates for the first time since 2023, with the dot plot showing 16 of 18 officials expect more tightening. Asia-session futures are already recovering — here are the levels and analyst views that decide whether 7,500 holds.
Related Instrument
goTop
quote